| Symbol | Name | Price | Change | Change % | Avg. Volume | Chart | |
|---|---|---|---|---|---|---|---|
 BRK.A BRK.A
| Berkshire Hathaway Inc | 816,376.50 | 203,787.51 | 33.27% | 3,149 |
| |
 FICO FICO
| Fair Isaac Inc | 1,952.31 | 776.52 | 66.04% | 177,873 |
| |
 TPL TPL
| Texas Pacific Land Corporation | 1,334.63 | 745.25 | 126.45% | 152,862 |
| |
 AZO AZO
| AutoZone Inc | 3,609.33 | 702.30 | 24.16% | 131,696 |
| |
 SPOT SPOT
| Spotify Technology SA | 627.00 | 354.37 | 129.98% | 2,086,933 |
| |
 MKL MKL
| Markel Group Inc | 1,803.15 | 342.47 | 23.45% | 48,726 |
| |
 NOW NOW
| ServiceNow Inc | 947.09 | 243.45 | 34.60% | 1,490,212 |
| |
 GEV GEV
| GE Vernova Inc | 372.0235 | 229.03 | 160.17% | 3,322,916 |
| |
 UI UI
| Ubiquiti Inc | 313.07 | 205.68 | 191.53% | 80,232 |
| |
 GHC GHC
| Graham Holdings Company | 911.41 | 199.41 | 28.01% | 16,980 |
| |
 CVNA CVNA
| Carvana Co | 237.25 | 165.50 | 230.66% | 4,003,526 |
| |
 LLY LLY
| Eli Lilly and Co | 887.40 | 162.92 | 22.49% | 3,421,701 |
| |
 MCK MCK
| McKesson Corporation | 695.00 | 157.54 | 29.31% | 885,490 |
| |
 BLK BLK
| BlackRock Inc | 907.69 | 153.38 | 20.33% | 666,568 |
| |
 TDG TDG
| Transdigm Group Incorporated | 1,378.13 | 144.73 | 11.73% | 253,415 |
| |
 BH.A BH.A
| Biglari Holdings Inc | 1,117.80 | 134.98 | 13.73% | 201 |
| |
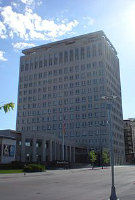 BRK.B BRK.B
| Berkshire Hathaway Inc | 530.25 | 125.66 | 31.06% | 4,076,203 |
| |
 GS GS
| Goldman Sachs Group Inc | 545.00 | 124.01 | 29.46% | 2,356,785 |
| |
 CRS CRS
| Carpenter Technology Corp | 198.02 | 118.01 | 147.49% | 745,666 |
| |
 EAT EAT
| Brinker International Inc | 161.745 | 114.69 | 243.70% | 1,449,618 |
| |
 GPI GPI
| Group 1 Automotive Inc | 406.38 | 111.38 | 37.76% | 142,975 |
| |
 PEN PEN
| Penumbra Inc | 302.99 | 98.77 | 48.36% | 418,325 |
| |
 SAP SAP
| SAP SE | 277.96 | 96.59 | 53.26% | 996,071 |
| |
 TDY TDY
| Teledyne Technologies Inc | 458.60 | 95.06 | 26.15% | 256,460 |
| |
 FIX FIX
| Comfort Systems USA Inc | 397.43 | 91.43 | 29.88% | 434,891 |
| |
 AGX AGX
| Argan Inc | 150.70 | 90.01 | 148.31% | 294,834 |
| |
 MSI MSI
| Motorola Solutions Inc | 430.22 | 87.62 | 25.58% | 769,189 |
| |
 CW CW
| Curtiss Wright Corp | 338.28 | 86.61 | 34.41% | 262,995 |
| |
 AJG AJG
| Arthur J Gallagher and Company | 322.30 | 86.45 | 36.65% | 1,254,685 |
| |
 GWRE GWRE
| GuideWire Software Inc | 197.44 | 85.46 | 76.32% | 894,001 |
| |
 RBC RBC
| RBC Bearings Incorporated | 327.12 | 84.43 | 34.79% | 160,030 |
| |
 VMI VMI
| Valmont Industries | 293.17 | 81.82 | 38.71% | 147,542 |
| |
 GWW GWW
| WW Grainger Inc | 1,013.87 | 78.29 | 8.37% | 253,224 |
| |
 LRN LRN
| Stride Inc | 140.90 | 77.70 | 122.94% | 826,027 |
| |
 RDDT RDDT
| Reddit Inc | 118.32 | 76.76 | 184.70% | 5,591,602 |
| |
 CACI CACI
| CACI International Inc | 449.15 | 75.79 | 20.30% | 263,346 |
| |
 LNG LNG
| Cheniere Energy Inc | 233.18 | 75.25 | 47.65% | 1,848,820 |
| |
 DE DE
| Deere and Co | 459.30 | 73.53 | 19.06% | 1,394,908 |
| |
 RCL RCL
| Royal Caribbean Group | 212.00 | 72.75 | 52.24% | 2,322,516 |
| |
 MA MA
| MasterCard Incorporated | 533.48 | 72.54 | 15.74% | 2,606,788 |
| |
 TYL TYL
| Tyler Technologies Corp | 524.64 | 71.90 | 15.88% | 254,106 |
| |
 HWM HWM
| Howmet Aerospace Inc | 135.76 | 71.71 | 111.96% | 2,715,555 |
| |
 PM PM
| Philip Morris International Inc | 170.58 | 71.18 | 71.61% | 5,532,576 |
| |
 MUSA MUSA
| Murphy USA Inc | 491.37 | 71.11 | 16.92% | 203,329 |
| |
 MSCI MSCI
| MSCI Inc | 535.36 | 70.87 | 15.26% | 545,282 |
| |
 SE SE
| Sea Limited | 128.30 | 66.65 | 108.11% | 4,615,054 |
| |
 IBM IBM
| International Business Machines Corp | 232.50 | 63.79 | 37.81% | 4,227,037 |
| |
 LII LII
| Lennox International Inc | 527.31 | 63.75 | 13.75% | 347,611 |
| |
 V V
| Visa Inc | 335.15 | 62.54 | 22.94% | 7,153,614 |
| |
 TKO TKO
| Tko Group Holdings Inc | 157.10 | 62.10 | 65.37% | 1,019,571 |
| |
 PH PH
| Parker Hannifin Corp | 598.02 | 61.76 | 11.52% | 710,153 |
| |
 TRGP TRGP
| Targa Resources Corporation | 177.62 | 60.61 | 51.80% | 1,723,608 |
| |
 GDDY GDDY
| GoDaddy Inc | 183.40 | 60.58 | 49.32% | 1,463,610 |
| |
 MCO MCO
| Moodys Corp | 438.62 | 60.01 | 15.85% | 775,092 |
| |
 SPGI SPGI
| S&P Global Inc | 480.00 | 58.09 | 13.77% | 1,219,525 |
| |
 ATGE ATGE
| Adtalem Global Education Inc | 105.00 | 58.06 | 123.69% | 435,359 |
| |
 VST VST
| Vistra Corp | 126.85 | 57.55 | 83.04% | 7,807,382 |
| |
 GRMN GRMN
| Garmin Ltd | 198.96 | 57.30 | 40.45% | 859,570 |
| |
 AMP AMP
| Ameriprise Financial Inc | 466.80 | 56.87 | 13.87% | 485,597 |
| |
 DFS DFS
| Discover Financial Services | 184.71 | 55.84 | 43.33% | 1,593,927 |
| |
 XYZ XYZ
| Block Inc | 58.2998 | 55.30 | 1,843.33% | 2,327,795 |
| |
 EME EME
| EMCOR Group Inc | 410.24 | 54.89 | 15.45% | 460,029 |
| |
 RMD RMD
| ResMed Inc | 237.8663 | 54.80 | 29.93% | 1,018,941 |
| |
 ESE ESE
| ESCO Technologies Inc | 157.86 | 54.77 | 53.13% | 126,802 |
| |
 AEM AEM
| Agnico Eagle Mines Ltd | 118.50 | 54.63 | 85.53% | 2,423,293 |
| |
 RL RL
| Ralph Lauren Corporation | 219.96 | 53.97 | 32.51% | 834,306 |
| |
 AIT AIT
| Applied Industrial Technologies Inc | 238.61 | 53.77 | 29.09% | 291,308 |
| |
 PGR PGR
| Progressive Corporation | 265.50 | 53.36 | 25.15% | 2,616,393 |
| |
 TT TT
| Trane Technologies plc | 347.97 | 52.96 | 17.95% | 1,287,901 |
| |
 WELL WELL
| Welltower OP Inc | 146.05 | 52.87 | 56.74% | 2,800,694 |
| |
 LOAR LOAR
| Loar Holdings Inc | 96.89 | 51.89 | 115.31% | 405,920 |
| |
 RSG RSG
| Republic Services Inc | 243.56 | 51.88 | 27.07% | 1,101,454 |
| |
 FNV FNV
| Franco Nevada Corp | 170.09 | 51.66 | 43.62% | 705,953 |
| |
 JPM JPM
| JP Morgan Chase and Co | 243.01 | 50.76 | 26.40% | 9,564,260 |
| |
 RACE RACE
| Ferrari NV | 460.80 | 49.91 | 12.15% | 325,689 |
| |
 FLUT FLUT
| Flutter Entertainment PLC | 233.30 | 49.72 | 27.08% | 1,779,747 |
| |
 CNR CNR
| Core Natural Resources Inc | 74.12 | 49.46 | 200.57% | 274,730 |
| |
 LAD LAD
| Lithia Motors Inc | 292.87 | 48.54 | 19.87% | 306,850 |
| |
 TRV TRV
| The Travelers Companies Inc | 259.16 | 46.66 | 21.96% | 1,278,685 |
| |
 BABA BABA
| Alibaba Group Holding Limited | 120.28 | 46.48 | 62.97% | 20,822,235 |
| |
 MMM MMM
| 3M Company | 137.70 | 46.11 | 50.34% | 4,154,862 |
| |
 COR COR
| Cencora Inc | 285.90 | 45.87 | 19.11% | 1,510,492 |
| |
 GL GL
| Globe Life Inc | 122.96 | 45.66 | 59.07% | 992,523 |
| |
 CLS CLS
| Celestica Inc | 89.60 | 45.31 | 102.30% | 3,087,498 |
| |
 JLL JLL
| Jones Lang LaSalle Inc | 224.58 | 45.24 | 25.23% | 315,351 |
| |
 BMA BMA
| Banco Macro SA | 93.79 | 44.99 | 92.19% | 339,647 |
| |
 PIPR PIPR
| Piper Sandler Companies | 238.04 | 44.65 | 23.09% | 115,850 |
| |
 DRI DRI
| Darden Restaurants Inc | 200.50 | 44.23 | 28.30% | 1,280,716 |
| |
 BURL BURL
| Burlington Stores Inc | 222.00 | 44.03 | 24.74% | 977,194 |
| |
 BR BR
| Broadridge Financial Solutions Inc | 237.72 | 43.50 | 22.40% | 517,942 |
| |
 LYV LYV
| Live Nation Entertainment Inc | 132.00 | 43.45 | 49.07% | 2,231,092 |
| |
 HEI HEI
| HEICO Corp | 246.01 | 43.00 | 21.18% | 459,587 |
| |
 PRI PRI
| Primerica Inc | 261.36 | 42.55 | 19.45% | 157,877 |
| |
 PAYC PAYC
| Paycom Software Inc | 227.60 | 42.16 | 22.74% | 716,048 |
| |
 GE GE
| GE Aerospace | 198.50 | 41.14 | 26.14% | 5,320,606 |
| |
 MTZ MTZ
| MasTec Inc | 125.11 | 40.48 | 47.83% | 922,942 |
| |
 MCD MCD
| McDonalds Corp | 316.75 | 39.99 | 14.45% | 3,542,716 |
| |
 ATO ATO
| Atmos Energy Corp | 158.14 | 39.76 | 33.58% | 917,144 |
| |
 AMT AMT
| American Tower Corporation | 210.82 | 39.07 | 22.75% | 2,472,399 |
| |
 PJT PJT
| PJT Partners Inc | 134.82 | 38.41 | 39.84% | 242,995 |
|

It looks like you are not logged in. Click the button below to log in and keep track of your recent history.