TC Energy completes the sale of Portland Natural Gas Transmission System
August 15 2024 - 5:00PM

News Release – TC Energy Corporation (TSX, NYSE: TRP) (TC Energy or
the Company) and its partner Northern New England Investment
Company, Inc., a subsidiary of Énergir L.P. (Énergir), today
announced the successful completion of the sale of Portland Natural
Gas Transmission System (PNGTS). The gross purchase price of
US$1.14 billion includes US$250 million of outstanding Senior
Notes held at PNGTS and consolidated on TC Energy’s balance
sheet, assumed by the buyers.
“Completing this transaction demonstrates continued progress
towards delivering on $3 billion in asset divestitures and
enhancing our balance sheet strength,” said François Poirier, TC
Energy’s President and Chief Executive Officer. “We remain focused
on reaching our 4.75 times debt-to-EBITDA upper limit by year-end,
and today’s announcement takes us one step closer to achieving this
goal.”
Cash proceeds will be split pro-rata according to the PNGTS
ownership interests prior to the sale (TC Energy 61.7 per cent,
Énergir 38.3 per cent). TC Energy is providing customary transition
services and will continue to work jointly with the buyers to
ensure the safe and orderly transition of this critical natural gas
system.
About TC EnergyWe’re a team of 7,000+ energy
problem solvers working to safely move, generate and store the
energy North America relies on. Today, we’re delivering solutions
to the world’s toughest energy challenges – from innovating to
deliver the natural gas that feeds LNG to global markets, to
working to reduce emissions from our assets, to partnering with our
neighbours, customers and governments to build the energy system of
the future. It’s all part of how we continue to deliver sustainable
returns for our investors and create value for communities.
TC Energy’s common shares trade on the Toronto (TSX) and New
York (NYSE) stock exchanges under the symbol TRP. To learn more,
visit us at TCEnergy.com.
FORWARD-LOOKING INFORMATIONThis release
contains certain information that is forward-looking and is subject
to important risks and uncertainties (such statements are usually
accompanied by words such as "anticipate", "expect", "believe",
"may", "will", "should", "estimate", "intend" or other similar
words). Forward-looking statements in this document are intended to
provide TC Energy security holders and potential investors with
information regarding TC Energy and its subsidiaries, including
management's assessment of TC Energy's and its subsidiaries' future
plans and financial outlook. All forward-looking statements reflect
TC Energy's beliefs and assumptions based on information available
at the time the statements were made and as such are not guarantees
of future performance. As actual results could vary significantly
from the forward-looking information, you should not put undue
reliance on forward-looking information and should not use
future-oriented information or financial outlooks for anything
other than their intended purpose. We do not update our
forward-looking information due to new information or future
events, unless we are required to by law. For additional
information on the assumptions made, and the risks and
uncertainties which could cause actual results to differ from the
anticipated results, refer to the most recent Quarterly Report to
Shareholders and Annual Report filed under TC Energy’s profile on
SEDAR+ at www.sedarplus.ca and with the U.S. Securities and
Exchange Commission at www.sec.gov.
Non-GAAP Measures This release contains
references to debt-to-EBITDA which is a non-GAAP ratio which is
calculated using adjusted debt and adjusted comparable EBITDA, both
of which are non-GAAP measures. We believe debt-to-EBITDA ratios
provide investors with a useful credit measure as they reflect our
ability to service our debt and other long-term commitments. These
non-GAAP measures do not have any standardized meaning as
prescribed by GAAP and therefore may not be comparable to similar
measures presented by other entities. These non-GAAP measures are
calculated by adjusting certain GAAP measures for specific items we
believe are significant but not reflective of our underlying
operations in the period. These comparable measures are calculated
on a consistent basis from period to period and are adjusted for
specific items in each period, as applicable except as otherwise
described in the Condensed consolidated financial statements and
MD&A.
Comparable EBITDA for Portland Natural Gas Transmission System
for the years ended December 31, 2023 and 2022 was US$104 million
and US$101 million, respectively. Comparable EBITDA for our U.S.
Natural Gas Pipelines segment for the years ended December 31, 2023
and 2022 was US$3.248 billion and US$3.142 billion, respectively.
Segmented earnings for our U.S. Natural Gas Pipelines segment for
the years ended December 31, 2023 and 2022 were $3.531 billion and
$2.617 billion, respectively. For reconciliations of comparable
EBITDA to segmented earnings for our U.S. Natural Gas Pipelines
segment for the years ended December 31, 2023 and 2022, refer to
pages 21, 50 and the Non-GAAP measures section of our management’s
discussion and analysis for the year ended December 31, 2023 (the
MD&A), which sections of the MD&A are incorporated by
reference herein. The MD&A can be found on SEDAR+
(www.sedarplus.ca) under TC Energy's profile.
Adjusted debt is defined as the sum of Reported total debt,
including Notes payable, Long-Term Debt, Current portion of
long-term debt and Junior Subordinated Notes, as reported on our
Consolidated balance sheet as well as Operating lease liabilities
recognized on our Consolidated balance sheet and 50 per cent of
Preferred Shares as reported on our Consolidated balance sheet due
to the debt-like nature of their contractual and financial
obligations, less Cash and cash equivalents as reported on our
Consolidated balance sheet and 50 per cent of Junior Subordinated
Notes as reported on our Consolidated balance sheet due to the
equity-like nature of their contractual and financial
obligations.
Adjusted comparable EBITDA is calculated as comparable EBITDA
excluding Operating lease costs recorded in Plant operating costs
and other in our Consolidated statement of income and adjusted for
Distributions received in excess of income from equity investments
as reported in our Consolidated statement of cash flows which is
more reflective of the cash flows available to TC Energy to service
our debt and other long-term commitments.
See the following “Reconciliation” section for reconciliation of
adjusted debt and adjusted comparable EBITDA for the years ended
2023 and 2022.
ReconciliationThe following is a reconciliation
of adjusted debt and adjusted comparable EBITDAi.
|
|
Year endedDecember 31 |
|
(millions of Canadian $) |
2023 |
|
2022 |
|
|
Reported total debt |
63,201 |
|
58,300 |
|
|
Management adjustments: |
|
|
|
Debt treatment of preferred sharesii |
1,250 |
|
1,250 |
|
|
Equity treatment of junior subordinated notesiii |
(5,144 |
) |
(5,248 |
) |
|
Cash and cash equivalents |
(3,678 |
) |
(620 |
) |
|
Operating lease liabilities |
459 |
|
433 |
|
|
Adjusted debt |
56,088 |
|
54,115 |
|
|
|
|
|
|
Comparable EBITDAiv |
10,988 |
|
9,901 |
|
|
Operating lease cost |
118 |
|
106 |
|
|
Distributions received in excess of (income) loss from equity
investments |
(123 |
) |
(29 |
) |
|
Adjusted Comparable EBITDA |
10,983 |
|
9,978 |
|
|
|
|
|
|
Adjusted Debt-to-Adjusted Comparable
EBITDAi |
5.1 |
|
5.4 |
|
i Adjusted debt and adjusted comparable EBITDA are non-GAAP
financial measures. Management methodology. Individual rating
agency calculations will differ. ii 50 per cent debt treatment on
$2.5 billion of preferred shares as of December 31, 2023. iii 50
per cent equity treatment on $10.3 billion of junior subordinated
notes as of December 31, 2023. U.S. dollar-denominated notes
translated at December 31, 2023, U.S./Canada foreign exchange rate
of 1.32. iv Comparable EBITDA is a non-GAAP financial measure. See
the Forward-looking information and Non-GAAP measures sections for
more information.
-30-
Media Inquiries:Media
Relationsmedia@tcenergy.com 403-920-7859 or 800-608-7859
Investor & Analyst Inquiries:Gavin Wylie /
Hunter Mauinvestor_relations@tcenergy.com403-920-7911 or
800-361-6522
PDF
available: http://ml.globenewswire.com/Resource/Download/f350d8e7-7527-4888-ad54-5dd3a595bc8c
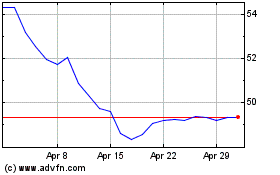
TC Energy (TSX:TRP)
Historical Stock Chart
From Nov 2024 to Dec 2024

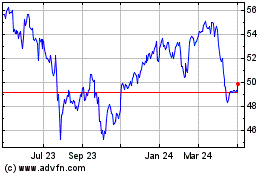
TC Energy (TSX:TRP)
Historical Stock Chart
From Dec 2023 to Dec 2024
