0000730263 False 0000730263 2025-03-05 2025-03-05 iso4217:USD xbrli:shares iso4217:USD xbrli:shares
UNITED STATES
SECURITIES AND EXCHANGE COMMISSION
Washington, D.C. 20549
_________________
FORM 8-K
_________________
CURRENT REPORT
Pursuant to Section 13 or 15(d)
of the Securities Exchange Act of 1934
Date of Report (Date of earliest event reported): March 5, 2025
_______________________________
THOR Industries, Inc.
(Exact name of registrant as specified in its charter)
_______________________________
| Delaware | 1-9235 | 93-0768752 |
| (State or Other Jurisdiction of Incorporation) | (Commission File Number) | (I.R.S. Employer Identification No.) |
52700 Independence Court
Elkhart, Indiana 46514-8155
(Address of Principal Executive Offices) (Zip Code)
(574) 970-7460
(Registrant's telephone number, including area code)
N/A
(Former name or former address, if changed since last report)
_______________________________
Check the appropriate box below if the Form 8-K filing is intended to simultaneously satisfy the filing obligation of the registrant under any of the following provisions:
| ☐ | Written communications pursuant to Rule 425 under the Securities Act (17 CFR 230.425) |
| ☐ | Soliciting material pursuant to Rule 14a-12 under the Exchange Act (17 CFR 240.14a-12) |
| ☐ | Pre-commencement communications pursuant to Rule 14d-2(b) under the Exchange Act (17 CFR 240.14d-2(b)) |
| ☐ | Pre-commencement communications pursuant to Rule 13e-4(c) under the Exchange Act (17 CFR 240.13e-4(c)) |
Securities registered pursuant to Section 12(b) of the Act:
| Title of each class | Trading Symbol(s) | Name of each exchange on which registered |
| Common Stock (Par value $.10 Per Share) | THO | New York Stock Exchange |
Indicate by check mark whether the registrant is an emerging growth company as defined in Rule 405 of the Securities Act of 1933 (§230.405 of this chapter) or Rule 12b-2 of the Securities Exchange Act of 1934 (§240.12b-2 of this chapter).
Emerging growth company ☐
If an emerging growth company, indicate by check mark if the registrant has elected not to use the extended transition period for complying with any new or revised financial accounting standards provided pursuant to Section 13(a) of the Exchange Act. ☐
Item 2.02. Results of Operations and Financial Condition.
On March 5, 2025, THOR Industries, Inc. (the “Company”) issued a press release announcing certain financial results for the second quarter ended January 31, 2025. A copy of the Company’s press release is attached hereto as Exhibit 99.1 and is incorporated by reference herein. The Company also posted an updated investor slide presentation and a list of investor questions and answers to the “Investors” section of its website. A copy of the Company’s slide presentation and investor questions and answers are attached hereto as Exhibit 99.2 and 99.3, respectively, and are incorporated by reference herein. Exhibits 99.1 and 99.2 include non-GAAP financial measures related to our operations along with a reconciliation of these GAAP to non-GAAP measures and an explanation of why these non-GAAP measures provide useful information to investors and how management uses these non-GAAP measures. These non-GAAP measures should not be considered a substitute for, or superior to, financial measures calculated in accordance with GAAP, and the financial results calculated in accordance with GAAP and reconciliations from our results should be carefully evaluated.
Item 7.01. Regulation FD Disclosure.
The press release attached hereto as Exhibit 99.1 provides earnings guidance for the Company’s fiscal year 2025 along with updated industry information. The slide presentation attached hereto as Exhibit 99.2, and incorporated by reference herein, also provides earnings guidance as well as updated information on industry wholesale shipments and retail market share. The Company also posted an updated list of investor questions and answers to the “Investors” section of its website. A copy of the Company's investor questions and answers is attached hereto as Exhibit 99.3 and is incorporated by reference herein.
In accordance with general instruction B.2 to Form 8-K, the information set forth in Items 2.02 and 7.01 of this Form 8-K (including Exhibits 99.1, 99.2 and 99.3) shall be deemed “furnished” and not “filed” with the Securities and Exchange Commission for purposes of Section 18 of the Securities Exchange Act of 1934, as amended, and shall not be incorporated by reference into any filing thereunder or under the Securities Act of 1933, as amended.
Item 9.01. Financial Statements and Exhibits.
SIGNATURE
Pursuant to the requirements of the Securities Exchange Act of 1934, the registrant has duly caused this report to be signed on its behalf by the undersigned hereunto duly authorized.
| | THOR Industries, Inc. |
| | | |
| | | |
| Date: March 5, 2025 | By: | /s/ Colleen Zuhl |
| | | Colleen Zuhl |
| | | Senior Vice President and Chief Financial Officer |
| | | |
EXHIBIT 99.1
THOR Industries Announces Second Quarter Fiscal 2025 Results
POISED FOR A MARKET RETURN
| Fiscal 2025 Second Quarter Highlights | | | | | | | | | | | |
| | | | | | | | | | | | | |
| ($ in thousands, except for per share data) | Three Months Ended January 31, | | Change | | | Six Months Ended January 31, | | Change |
| | | 2025 | | | | 2024 | | | | | | 2025 | | | | 2024 | | |
| Net Sales | $ | 2,018,107 | | | $ | 2,207,369 | | | (8.6 | )% | | | $ | 4,160,891 | | | $ | 4,708,128 | | | (11.6 | )% |
| Gross Profit | $ | 245,197 | | | $ | 270,847 | | | (9.5 | )% | | | $ | 526,639 | | | $ | 628,779 | | | (16.2 | )% |
| Gross Profit Margin % | | 12.1 | % | | | 12.3 | % | | (20) bps | | | | | 12.7 | | | | 13.4 | | | (70) bps | |
| Net Income (Loss) Attributable to THOR | $ | (551 | ) | | $ | 7,217 | | | (107.6 | )% | | | $ | (2,383 | ) | | $ | 60,782 | | | (103.9 | )% |
| Diluted Earnings (Loss) Per Share | $ | (0.01 | ) | | $ | 0.13 | | | (107.7 | )% | | | $ | (0.04 | ) | | $ | 1.13 | | | (103.5 | )% |
| Cash Flows from Operations | $ | 30,842 | | | $ | (103,868 | ) | | 129.7 | % | | | $ | 61,582 | | | $ | (44,200 | ) | | 239.3 | % |
| | | | | | | | | | | | | |
| EBITDA(1) | $ | 76,344 | | | $ | 103,242 | | | | | | $ | 158,077 | | | $ | 263,299 | | | |
| Adjusted EBITDA(1) | $ | 87,015 | | | $ | 108,686 | | | | | | $ | 194,797 | | | $ | 275,604 | | | |
(1) See reconciliation of non-GAAP measures to most directly comparable GAAP financial measures included in this release
Key Takeaways from Fiscal 2025 Second Quarter
- Second quarter performance was aligned with expectations due to continued macroeconomic headwinds
- Margins remained resilient while contending with market challenges
- Robust cash generation as a result of management’s execution of our proven operating model
- Continued strategic actions to deepen dealer relationships and create competitive advantage so as to maximize performance upon the eventual return of a stronger market
- The Company narrowed and revised its full-year fiscal 2025 financial guidance
- Consolidated net sales in the range of $9.0 billion to $9.5 billion
- Consolidated gross profit margin in the range of 13.8% to 14.5%
- Diluted earnings per share in the range of $3.30 to $4.00
ELKHART, Ind., March 05, 2025 (GLOBE NEWSWIRE) -- THOR Industries, Inc. (NYSE: THO) today announced financial results for its fiscal 2025 second quarter, ended January 31, 2025.
“Our second quarter results were in line with our expectations going into the quarter, and we experienced mild, but encouraging, year-over-year improvement at recent retail shows. As the challenging economic environment persists, our actions remain focused on what we can control: the products that we offer and the relationships that we foster with dealers and retail customers. Our strategic approach continues to emphasize a strong margin profile while focusing on alignment of our production to match the current retail environment. This approach will help us avoid growth of independent dealer inventory levels of our products until market conditions improve. Holding true to our strategy places our operating companies in an advantageous position to outperform the market when retail demand inevitably picks up. Despite the challenging market, we have generated strong cash flows through the execution of our proven operating model, favorably positioning THOR to seize upon growth opportunities in both North America and Europe,” explained Bob Martin, President and Chief Executive Officer of THOR Industries.
Second Quarter Financial Results
Consolidated net sales were $2.02 billion in the second quarter of fiscal 2025, compared to $2.21 billion for the second quarter of fiscal 2024, a decrease of 8.6%.
Consolidated gross profit margin for the second quarter of fiscal 2025 was 12.1%, a decrease of 20 basis points when compared to the second quarter of fiscal 2024.
Net income (loss) attributable to THOR Industries, Inc. and diluted earnings (loss) per share for the second quarter of fiscal 2025 were $(0.6) million and $(0.01), respectively, compared to $7.2 million and $0.13, respectively, for the second quarter of fiscal 2024.
EBITDA and Adjusted EBITDA for the second quarter of fiscal 2025 were $76,344 and $87,015, respectively, compared to $103,242 and $108,686, respectively, for the second quarter of fiscal 2024. See the reconciliation of non-GAAP measures to the most directly comparable GAAP financial measures included at the end of this release.
THOR’s consolidated results were primarily driven by the results of its individual reportable segments as noted below.
Segment Results
North American Towable RVs
| ($ in thousands) | Three Months Ended January 31, | | Change
| | | Six Months Ended January 31, | | Change
|
| | | 2025 | | | | 2024 | | | | | | 2025 | | | | 2024 | | |
| Net Sales | $ | 828,266 | | | $ | 730,968 | | | 13.3 | % | | | $ | 1,727,044 | | | $ | 1,676,422 | | | 3.0 | % |
| Unit Shipments | | 28,013 | | | | 21,958 | | | 27.6 | % | | | | 58,031 | | | | 50,065 | | | 15.9 | % |
| Gross Profit | $ | 91,646 | | | $ | 53,897 | | | 70.0 | % | | | $ | 204,083 | | | $ | 171,908 | | | 18.7 | % |
| Gross Profit Margin % | | 11.1 | | | | 7.4 | | | +370 bps | | | | | 11.8 | | | | 10.3 | | | +150 bps | |
| Income Before Income Taxes | $ | 28,152 | | | $ | 661 | | | n/m | | | | $ | 74,973 | | | $ | 49,910 | | | 50.2 | % |
n/m – represents percentage calculated not being meaningful
| | As of January 31, | | Change
|
| ($ in thousands) | | 2025 | | | | 2024 | | |
| Order Backlog | $ | 1,073,758 | | | $ | 836,202 | | | 28.4 | % |
| | | | | | | | | | | |
- North American Towable RV net sales for the second quarter of fiscal 2025 increased 13.3% compared to the prior-year period. This increase in net sales was the result of a 27.6% increase in unit shipments, partially offset by a 14.3% decrease in the overall net price per unit, as our product mix in the current-year period shifted more toward our lower-cost travel trailers.
- North American Towable RV gross profit margin was 11.1% for the second quarter of fiscal 2025 compared to 7.4% for the prior-year period. This 370 basis point improvement was due to the increase in net sales and the combined net favorable impacts of reduced sales discounting and our ongoing cost-saving initiatives.
- North American Towable RV income before income taxes for the second quarter of fiscal 2025 increased to $28.2 million from $0.7 million in the second quarter of fiscal 2024. The increase in income before income taxes was primarily the result of the increase in net sales.
North American Motorized RVs
| ($ in thousands) | Three Months Ended January 31, | | Change
| | | Six Months Ended January 31, | | Change
|
| | | 2025 | | | | 2024 | | | | | | 2025 | | | | 2024 | | |
| Net Sales | $ | 446,298 | | | $ | 570,424 | | | (21.8 | )% | | | $ | 951,506 | | | $ | 1,281,583 | | | (25.8 | )% |
| Unit Shipments | | 3,526 | | | | 4,438 | | | (20.5 | )% | | | | 7,267 | | | | 10,020 | | | (27.5 | )% |
| Gross Profit | $ | 34,741 | | | $ | 60,721 | | | (42.8 | )% | | | $ | 77,468 | | | $ | 140,113 | | | (44.7 | )% |
| Gross Profit Margin % | | 7.8 | | | | 10.6 | | | (280) bps | | | | | 8.1 | | | | 10.9 | | | (280) bps | |
| Income Before Income Taxes | $ | 4,298 | | | $ | 26,460 | | | (83.8 | )% | | | $ | 13,379 | | | $ | 63,512 | | | (78.9 | )% |
| | As of January 31, | | Change
|
| ($ in thousands) | | 2025 | | | | 2024 | | |
| Order Backlog | $ | 1,124,735 | | | $ | 1,072,687 | | | 4.9 | % |
| | | | | | | | | | | |
- North American Motorized RV net sales decreased 21.8% for the second quarter of fiscal 2025 compared to the prior-year period. The decrease resulted from a 20.5% reduction in unit shipments, primarily due to a softening in dealer and consumer demand in the current-year period, along with a 1.3% decrease in net price per unit primarily due to our Class A product mix shifting toward a higher concentration of our more moderately-priced Class A units, along with higher discounting levels in comparison to the prior-year period.
- North American Motorized RV gross profit margin was 7.8% for the second quarter of fiscal 2025 compared to 10.6% in the second quarter of fiscal 2024. The decrease in the gross profit margin percentage for the current period was driven mainly by the combined impact of the decrease in net sales along with the increase in sales discounting.
- North American Motorized RV income before income taxes for the second quarter of fiscal 2025 decreased to $4.3 million compared to $26.5 million in the prior-year period, primarily due to the decrease in net sales.
European RVs
| ($ in thousands) | Three Months Ended January 31, | | Change
| | | Six Months Ended January 31, | | Change
|
| | | 2025 | | | | 2024 | | | | | | 2025 | | | | 2024 | | |
| Net Sales | $ | 612,465 | | | $ | 782,294 | | | (21.7 | )% | | | $ | 1,217,368 | | | $ | 1,490,495 | | | (18.3 | )% |
| Unit Shipments | | 9,442 | | | | 13,080 | | | (27.8 | )% | | | | 18,077 | | | | 24,972 | | | (27.6 | )% |
| Gross Profit | $ | 80,929 | | | $ | 119,325 | | | (32.2 | )% | | | $ | 173,577 | | | $ | 242,153 | | | (28.3 | )% |
| Gross Profit Margin % | | 13.2 | | | | 15.3 | | | (210) bps | | | | | 14.3 | | | | 16.2 | | | (190) bps | |
| Income Before Income Taxes | $ | 2,210 | | | $ | 38,057 | | | (94.2 | )% | | | $ | 3,387 | | | $ | 66,824 | | | (94.9 | )% |
| | As of January 31, | | Change
|
| ($ in thousands) | | 2025 | | | | 2024 | | |
| Order Backlog | $ | 1,644,015 | | | $ | 2,746,307 | | | (40.1 | )% |
| | | | | | | | | | | |
- European RV net sales decreased 21.7% for the second quarter of fiscal 2025 compared to the prior-year period driven by a 27.8% decrease in unit shipments offset in part by a 6.1% increase in the overall net price per unit. The increase in overall net price per unit includes an 8.9% increase from the combined impact of changes in product mix and price partially offset by a 2.8% decrease due to the impact of changes in the foreign currency exchange rate.
- European RV gross profit margin decreased to 13.2% of net sales for the second quarter of fiscal 2025 from 15.3% in the prior-year period, primarily due to an increased manufacturing overhead cost percentage stemming from the net sales decrease.
- European RV income before income taxes for the second quarter of fiscal 2025 was $2.2 million compared to $38.1 million during the second quarter of fiscal 2024. The decrease in income before income taxes was primarily attributable to the decrease in net sales compared to the prior-year period.
Management Commentary
“At the beginning of fiscal 2025, we foresaw that the first half of our fiscal year would be challenging and that certainly has proven to be accurate. Our focus on maintaining a healthy balance between wholesale and retail activity enabled our segments to hold margins reasonably well with consolidated gross margins for the second quarter of fiscal 2025 at 12.1% compared to 12.3% for the prior-year period. As we anticipated and messaged at the beginning of our fiscal year, our North American Motorized and European segments have both seen a year-over-year decline in gross margins while our North American Towable segment has seen meaningful improvement on a year-over-year basis, with gross margins up 370 basis points over the same quarter last year. Our consolidated margin this quarter was also impacted by actions we took to deepen our partnerships with key dealers. Strategically, deepening these key relationships is important to our long-term market position. These strategic decisions position THOR well as we look ahead. The takeaway for this quarter and for the first half of our fiscal year is that we performed as we expected,” said Todd Woelfer, Senior Vice President and Chief Operating Officer.
“While the RV market has experienced an extended downturn, our focus has remained on prudently managing through the downturn by working with our vendor and dealer partners to improve what we build for retail customers. We proactively aligned production with retail demand to ensure a balanced inventory position and optimal channel pull-through in a highly dynamic market. At the same time, we continue to refine our brand portfolio to reflect evolving consumer trends and market dynamics. We have seen great success with some of our operating companies and challenges with others. As our fiscal year continues to unfold, we anticipate meaningful structural and brand rationalization announcements that will result in an improved profit profile for our operating segments. The net result will be a better, more profitable THOR aligned with the current and future needs of our dealers and retail consumers,” added Woelfer.
“Despite the challenging market and macroeconomic uncertainties, we remain focused on enhancing the fundamentals of our business and executing on our strategic plan as we progress through the second half of our fiscal year,” said Colleen Zuhl, Senior Vice President and Chief Financial Officer.
“On January 31, 2025, we had liquidity of approximately $1.23 billion, including approximately $373.8 million in cash on hand and approximately $855.0 million available under our asset-based revolving credit facility. In addition to the firm foundation provided by our total liquidity position and overall strong balance sheet, during the second quarter, we generated cash from operations of approximately $30.8 million, bringing our fiscal year-to-date total to $61.6 million. In the face of the difficulties of the first half of our fiscal year, we improved our cash flow from operating activities by over $100 million compared to the first half of last year by executing on our proven operating model as we significantly reduced our working capital through prudent management of inventories and other actions.
“True to our historical commitment of taking a measured and conservative approach to cash management and capital allocation during challenging economic periods, during the first half of fiscal 2025, we have made capital expenditures of approximately $51.5 million with a priority on time-sensitive investments into our facilities and machinery. We have also reduced our total indebtedness by approximately $90.5 million and returned capital to our shareholders primarily through the payment of $53.2 million in quarterly dividends.
“Based on the historical seasonality of our industry and our previously stated outlook on our full year fiscal 2025, we expect stronger generation of cash from operations during the second half of our fiscal year, further bolstering our ability to execute our strategic plan and enhance shareholder value,” added Zuhl.
Outlook
“Despite the RVIA recently revising its forecast upwards for calendar year 2025, now with total expected wholesale unit shipments exceeding 350,000 units, we remain more cautious in our preparation for the remainder of the calendar year. While we are resolute in our belief in the strength of the foundation and future of our industry, we are aware that the recent decline in consumer confidence and the impacts of a broad tariff policy create uncertainty in the market in the near term. We remain confident in our ability to navigate this uncertain market environment while continuing to position THOR for future success. By maintaining financial discipline and focusing on strategic growth initiatives, we are well-equipped to emerge stronger and more resilient,” concluded Martin.
Fiscal 2025 Guidance
“THOR’s consolidated net sales levels through the first half of our fiscal year have been very much in line with our initial expectations and financial guidance. Pressure on margins, however, has been higher than we anticipated primarily due to challenging North American Motorized and European market conditions and additional strategic actions that THOR has implemented with our dealer partners, resulting in softer margins than our original forecast. We still expect that the retail market will begin trending more positively as we progress through the remainder of our fiscal 2025, which will pave the way for a stronger year in our fiscal 2026 which begins in August. Taking into consideration results to date and our expectations for our North American and European operations for the upcoming fiscal quarters, the Company has narrowed and revised its financial guidance for fiscal 2025,” commented Woelfer.
For fiscal 2025, the Company’s updated full-year financial guidance now includes:
- Consolidated net sales in the range of $9.0 billion to $9.5 billion (narrowing the previous range of $9.0 billion to $9.8 billion)
- Consolidated gross profit margin in the range of 13.8% to 14.5% (previously in the range of 14.7% to 15.2%)
- Diluted earnings per share in the range of $3.30 to $4.00 (previously in the range of $4.00 to $5.00)
Supplemental Earnings Release Materials
THOR Industries has provided a comprehensive question and answer document, as well as a PowerPoint presentation, relating to its quarterly results and other topics.
To view these materials, go to http://ir.thorindustries.com.
About THOR Industries, Inc.
THOR Industries is the sole owner of operating subsidiaries which, combined, represent the world’s largest manufacturer of recreational vehicles.
For more information on the Company and its products, please go to www.thorindustries.com.
Forward-Looking Statements
This release includes certain statements that are “forward-looking” statements within the meaning of the U.S. Private Securities Litigation Reform Act of 1995, Section 27A of the Securities Act of 1933, as amended, and Section 21E of the Securities Exchange Act of 1934, as amended. These forward-looking statements are made based on management’s current expectations and beliefs regarding future and anticipated developments and their effects upon THOR, and inherently involve uncertainties and risks. These forward-looking statements are not a guarantee of future performance. We cannot assure you that actual results will not differ materially from our expectations. Factors which could cause materially different results include, among others: the impact of inflation on the cost of our products as well as on general consumer demand; the effect of raw material and commodity price fluctuations, including the impact of tariffs, and/or raw material, commodity or chassis supply constraints; the impact of war, military conflict, terrorism and/or cyber-attacks, including state-sponsored or ransom attacks; the impact of sudden or significant adverse changes in the cost and/or availability of energy or fuel, including those caused by geopolitical events, on our costs of operation, on raw material prices, on our suppliers, on our independent dealers or on retail customers; the dependence on a small group of suppliers for certain components used in production, including chassis; interest rates and interest rate fluctuations and their potential impact on the general economy and, specifically, on our independent dealers and consumers and our profitability; the ability to ramp production up or down quickly in response to rapid changes in demand while also managing costs and market share; the level and magnitude of warranty and recall claims incurred; the ability of our suppliers to financially support any defects in their products; the financial health of our independent dealers and their ability to successfully manage through various economic conditions; legislative, regulatory and tax law and/or policy developments including their potential impact on our independent dealers, retail customers or on our suppliers; the costs of compliance with governmental regulation; the impact of an adverse outcome or conclusion related to current or future litigation or regulatory investigations; public perception of and the costs related to environmental, social and governance matters; legal and compliance issues including those that may arise in conjunction with recently completed transactions; lower consumer confidence and the level of discretionary consumer spending; the impact of exchange rate fluctuations; restrictive lending practices which could negatively impact our independent dealers and/or retail consumers; management changes; the success of new and existing products and services; the ability to maintain strong brands and develop innovative products that meet consumer demands; the ability to efficiently utilize existing production facilities; changes in consumer preferences; the risks associated with acquisitions, including: the pace and successful closing of an acquisition, the integration and financial impact thereof, the level of achievement of anticipated operating synergies from acquisitions, the potential for unknown or understated liabilities related to acquisitions, the potential loss of existing customers of acquisitions and our ability to retain key management personnel of acquired companies; a shortage of necessary personnel for production and increasing labor costs and related employee benefits to attract and retain production personnel in times of high demand; the loss or reduction of sales to key independent dealers, and stocking level decisions of our independent dealers; disruption of the delivery of units to independent dealers or the disruption of delivery of raw materials, including chassis, to our facilities; increasing costs for freight and transportation; the ability to protect our information technology systems from data breaches, cyber-attacks and/or network disruptions; asset impairment charges; competition; the impact of losses under repurchase agreements; the impact of the strength of the U.S. dollar on international demand for products priced in U.S. dollars; general economic, market, public health and political conditions in the various countries in which our products are produced and/or sold; the impact of changing emissions and other related climate change regulations in the various jurisdictions in which our products are produced, used and/or sold; changes to our investment and capital allocation strategies or other facets of our strategic plan; and changes in market liquidity conditions, credit ratings and other factors that may impact our access to future funding and the cost of debt.
These and other risks and uncertainties are discussed more fully in our Quarterly Report on Form 10-Q for the quarter ended January 31, 2025 and in Item 1A of our Annual Report on Form 10-K for the year ended July 31, 2024.
We disclaim any obligation or undertaking to disseminate any updates or revisions to any forward-looking statements contained in this release or to reflect any change in our expectations after the date hereof or any change in events, conditions or circumstances on which any statement is based, except as required by law.
| THOR INDUSTRIES, INC. AND SUBSIDIARIES |
| CONDENSED CONSOLIDATED STATEMENTS OF INCOME |
| FOR THE THREE AND SIX MONTHS ENDED JANUARY 31, 2025 AND 2024 |
| ($000’s except share and per share data) (Unaudited) |
| | | | | | | | | | | | | |
| | | Three Months Ended January 31, | | Six Months Ended January 31, |
| | | | 2025 | | % Net Sales (1) | | | 2024 | | % Net Sales (1) | | | 2025 | | % Net Sales (1) | | | 2024 | | % Net Sales (1) |
| Net sales | | $ | 2,018,107 | | | | $ | 2,207,369 | | | | $ | 4,160,891 | | | | $ | 4,708,128 | | |
| | | | | | | | | | | | | |
| Gross profit | | $ | 245,197 | | 12.1 | % | | $ | 270,847 | | 12.3 | % | | $ | 526,639 | | 12.7 | % | | $ | 628,779 | | 13.4 | % |
| | | | | | | | | | | | | |
| Selling, general and administrative expenses | | | 206,222 | | 10.2 | % | | | 220,125 | | 10.0 | % | | | 446,419 | | 10.7 | % | | | 438,021 | | 9.3 | % |
| | | | | | | | | | | | | |
| Amortization of intangible assets | | | 29,244 | | 1.4 | % | | | 32,464 | | 1.5 | % | | | 59,066 | | 1.4 | % | | | 64,808 | | 1.4 | % |
| | | | | | | | | | | | | |
| Interest expense, net | | | 11,950 | | 0.6 | % | | | 28,229 | | 1.3 | % | | | 27,178 | | 0.7 | % | | | 48,426 | | 1.0 | % |
| | | | | | | | | | | | | |
| Other income, net | | | 619 | | — | % | | | 16,865 | | 0.8 | % | | | 3,268 | | 0.1 | % | | | 1,952 | | — | % |
| | | | | | | | | | | | | |
| Income (loss) before income taxes | | | (1,600 | ) | (0.1 | )% | | | 6,894 | | 0.3 | % | | | (2,756 | ) | (0.1 | )% | | | 79,476 | | 1.7 | % |
| | | | | | | | | | | | | |
| Income tax provision | | | 1,489 | | 0.1 | % | | | 1,568 | | 0.1 | % | | | 1,206 | | — | % | | | 19,117 | | 0.4 | % |
| | | | | | | | | | | | | |
| Net income (loss) | | | (3,089 | ) | (0.2 | )% | | | 5,326 | | 0.2 | % | | | (3,962 | ) | (0.1 | )% | | | 60,359 | | 1.3 | % |
| | | | | | | | | | | | | |
| Less: Net (loss) attributable to non-controlling interests | | | (2,538 | ) | (0.1 | )% | | | (1,891 | ) | (0.1 | )% | | | (1,579 | ) | — | % | | | (423 | ) | — | % |
| | | | | | | | | | | | | |
| Net income (loss) attributable to THOR Industries, Inc. | | $ | (551 | ) | — | % | | $ | 7,217 | | 0.3 | % | | $ | (2,383 | ) | (0.1 | )% | | $ | 60,782 | | 1.3 | % |
| | | | | | | | | | | | | |
| Earnings (loss) per common share: | | | | | | | | | | | | |
| Basic | | $ | (0.01 | ) | | | $ | 0.14 | | | | $ | (0.04 | ) | | | $ | 1.14 | | |
| Diluted | | $ | (0.01 | ) | | | $ | 0.13 | | | | $ | (0.04 | ) | | | $ | 1.13 | | |
| | | | | | | | | | | | | |
| Weighted-average common shares outstanding: | | | | | | | | | | | | |
| Basic | | | 53,208,626 | | | | | 53,322,504 | | | | | 53,091,615 | | | | | 53,309,169 | | |
| Diluted | | | 53,208,626 | (2) | | | | | 53,650,583 | | | | | 53,091,615 | (2) | | | | | 53,752,150 | | |
| | | | | | | | | | | | | |
| (1) Percentages may not add due to rounding differences |
| (2) Due to losses for the three and six months ended January 31, 2025, zero incremental shares are included because the effect would be antidilutive |
| |
| SUMMARY CONDENSED CONSOLIDATED BALANCE SHEETS ($000’s) (Unaudited) |
| | | | | | | | | | | |
| | | January 31,
2025 | | July 31,
2024 | | | | January 31,
2025 | | July 31,
2024 |
| Cash and equivalents | | $ | 373,819 | | | $ | 501,316 | | | Current liabilities | | $ | 1,474,392 | | | $ | 1,567,022 | |
| Accounts receivable, net | | | 653,298 | | | | 700,895 | | | Long-term debt, net | | | 1,003,395 | | | | 1,101,265 | |
| Inventories, net | | | 1,379,419 | | | | 1,366,638 | | | Other long-term liabilities | | | 282,849 | | | | 278,483 | |
| Prepaid income taxes, expenses and other | | | 117,933 | | | | 81,178 | | | Stockholders’ equity | | | 3,953,495 | | | | 4,074,053 | |
| Total current assets | | | 2,524,469 | | | | 2,650,027 | | | | | | | |
| Property, plant & equipment, net | | | 1,319,821 | | | | 1,390,718 | | | | | | | |
| Goodwill | | | 1,748,861 | | | | 1,786,973 | | | | | | | |
| Amortizable intangible assets, net | | | 789,582 | | | | 861,133 | | | | | | | |
| Equity investments and other, net | | | 331,398 | | | | 331,972 | | | | | | | |
| Total | | $ | 6,714,131 | | | $ | 7,020,823 | | | | | $ | 6,714,131 | | | $ | 7,020,823 | |
| | | | | | | | | | | | | | | | | | | |
Non-GAAP Reconciliation
The following table reconciles net income (loss) to consolidated EBITDA and Adjusted EBITDA:
| EBITDA Reconciliation | | | | | | |
| ($ in thousands) | | | | | | |
| | | | | | | | |
| | Three Months Ended
January 31, | | Six Months Ended
January 31, |
| | | 2025 | | | | 2024 | | | | 2025 | | | | 2024 | |
| Net income (loss) | $ | (3,089 | ) | | $ | 5,326 | | | $ | (3,962 | ) | | $ | 60,359 | |
| Add back: | | | | | | | |
| Interest expense, net | | 11,950 | | | | 28,229 | | | | 27,178 | | | | 48,426 | |
| Income tax provision | | 1,489 | | | | 1,568 | | | | 1,206 | | | | 19,117 | |
| Depreciation and amortization of intangible assets | | 65,994 | | | | 68,119 | | | | 133,655 | | | | 135,397 | |
| EBITDA | $ | 76,344 | | | $ | 103,242 | | | $ | 158,077 | | | $ | 263,299 | |
| Add back: | | | | | | | |
| Stock-based compensation expense | | 8,073 | | | | 9,246 | | | | 18,610 | | | | 19,698 | |
| Change in LIFO reserve, net | | (1,500 | ) | | | (3,000 | ) | | | (1,500 | ) | | | (3,000 | ) |
| Net expense (income) related to certain contingent liabilities | | — | | | | (4,200 | ) | | | — | | | | (14,200 | ) |
| Non-cash foreign currency loss (gain) | | 1,254 | | | | 1,724 | | | | 4,646 | | | | 745 | |
| Market value loss (gain) on equity investments | | 384 | | | | 530 | | | | 772 | | | | 3,401 | |
| Equity method investment loss (gain) | | 2,251 | | | | 3,502 | | | | 4,505 | | | | 9,437 | |
| Debt amendment expenses | | — | | | | 7,175 | | | | — | | | | 7,175 | |
| Employee & facility strategic initiatives | | — | | | | — | | | | 15,459 | | | | — | |
| Other loss (gain), including sales of PP&E | | 209 | | | | (9,533 | ) | | | (5,772 | ) | | | (10,951 | ) |
| Adjusted EBITDA | $ | 87,015 | | | $ | 108,686 | | | $ | 194,797 | | | $ | 275,604 | |
| | | | | | | | | | | | | | | | |
Adjusted EBITDA is a non-GAAP performance measure included to illustrate and improve comparability of the Company's results from period to period, particularly in periods with unusual or one-time items. Adjusted EBITDA is defined as net income (loss) before net interest expense, income tax expense (benefit) and depreciation and amortization adjusted for certain unusual items and other one-time items. The Company considers this non-GAAP measure in evaluating and managing the Company's operations and believes that discussion of results adjusted for these items is meaningful to investors because it provides a useful analysis of ongoing underlying operating trends. The adjusted measures are not in accordance with, nor are they a substitute for, GAAP measures, and they may not be comparable to similarly titled measures used by other companies.
Contact:
Jeff Tryka, CFA
Lambert Global
616-295-2509
jtryka@lambert.com
EXHIBIT 99.2

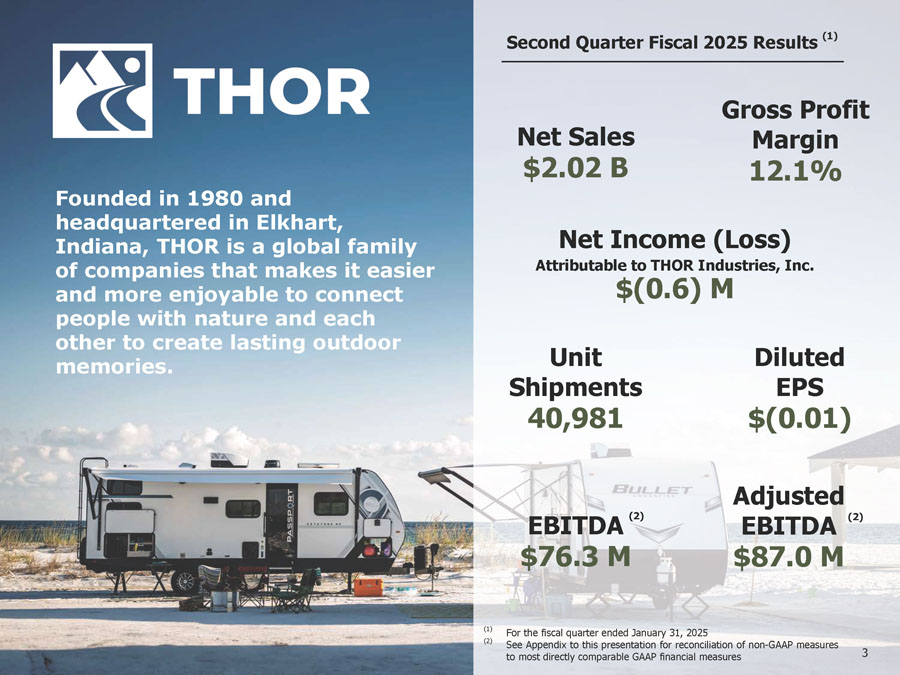
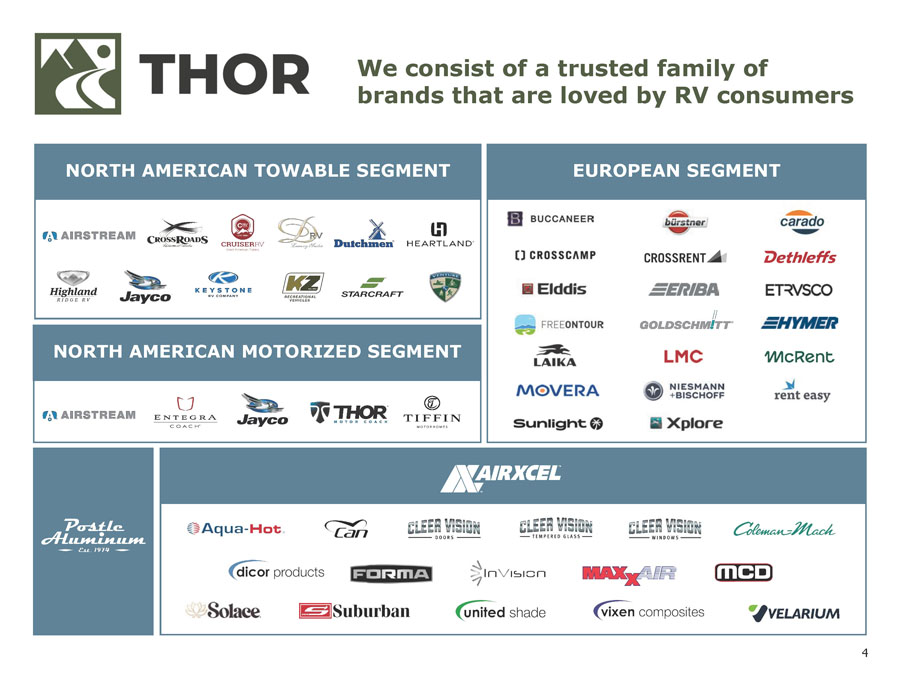
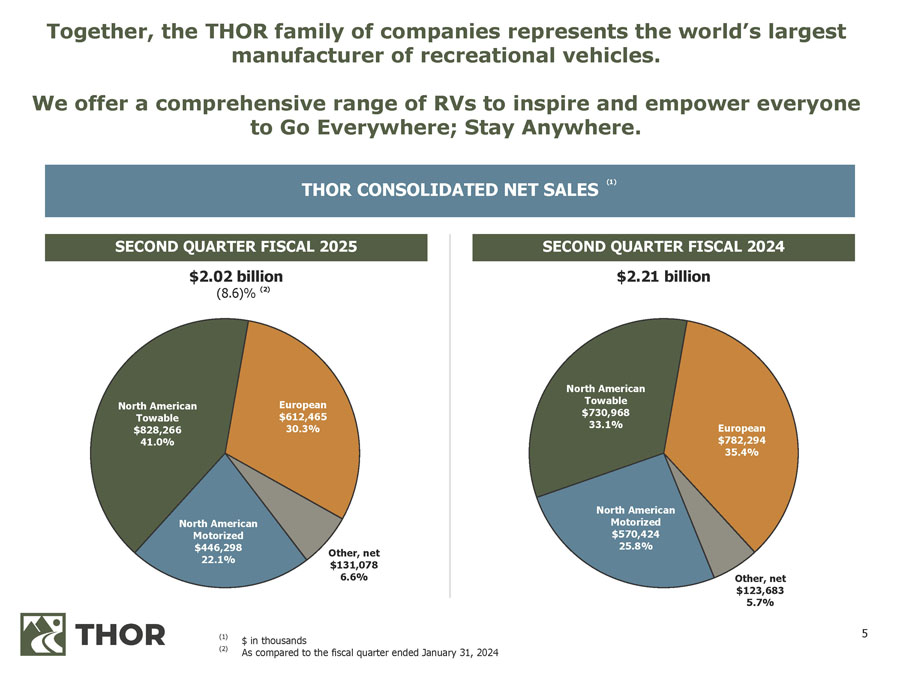
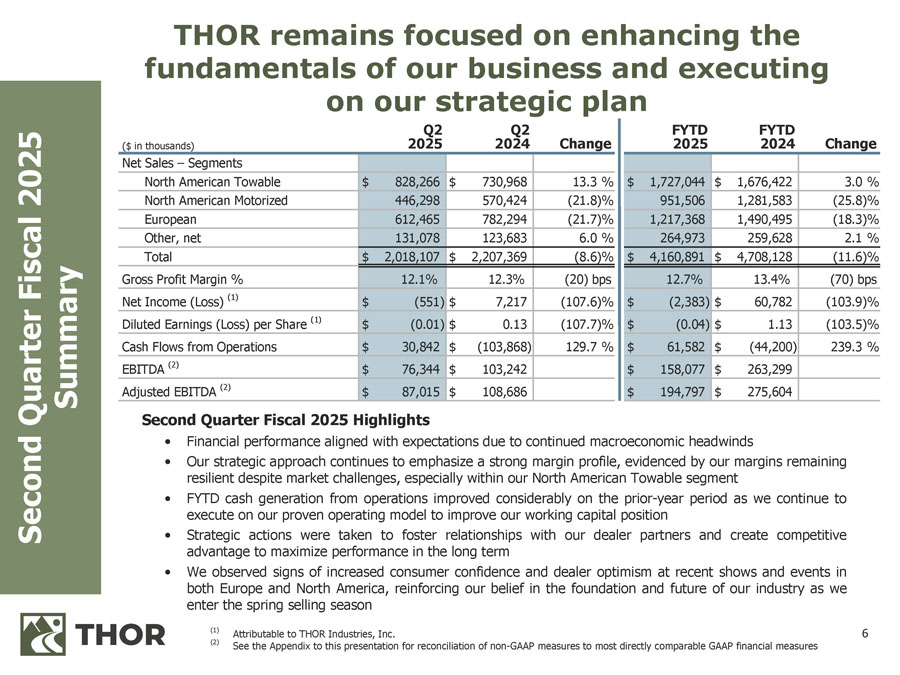
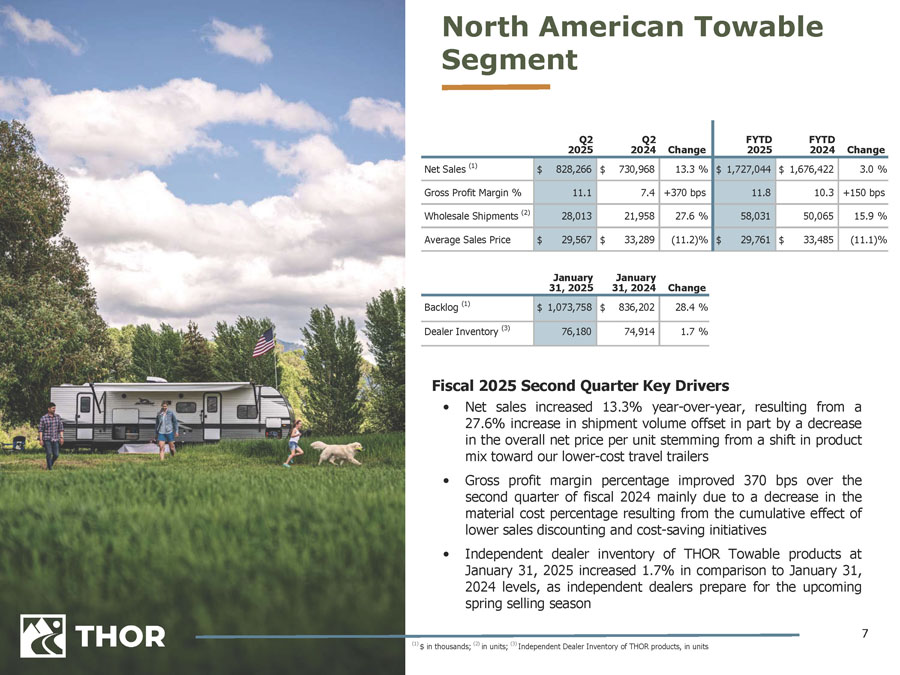
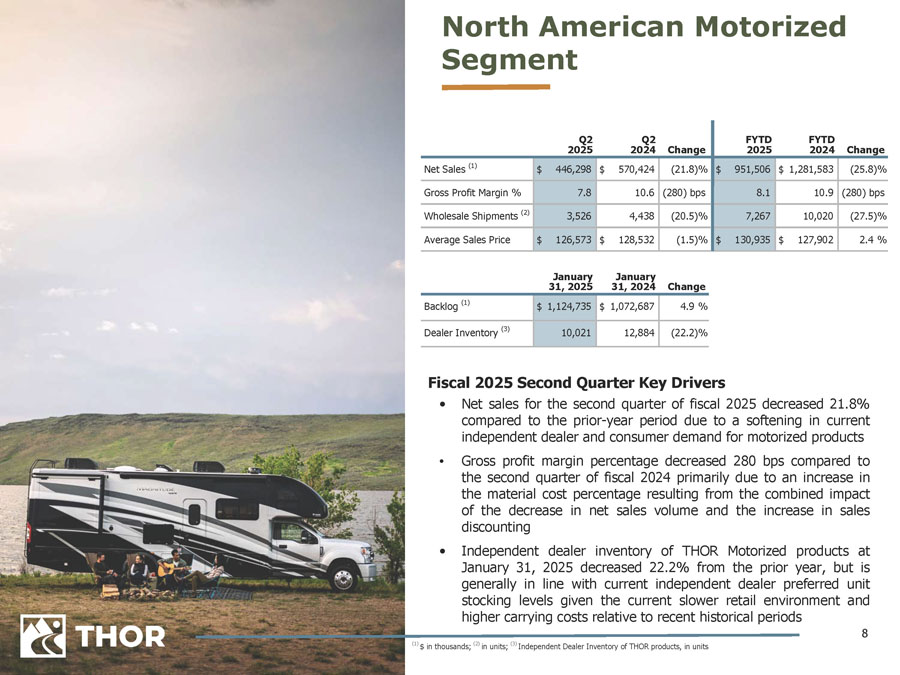
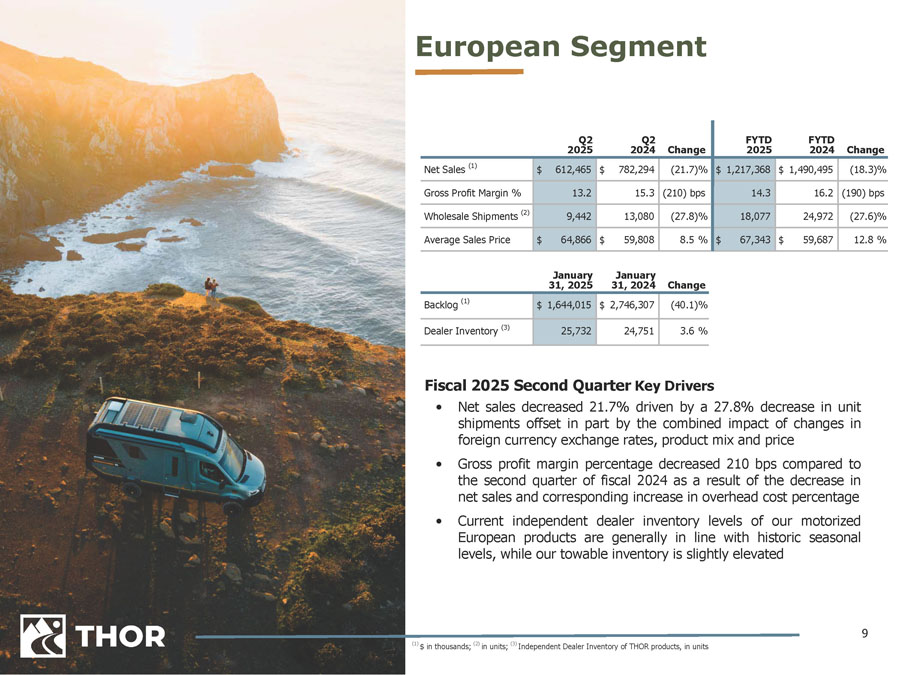
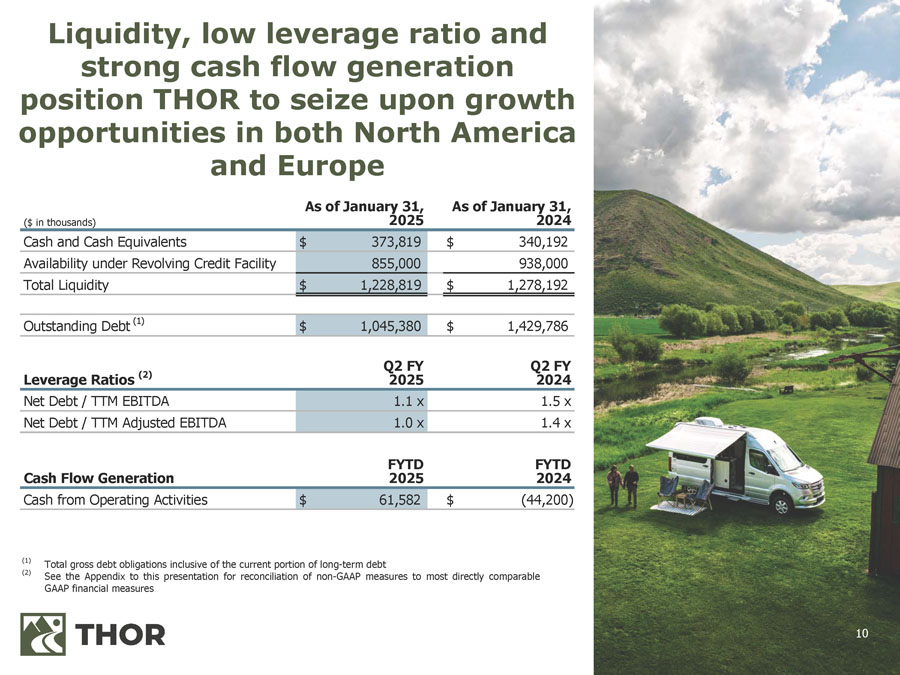
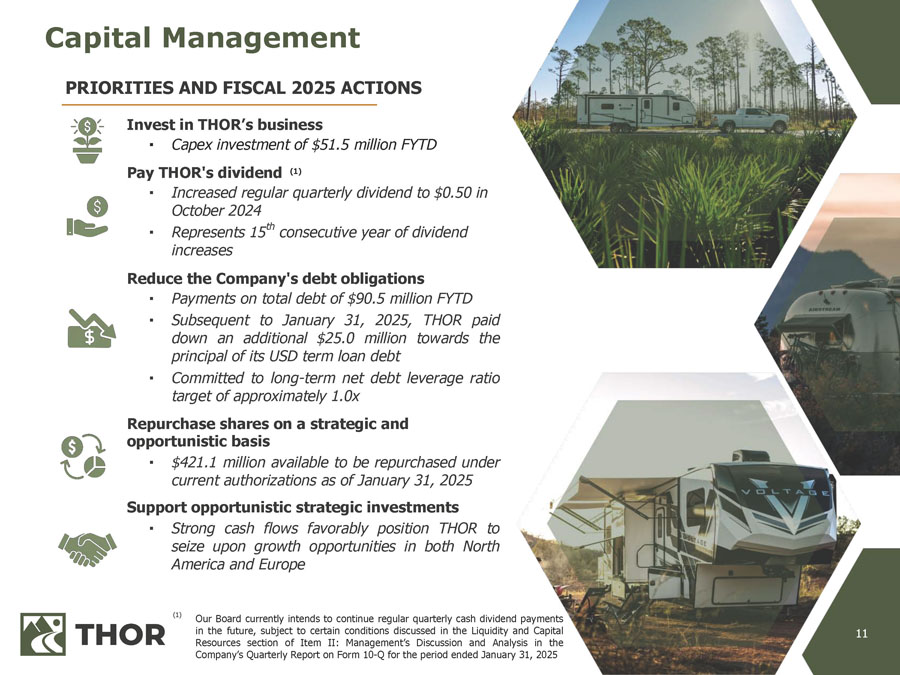
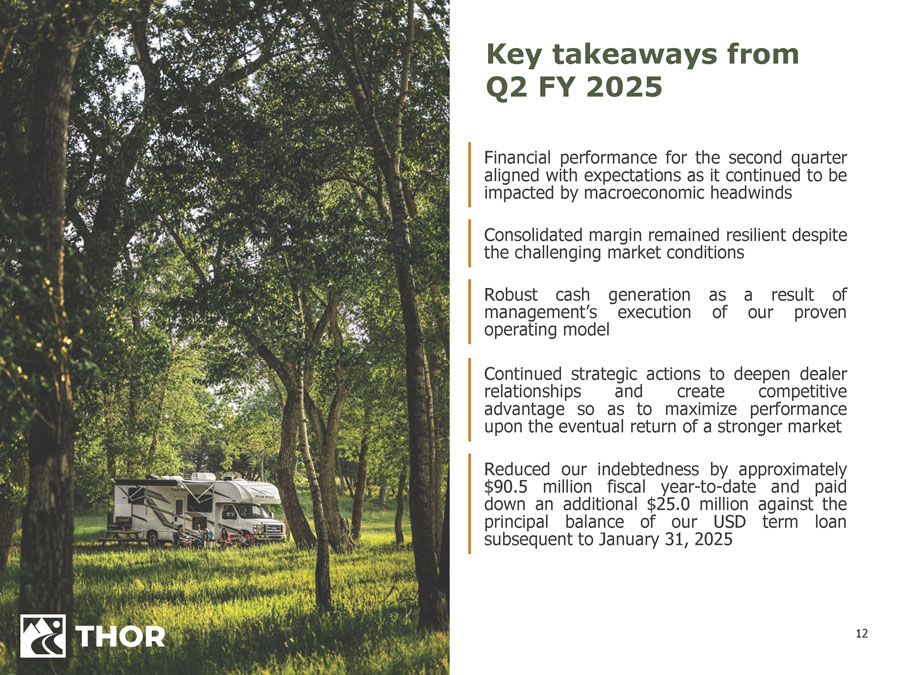
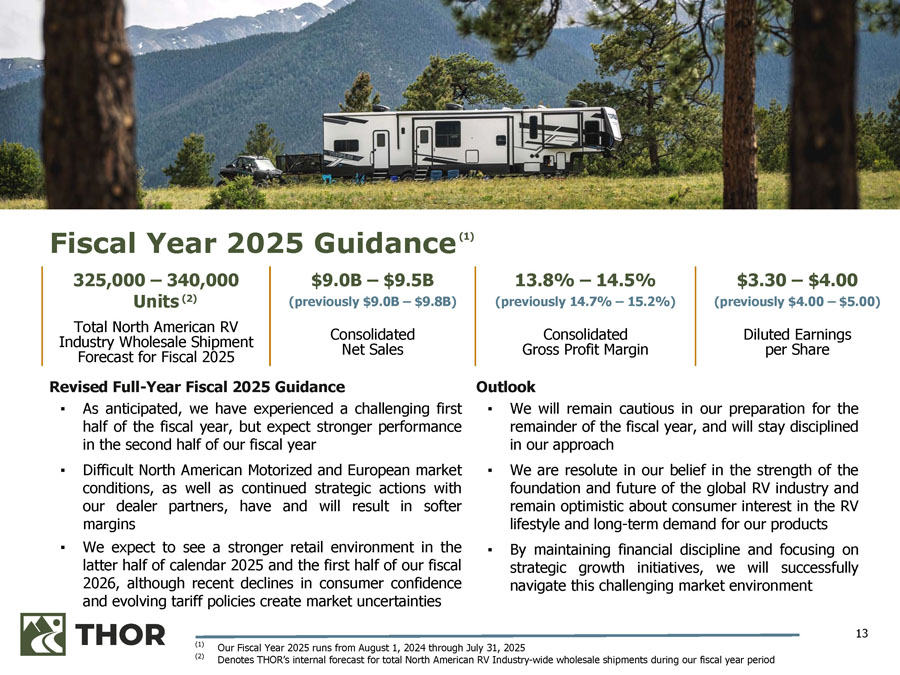

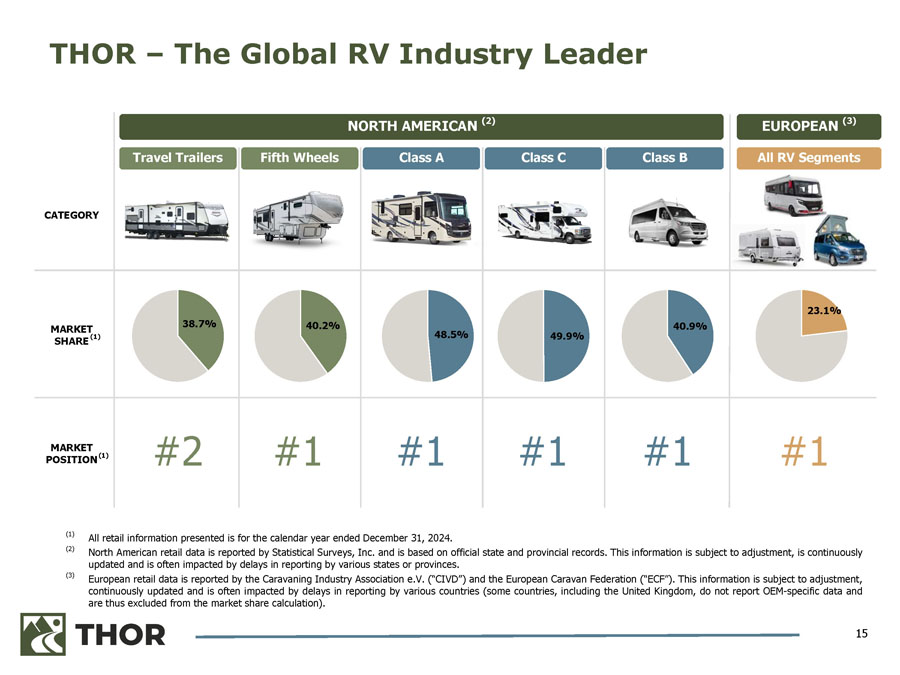
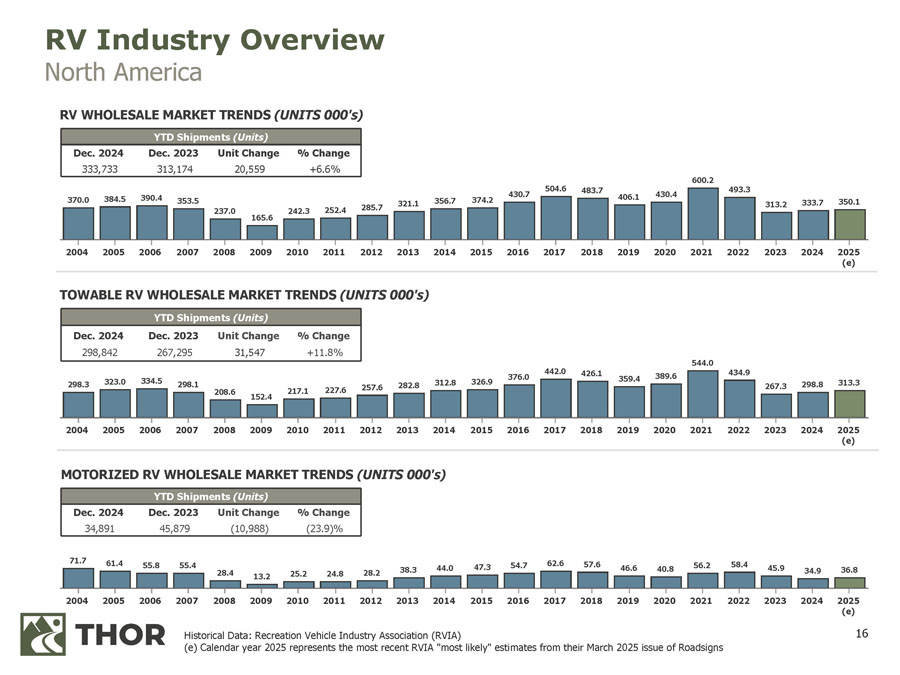
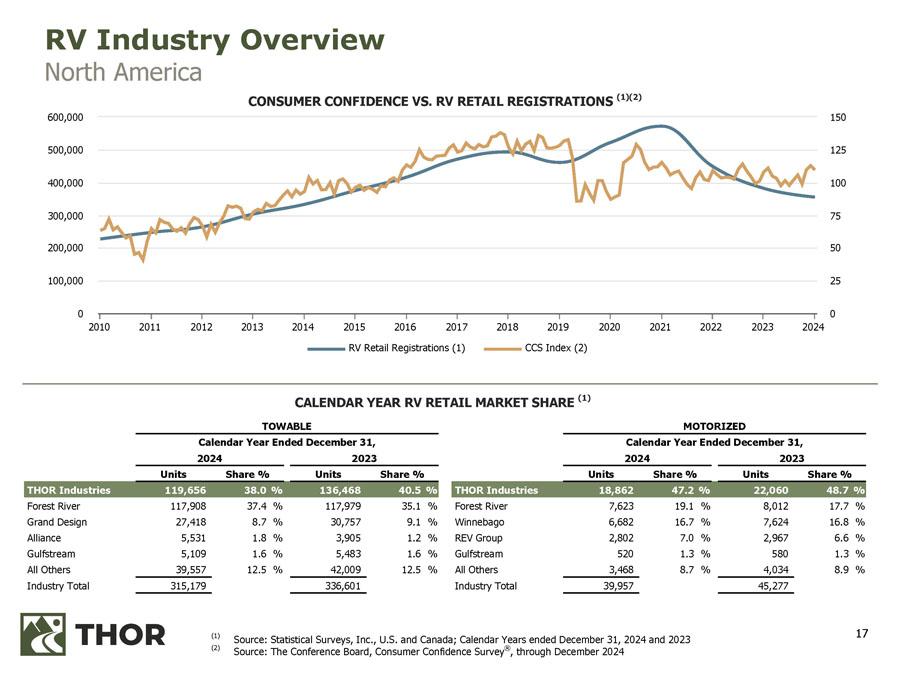
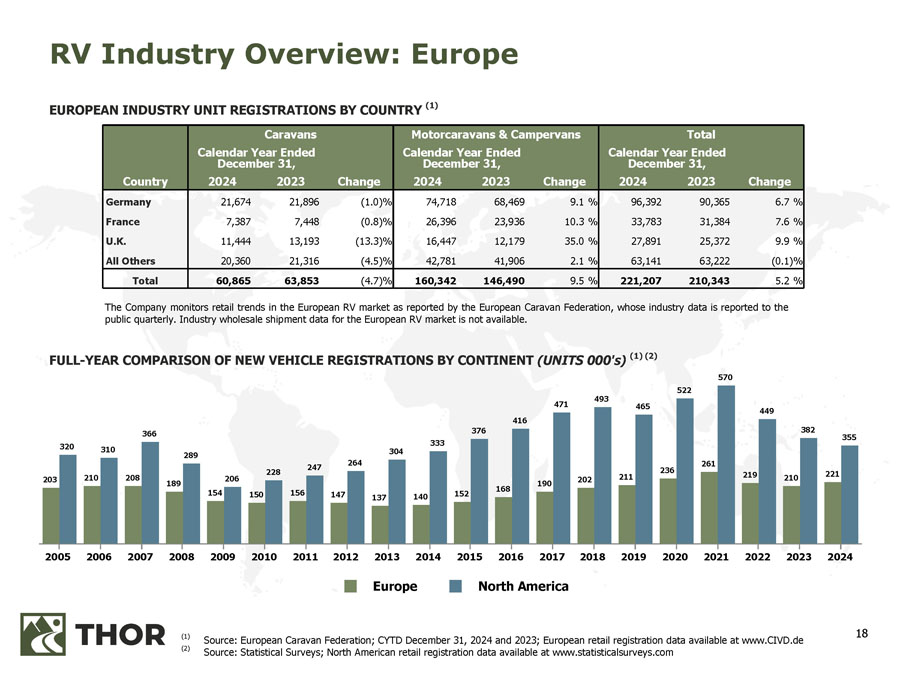
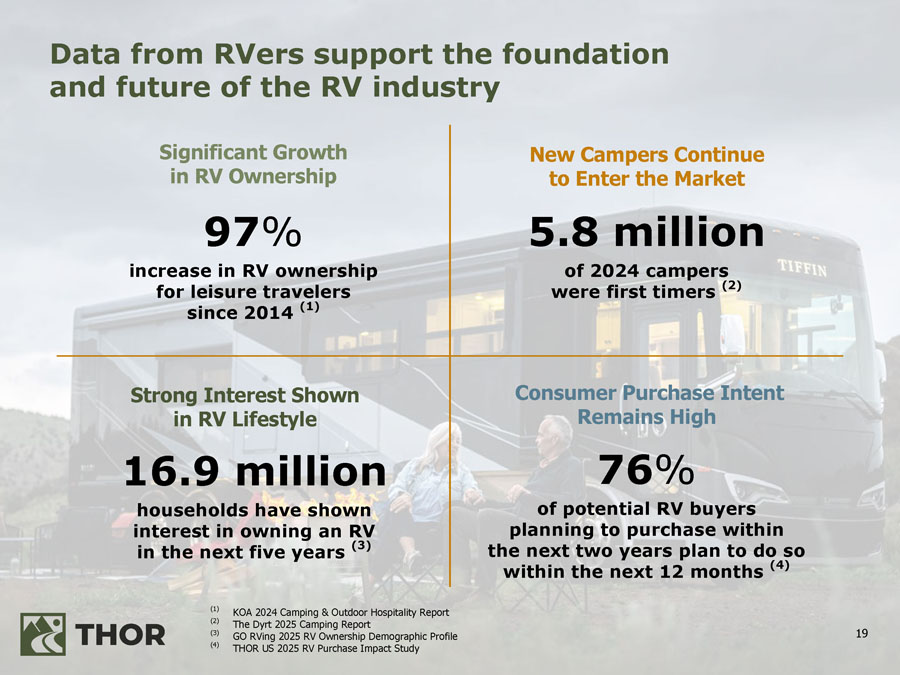
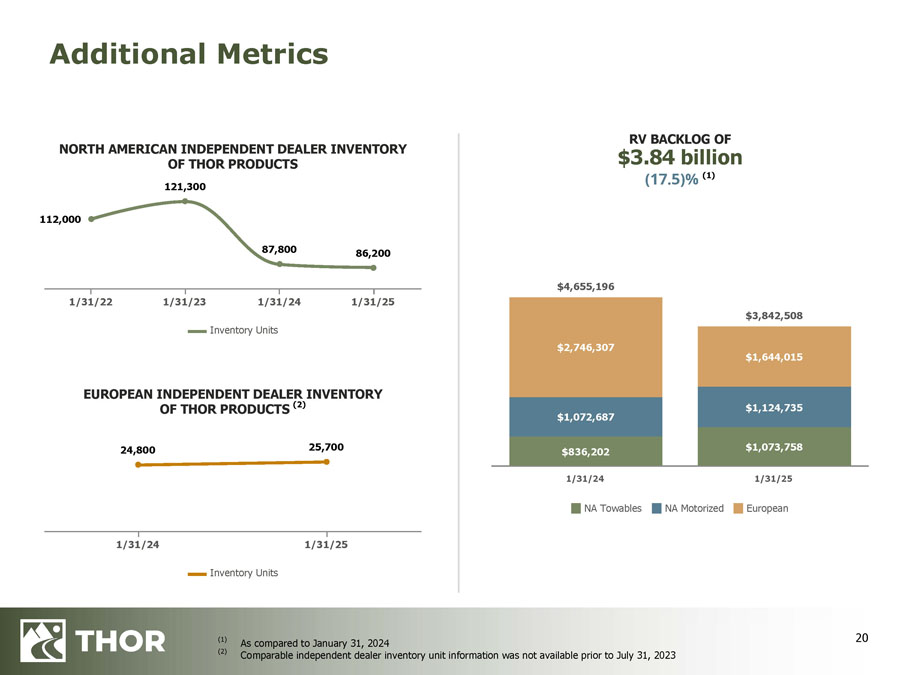
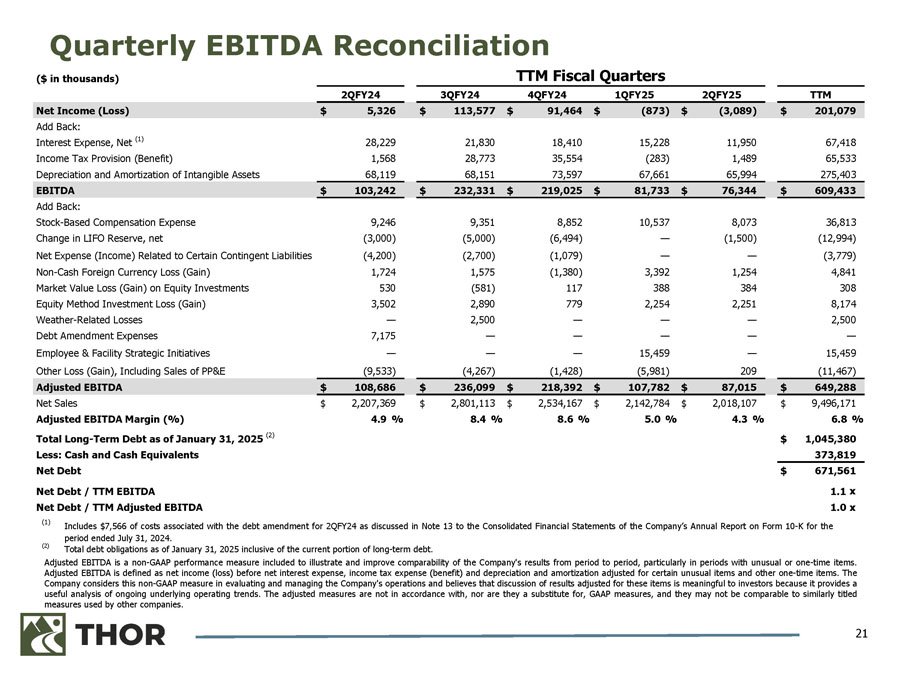

Exhibit 99.3

SECOND QUARTER FISCAL 2025
INVESTOR QUESTIONS & ANSWERS
March 5, 2025
Forward-Looking Statements
Reference is made to the forward-looking statements disclosure provided
at the end of this document.
Fiscal Second Quarter 2025 Highlights
| ($ in thousands, except for per share data) | |
Three Months Ended January 31, | |
| |
|
Six Months Ended January 31, | |
|
| | |
2025 | |
2024 | |
Change | |
|
2025 | |
2024 | |
Change |
| Net Sales | |
$ | 2,018,107 | | |
$ | 2,207,369 | | |
| (8.6 | )% | |
|
$ | 4,160,891 | | |
$ | 4,708,128 | | |
| (11.6 | )% |
| Gross Profit | |
$ | 245,197 | | |
$ | 270,847 | | |
| (9.5 | )% | |
|
$ | 526,639 | | |
$ | 628,779 | | |
| (16.2 | )% |
| Gross Profit Margin % | |
| 12.1 | % | |
| 12.3 | % | |
| (20 | ) bps | |
|
| 12.7 | % | |
| 13.4 | % | |
| (70 | ) bps |
| Net Income (Loss) Attributable to THOR | |
$ | (551 | ) | |
$ | 7,217 | | |
| (107.6 | )% | |
|
$ | (2,383 | ) | |
$ | 60,782 | | |
| (103.9 | )% |
| Diluted Earnings (Loss) Per Share | |
$ | (0.01 | ) | |
$ | 0.13 | | |
| (107.7 | )% | |
|
$ | (0.04 | ) | |
$ | 1.13 | | |
| (103.5 | )% |
| Cash Flows from Operations | |
$ | 30,842 | | |
$ | (103,868 | ) | |
| 129.7 | % | |
|
$ | 61,582 | | |
$ | (44,200 | ) | |
| 239.3 | % |
| | |
| | | |
| | | |
| | | |
|
| | | |
| | | |
| | |
| EBITDA(1) | |
$ | 76,344 | | |
$ | 103,242 | | |
| | | |
|
$ | 158,077 | | |
$ | 263,299 | | |
| | |
| Adjusted EBITDA(1) | |
$ | 87,015 | | |
$ | 108,686 | | |
| | | |
|
$ | 194,797 | | |
$ | 275,604 | | |
| | |
(1) See reconciliation of non-GAAP measures to most directly
comparable GAAP financial measures included in this release
Revised Full-Year Fiscal 2025 Guidance
| • | Consolidated net sales in the range of $9.0 billion
to $9.5 billion |
| • | Consolidated gross profit margin in the range of 13.8% to
14.5% |
| • | Diluted earnings per share in the range of $3.30 to
$4.00 |
Quick Reference to Contents
| Q&A |
|
| |
|
|
|
| |
|
Market Update & Outlook |
2 |
| |
|
Operations Update |
4 |
| |
|
Strategic Update |
6 |
| |
|
Financial Update |
8 |
| |
|
|
|
| Segment Data |
|
| |
|
|
|
| |
|
Summary of Key Quarterly Segment Data – North American Towable RVs |
12 |
| |
|
Summary of Key Quarterly Segment Data – North American Motorized RVs |
13 |
| |
|
Summary of Key Quarterly Segment Data – European RVs |
14 |
| |
|
|
|
| Non-GAAP Reconciliation |
15 |
| |
|
|
|
| Forward-Looking Statements |
16 |
Q&A
MARKET UPDATE & OUTLOOK
| 1. | What is your assessment of the current sentiment of your North American independent dealers and your
outlook for the remainder of fiscal 2025? |
| a. | Beginning at our Open House event in September 2024 and continuing through the recent trade shows and
events that have taken place in early calendar year 2025, we saw consistent signs and positive indications of a return of higher independent
dealer optimism and a strengthening of consumer confidence. Despite the positive indicators seen at trade shows and other events, we have
continued to closely monitor consumer confidence as it has begun to adjust downward in the early part of calendar year 2025. The relative
adjustment in consumer confidence on a go-forward basis is viewed by THOR as a significant indicator of the relative strength of the RV
market. |
Should consumer confidence begin to trend more favorably, the
outlook for the second half of our fiscal year 2025 could be stronger than we currently anticipate. For now, THOR intends to take a cautious
approach regarding the timing of the rebound of consumer sentiment that will eventually return the industry back to baseline. In the interim,
we expect product mix will continue to favor lower cost and lower margin units as our independent dealers work through the current macroeconomic
challenges that have resulted in higher costs and higher interest rates while holding back consumer confidence. Throughout this extended
downturn in our market, we have not wavered from our strategy of prudence and, as a result, THOR is poised to outperform the market when
retail demand inevitably improves.
In March 2025, the Recreational Vehicle Industry Association
(“RVIA”) revised their wholesale unit shipments forecast for calendar year 2025, calling for a range of North American wholesale
shipments of approximately 333,400 to 366,800 units with a median point of 350,100 units. This revised estimate for calendar year 2025
shipments represents a moderate increase from the actual calendar year 2024 wholesale shipment total of 333,733 units. THOR’s outlook
aligns with the lower end of the RVIA forecast but recognizes the potential upside.
| 2. | What is your view on the current status of North American retail demand? |
| a. | As we discussed when we reported our full year fiscal 2024 results, the first two quarters of fiscal year
2025 were forecasted to be challenging. We believe that the retail market will be moderately stronger on a year-over-year basis through
the spring selling season. Despite moving beyond a contentious election cycle and benefiting from slightly lower interest rates, we are
aware of the recent drop in consumer confidence reported in February 2025. We believe that the trajectory of the consumer confidence indicator
from this point through the end of our fiscal year will be directly correlated with the strength of retail demand. |
| 3. | Can you provide an update on your outlook on the European retail environment for the remainder of fiscal
2025? |
| a. | Our outlook in Europe remains positive, supported by healthy indicators within retail registrations, backlog,
and consumer sentiment. Market demand in Europe continues to follow a similar trend as seen in North America, as we are seeing downward
pressure on overall volume due to the current macroeconomic environment as well as a shift in consumer preferences that is leading premium
and entry-level brands to perform relatively well while sales volumes for our mainstream brands are suppressed. |
Despite the macroeconomic challenges and difficulties within
the mainstream brands, we remain positive in our outlook due to underlying retail data. According to the European Caravan Federation (“ECF”),
total retail registrations in Europe for the calendar year ended December 31, 2024 increased 5.2% in comparison with the prior-year period.
This positive trend was driven by a 9.5% increase in registrations of motorcaravans and campervans, partially offset by a decrease in
registrations of caravans of 4.7% during the period. Retail sales of product produced by our European segment realized growth of 20.1%
during calendar year 2024 compared to calendar year 2023.
In addition to the positive trends within retail data, we believe
that the recent European Central Bank (“ECB”) interest rate cuts will improve sales channel throughput as carrying costs are
reduced for independent dealers and the overall costs are moderated for retail customers. While these cuts may slow in the coming year,
we feel well positioned to continue growing our market share with a favorable product mix. In calendar year 2024, we achieved a motorcaravan
and campervan market share of 24.9%, a sizeable improvement upon our 20.9% market share for calendar year 2023 driven by the strength
of our brands and improved access to chassis.
We continue to see positive consumer sentiment indicators through
our participation in European trade fairs. Similar to the results of the 2024 Caravan Salon trade fair in Düsseldorf, Germany (“CSD”),
our European brands reported a successful show in January at the 2025 Caravan, Motor, and Tourism trade fair in Stuttgart, Germany (“CMT”).
Our brands indicate increased sales achievement at the show over the prior year, and show attendance was reported to be higher than the
prior year as well. These indicators all support our confidence in the underlying consumer demand and enthusiasm for our products in the
European market.
| 4. | Does affordability remain a key focus for retail customers? If so, how are you addressing any affordability
concerns that may be slowing the retail market recovery? |
| a. | Yes. Consumers in both North America and Europe continue to be focused on affordability, and it is a key
matter that we are working hard to address. For some time, we have been focused on managing our bills of materials as aggressively as
we can to help drive down average sales prices (“ASPs”) so as to better position our products for current consumer demands.
Higher material and production costs have impacted RV pricing, but we are actively working to manage expenses, optimize our supply chain
and provide the best value to our customers. Tariffs, addressed below, are likely to have a modest impact on ASPs as we look ahead. |
Through the extended downturn, we have made strides in addressing
affordability concerns in a number of ways, including an increased product mix of lower-cost travel trailers in North America. The adaptation
of our product mix to meet consumer demand and the efforts to manage our bills of materials have significantly contributed to the 11.1%
reduction in ASPs within our North American Towable segment we have seen through the first six months of fiscal 2025 compared to the prior-year
period, while having just a 2.4% increase in ASPs within our North American Motorized segment during the same comparative periods. Our
strategic actions to deepen independent dealer relationships have also given us the opportunity to work closely with our dealer partners
to produce the optimal product mix and reach the desired price points to meet customers’ needs.
Although we cannot control the external forces impacting affordability,
we remain focused on continuously adapting to market conditions while providing support to our independent dealers and delivering high-quality,
innovative RVs that meet the needs of our customers.
OPERATIONS UPDATE
| 1. | Did the development of independent dealer inventories during your second fiscal quarter meet your expectations?
Do their levels compared to your fiscal first quarter align with your anticipated cadence of wholesale shipments for the second half of
THOR’s fiscal 2025? |
| a. | North American independent dealer inventories of THOR products increased
to approximately 86,200 units as of January 31, 2025 from approximately 75,000 units at the end of our first quarter ended October 31,
2024. However, on a year-over-year basis, our dealer inventories are moderately below the 87,800 units inventoried by our dealers as of
January 31, 2024. The increase from our fiscal first quarter is in line with, if not a bit below, historical trends of dealer inventory
growth entering the spring selling season, with towables being the largest contributor to the increase. Our operating companies continue
to appropriately align production with retail pull-through while independent dealers manage their inventory levels in light of the current
retail sales levels and associated carrying costs of their inventory. We believe that the current level of North American independent
dealer inventory, while materially below historic norms, is appropriate and positions THOR to outperform the market when the inevitable
market recovery occurs. |
European independent dealer inventories have steadied after the
restocking activities of fiscal 2023 and part of fiscal 2024. At the end of the fiscal 2025 second quarter, our European dealer inventories
increased minimally from their fiscal 2025 first quarter levels as we continue to align production and wholesale sales with retail sales.
Our European segment’s calendar year 2024 retail sales increased 20.1% compared to calendar year 2023 retail sales. Despite the
continued growth in consumer demand, dealer inventories have remained relatively steady and have met our expectations surrounding our
production alignment strategy. As of January 31, 2025, European dealer inventory levels of THOR products approximated 25,700 units, slightly
below the 26,200 units at the end of fiscal 2024 and slightly above the 24,800 units from the prior year, January 31, 2024. We believe
that current European dealer inventory levels as of January 31, 2025 for our motorized products are in line with current market conditions,
while towable inventory is slightly elevated. Overall, our European dealer inventory levels are situated at an appropriate level relative
to the anticipated cadence of wholesale shipments in our fiscal second half.
THOR intends to remain consistent with our approach throughout
the current down cycle, with our operating companies using a disciplined and conservative approach to align production with retail pull-through.
Additionally, we will continue to work closely with our independent dealer partners to monitor retail demand and appropriate product mix.
We believe independent dealer inventory is at an adequate level to allow us to respond quickly to shifts in market demand and deliver
on our fiscal 2025 second half goals.
| 2. | What are the key factors affecting current backlog levels? |
| ($ in thousands) | |
As of January 31, | |
|
| | |
2025 | |
2024 | |
Change |
| Recreational vehicles | |
| | | |
| | | |
| | |
| North American Towable | |
$ | 1,073,758 | | |
$ | 836,202 | | |
| 28.4 | % |
| North American Motorized | |
| 1,124,735 | | |
| 1,072,687 | | |
| 4.9 | % |
| Total North America | |
| 2,198,493 | | |
| 1,908,889 | | |
| 15.2 | % |
| European | |
| 1,644,015 | | |
| 2,746,307 | | |
| (40.1 | )% |
| Total | |
$ | 3,842,508 | | |
$ | 4,655,196 | | |
| (17.5 | )% |
Our North American Towable segment backlog as of January 31,
2025 increased by 28.4% compared to January 31, 2024, which was in line with expectations of improved retail demand in the upcoming second
half of our fiscal year and spurred on by the strong year-over-year net sales increase of 13.3% in our fiscal second quarter compared
to the prior-year period. Our North American Motorized segment backlog increased 4.9% on a year-over-year basis as we enter the historically
stronger second half of our fiscal year despite softness in retail demand for motorized products. Our independent dealers continue to
manage their stocking levels and ordering cadence of motorized products to align with retail demand.
In Europe, our backlog decreased 40.1% compared to the prior
year. This decrease is mainly due to an elevated level of orders in prior periods caused by the impact of a chassis shortage on our production.
European backlog as of January 31, 2024 was thus elevated due to the corresponding need to restock the independent dealer inventories
of our products that had dwindled as a consequence of the lacking chassis supply. Overall, we view the level of our current European backlog
as appropriate given the current macroeconomic conditions and sufficient to allow for a strong fiscal 2025 second half performance by
our European segment.
STRATEGIC UPDATE
| 1. | How is THOR positioning itself to manage the current tariff environment? What impact do you anticipate
the tariffs will have on THOR’s operational and financial performance? |
| a. | We are closely monitoring the new tariff policies and assessing their potential impact on our supply chain.
While some components in our RVs are sourced from the affected countries, a high percentage of raw materials and distributed products
are sourced domestically. Likewise, while a certain amount of motorized chassis utilized in our North American production are imported
from abroad, the majority of our models use domestically produced chassis. |
Similar to many of our key suppliers, THOR is well situated for
this environment after previously experiencing the impact of tariff policies subsequent to the 2016 election as well as the supply chain
disruptions caused by the COVID-19 pandemic. As a result of these events, our owned supply companies have positioned their supply chains
optimally to avoid material impact from an aggressive tariff policy by expanding their sourcing options and increasing their domestic
choices. Further, the domestically made products of our owned supply companies will help mitigate potential cost increases.
We do anticipate experiencing some cost increases for the limited
number of components and distributed products that are imported from abroad, as well as on certain chassis that are imported. Additionally,
we expect some suppliers to reactivate pass-through mechanisms that were introduced during previous tariff environments. However, given
the fluidity of the tariff policies, we will refrain from quantifying the potential impact to margins and earnings at this time. If fully
implemented, we believe that it is likely that the tariff policies will result in manageable impacts on ASPs. The mitigation strategies
we already have in place will serve to limit those impacts and allow us to remain committed to delivering high quality RVs at desirable
price points while adapting to these economic changes.
| 2. | What steps are you taking to position the company to outperform the market upon its return to baseline? |
| a. | Across our portfolio of companies in both North America and Europe, we have engaged in brand and operational
optimization. Our focus is on delivering high quality products that resonate with consumers, while remaining mindful of the challenges
that they face due to the prolonged macroeconomic headwinds. Through this process, we are focused on production of brands that are performing
well in the current market conditions and have pulled back from brands that have experienced more difficulties. As we look ahead, particularly
in North America, we see further opportunities to strategically align our company with prevailing market conditions that consider current
and future factors impacting the industry such as dealer consolidation. |
These steps have and will continue to assist us in building an
improved margin profile. While our margins have been pressured during this extended downturn in our market, execution of these key strategies
have kept them above what we would have historically realized and position THOR to outperform when the economic headwinds abate and the
market returns.
| 3. | Can you provide an update on the anticipated impact on North American Motorized sales as a result of
the California Advanced Clean Trucks (“ACT”) regulation? What is THOR’s strategy to leverage its strengths to mitigate
potential negative impacts, as well as to take advantage of possible opportunities? |
| a. | The California ACT regulation implemented Zero-Emission Vehicle (“ZEV”) sales requirements
on medium and heavy-duty vehicle manufacturers beginning on January 1, 2025. Certain additional states have already or are planning to
adopt ACT in calendar year 2025, with more to follow in calendar years 2026 and 2027. The intention of the regulation put forth by the
California Air Resource Board (“CARB”) is to promote the development and sale of ZEVs and Near-Zero Emission Vehicles (“NZEV”).
The sale of ZEVs and NZEVs generates credits that may be used, bought or sold to offset the sale of traditional chassis powered by internal
combustion engines. |
While the ACT regulation covers a wide range of medium and heavy-duty
chassis that we utilize in our business, based on conversations with our chassis suppliers, we do not currently anticipate any impact
to our Class A gas, Class C gas, or Class B product lines in fiscal year 2025 as a result of ACT regulations. While we continue to explore
solutions with our Class A and Class C diesel chassis suppliers, there is some potential that our sale of Class A and Class C diesel motorhomes
into California and other adopting states will be limited in fiscal year 2025. In fiscal year 2024, Class A and Class C diesel products
impacted by ACT represented approximately 1% of our overall North American unit sales, of which only a portion related to California and
the additional states planning to adopt ACT in calendar year 2025.
THOR has been preparing for and responding to the ACT regulation
and other regulatory changes in multiple ways. First, our strategic planning to develop and produce a plug-in hybrid Class A motorhome
on a Harbinger chassis will be instrumental in our ability to adapt to the new regulation in California and any other states that eventually
adopt the ACT regulation. This hybrid Class A, which will qualify as an NZEV, gives us a product offering that we can sell in the adopting
states without needing to procure offsetting credits. Additionally, our relationship with Harbinger gives us access to purchase additional
ACT credits that Harbinger generates, which could potentially be transferred to other chassis manufacturers, including any impacted Class
A and Class C diesel chassis manufacturers. This will help support impacted chassis manufacturers to continue to produce traditional internal
combustion engine chassis for THOR to build upon and sell into California and the other adopting states. We are also working directly
with our traditional chassis supply chain in developing technologies and systems that enable us all to continue to operate, without interruption,
within the framework of the ACT regulation.
Given our efforts to strategically position ourselves, we continue
to expect minimal impact on our consolidated sales as a consequence of the enactment of the ACT regulation.
| 4. | How do you foresee the M&A environment developing given the current macroeconomic conditions? |
| a. | Given the duration of the challenging market conditions in North America and Europe, we foresee the potential
for growth opportunities in both markets to arise in the traditional RV OEM space, particularly in Europe, and on the supply side. Despite
the market challenges, THOR has strengthened its overall financial position over the past two years and, through the disciplined implementation
of our strategic operating plan, we have successfully generated strong cash flows. We also strategically extended our primary debt facilities
at favorable terms in the fall of 2023, thereby solidifying our liquidity profile. As such, THOR is well-positioned to execute on our
M&A strategy, a pillar of our historical track record of success, and to seize upon growth opportunities as they become available. |
FINANCIAL UPDATE
| 1. | The gross profit margin percentage for your North American Towable segment increased to 11.1% for the
second quarter of fiscal year 2025 compared to 7.4% in the second quarter of fiscal year 2024. What are the main drivers of this improved
margin performance? Do you expect this improvement to continue in the second half of your fiscal 2025? |
| a. | The 370 basis point improvement in our North American Towable gross profit margin performance in the second
quarter of fiscal 2025 was primarily the result of an increase in net sales of 13.3%, mainly driven by a notable increase in the demand
for our lower-cost travel trailer units over the prior-year quarter, along with the combined net favorable impact of lower sales discounting
and the implementation of management-driven cost savings initiatives. |
Over the course of the past several fiscal quarters, while market
conditions have remained dynamic and challenging, our teams have been in constant communication with our vendor and independent dealer
partners and have been working tirelessly to proactively manage our production to align with retail demand to ensure optimal inventory
levels in the field and channel pull-through. As a result, we have been able to ensure that our independent dealers have the units they
need, when they need them so as to avoid excess discounting activity stemming from an undesirable build-up or aging of the product on
their lots.
Additionally, our teams have maintained their focus on improving
operational efficiency, reducing overhead costs and continuously improving quality to drive down warranty costs, which, in combination,
further contributed to the improvement of our North American Towable gross profit margin for the quarter.
The continued effective implementation of our strategic approach
to both the management of production and improvement of processes is a testament to the experience and strength of the management teams
we have in place at our operating companies. This strategic approach, along with the strength of our management teams, positions our North
American Towable segment to continue its strong margin performance, especially if the expectation is realized that the retail market will
trend more favorably as we progress through the remainder of our fiscal 2025.
There is, however, a heightened level of economic uncertainty
that will play a significant role in shaping the performance of both our North American Towable segment and overall consolidated results
for the remainder of our fiscal year. In particular, we are intent on monitoring consumer confidence, recognizing that it is a leading
indicator for our industry. After having trended positively over the final months of calendar 2024, the significant drop we have seen
in consumer confidence since the beginning of calendar 2025 has certainly been a setback for our industry. Additionally, we must now take
into consideration any repercussions that may arise from the new U.S. tariff policy and how those could impact consumer confidence. Whether
our performance over the remainder of our fiscal year will exceed our current expectations will largely depend on the size and direction
of any shifts in consumer confidence from now until the end of the summer months. In the interim, our focus will remain on controlling
what we can control and best positioning the company to excel upon the market’s return to baseline.
| 2. | The North American Motorized segment saw year-over-year decreases in both net sales and gross margin
percentage during the second quarter of fiscal year 2025. What contributed to these decreases? |
| a. | Our North American Motorized segment continues to be unfavorably impacted by prolonged macroeconomic headwinds,
resulting in a year-over-year decrease of 21.8% in net sales for the second quarter of fiscal 2025. This overall decrease of 21.8% includes
a 20.5% decrease in unit shipments as retail demand continues to lag and, as a result, dealers have remained conservative in their ordering
patterns and management of their stocking levels. The remaining 1.3% decrease in net sales can be attributed to a decline in the overall
net price per unit due to a shift in product mix towards our more moderately-priced Class A units. We expect sales volumes to recover
moderately in the second half of our fiscal year 2025 as dealers adjust their desired stocking levels to meet customer demands during
the spring selling season. While independent dealer inventory of THOR North American Motorized products has decreased 22.2% since January
31, 2024, we did see a slight increase of 1.1% in Motorized dealer inventories during the second quarter of fiscal 2025 compared to our
first fiscal quarter after experiencing declining levels in the preceding quarters, affirming our belief of a stronger second half of
our fiscal year for our North American Motorized segment. |
Our North American Motorized gross profit margin in our second
quarter of fiscal 2025 decreased to 7.8% from the 10.6% realized in the second quarter of fiscal 2024 due to the decrease in net sales
and an increase in our costs of products sold as a percentage of net sales. Despite the reduced sales volumes, our management teams successfully
controlled overhead costs as they increased a modest amount in the quarter as a percentage of net sales compared to the prior year period.
While our costs of products sold decreased on a dollar-for-dollar basis along with net sales, we saw an increase as a percentage of sales
due to an increase in sales discounting, effectively reducing net selling prices and correspondingly increasing our material costs as
a percentage of net sales. Affordability has been an area of focus for both our independent dealers and retail customers and has been
a factor in suppressing sales volumes. While we are actively managing ASPs for our motorized products, external forces (such as financing
costs) remain a hindrance in reducing the price pressures on our independent dealers and retail customers. Because of this, we extended
our promotional activity with our independent dealers during the quarter in an attempt to spur retail pull-through, which added pressure
to our margins in the near term.
As we enter the spring selling season and continue to optimize
our product mix and price points, we anticipate that retail activity will pick up and our North American Motorized segment net sales and
gross profit margin will move toward more normalized levels. The development of consumer confidence for the North American consumer will
ultimately have a significant impact on the performance of our Motorized segment for the remainder of our fiscal year.
| 3. | THOR’s European segment performance for the second quarter of fiscal 2025 declined compared to
the prior-year period. What factors are influencing the segment’s performance, and are the segment’s results for the first
half of fiscal 2025 in line with your expectations? |
| a. | As with the first quarter, the results of our European segment for the second quarter of fiscal 2025 were
consistent with both our expectations and historical norms for the period. While the second quarter typically includes improved performance
compared to the first quarter, it is still impacted by holiday plant shutdowns (albeit to a lesser extent) and trade show costs related
to CMT and other trade shows throughout the continent. These items impacted last year as well, but the performance for the second quarter
of fiscal 2024 still included a level of independent dealer inventory restocking, leading to historically stronger net sales and gross
margin levels. |
Our European segment continues to be impacted by similar market
trends as seen in North America. Consumer preferences remain focused on premium and entry-level products, while mainstream products have
seen lower demand. This has caused increased promotional activities in both the first and second quarters of fiscal 2025 to aid in the
rightsizing of independent dealer inventories for mainstream products compared to the first half of fiscal 2024. These promotional activities
are increasingly concentrated within certain product lines and models, and thus discounting as a percentage of sales held relatively steady
in our fiscal 2025 second quarter compared to our fiscal 2025 first quarter. The stabilizing promotional activity has allowed for ASPs
to remain strong. ASPs for the European segment in our second quarter of fiscal 2025 increased 8.5% compared to the prior-year period
and have increased 12.8% YTD for fiscal 2025 compared to the YTD period for fiscal 2024.
While the second quarter and first half of fiscal 2025 were below
last year’s historically high levels, we remain confident that our European segment is appropriately positioned with an advantageous
product mix at our independent dealers and expect the segment to meet our originally planned internal forecast for the second half of
fiscal 2025.
| 4. | SG&A costs for your second fiscal quarter of 2025 declined significantly year-over-year. What are
the key drivers of this, and what do you anticipate full year SG&A costs to be? |
| a. | Consolidated SG&A costs decreased $13.9 million in the second fiscal quarter of 2025 compared to the
same period of fiscal 2024. This decrease included a $7.9 million reduction in legal and professional fees, primarily due to the prior-year
period including $7.2 million in third-party fees related to the November 2023 debt refinancing. There was also a decrease in deferred
compensation expense of $7.1 million due to market value fluctuations between the two periods, which was primarily offset by the increase
in other income related to the deferred compensation plan assets. Further, the 8.6% decrease in consolidated net sales and the decrease
in consolidated income before income taxes in our second fiscal quarter of 2025 compared to the prior-year period resulted in lower related
sales commissions and other incentive compensation. These decreases compared to the prior-year quarter were partially offset by favorable
adjustments to certain contingent liabilities in the prior-year quarter. Taking into consideration these second quarter amounts, we expect
consolidated SG&A costs to be approximately 9.5% for the full 2025 fiscal year. Projecting beyond fiscal 2025, we anticipate that
our consolidated SG&A costs will settle at approximately 9%. |
| 5. | THOR revised its full-year fiscal 2025 guidance in its press release. What are the key assumptions to this guidance, and what factors
led to your revision? |
| a. | For fiscal year 2025, we originally forecasted the continuation of a softer retail market and established
a cautious approach regarding global economic outlook and the associated impacts on consumer demand and sizeable discretionary purchases.
This has developed as expected, although the early part of calendar year 2025 has continued to see cautious consumer behavior. While our
outlook for wholesale shipments remains in line with our initial forecast, we have experienced moderately greater pressure on margins
to both our North American Motorized and European operations that has applied downward pressure on our consolidated margin. Additionally,
we have completed strategic actions with key independent dealer partners to optimize our market positioning as we near the gradual return
of a more normalized market. |
Throughout fiscal 2025, we will continue to manage the Company
to maximize our performance in the current environment as we position products in the market that address the affordability concerns of
our independent dealers and retail customers. Recent declines in consumer confidence and evolving tariff policies have created a level
of uncertainty within the market that is continuing to develop even as we issue this release. We will respond to future market changes
as we always have, with a focus on maximizing performance within the given environment. We also anticipate that the groundwork to the
key elements to our path of meaningful earnings growth, which include our strategic actions in deepening the partnerships with our independent
dealers that are expected to yield improved market share, and our focus on evolving our organization to align optimally with the continually
consolidating marketplace, will begin to add meaningfully to our fiscal 2025 second half results. Based on current expectations surrounding
overall market volumes in both North America and Europe, the Company has revised its initial financial guidance for fiscal 2025.
For fiscal 2025, the Company’s updated
full-year financial guidance now includes:
| • | Consolidated net sales in the range of $9.0 billion to $9.5 billion (narrowing the previous range of $9.0
billion to $9.8 billion) |
| • | Consolidated gross profit margin in the range of 13.8% to 14.5% (previously in the range of 14.7% to 15.2%) |
| • | Diluted earnings per share in the range of $3.30 to $4.00 (previously in the range of $4.00 to $5.00) |
As we look beyond our fiscal 2025, we still expect to see a stronger
retail environment in the latter half of calendar 2025 and the beginning of our fiscal 2026. As a result of management’s continued
execution of our proven operating model that has kept production in line with the current retail environment, our operating companies
are well positioned to leverage the capacity of THOR so as to realize the financial benefits of the coming return of a more robust retail
environment. A normalized retail environment will also allow us to further leverage key elements to our path to meaningful earnings growth,
namely improved market share with products and an organizational structure aligned optimally with a consolidating marketplace.
| 6. | Does your current outlook align with the RVIA’s most recently released forecast for calendar
year 2025? |
| a. | The Company’s North American operating plan for fiscal 2025, which ends on July 31, 2025, is in
line with the lower range of the most recent RVIA industry-wide wholesale shipment forecast. We believe that the median point of the RVIA’s
wholesale shipment forecast for calendar 2025 is slightly aggressive and see potential for closer to 335,000 units. To be clear, however,
if consumer confidence begins to trend favorably, realization of the RVIA’s median forecast is entirely possible. Consistent with
our forecast, the RVIA expects year-over-year shipment growth throughout calendar year 2025 as the industry enters its recovery and growth
phase. |
While we note that the exact timing of accelerating unit shipment
growth will ultimately depend on the timing of easing macroeconomic pressures and the resulting improvements in consumer confidence, we
are largely in agreement with the RVIA’s most recent calendar year 2025 forecast of between 333,400 and 366,800 units.
Summary of Key Quarterly Segment Data – North American Towable RVs
Dollars are in thousands
| NET SALES: | |
Three Months Ended January 31, | |
|
| | |
2025 | |
2024 | |
Change |
| North American Towable | |
| | | |
| | | |
| | |
| Travel Trailers | |
$ | 518,620 | | |
$ | 471,483 | | |
| 10.0 | % |
| Fifth Wheels | |
| 309,646 | | |
| 259,485 | | |
| 19.3 | % |
| Total North American Towable | |
$ | 828,266 | | |
$ | 730,968 | | |
| 13.3 | % |
| # OF UNITS: | |
Three Months Ended January 31, | |
|
| | |
2025 | |
2024 | |
Change |
| North American Towable | |
| | | |
| | | |
| | |
| Travel Trailers | |
| 23,140 | | |
| 17,652 | | |
| 31.1 | % |
| Fifth Wheels | |
| 4,873 | | |
| 4,306 | | |
| 13.2 | % |
| Total North American Towable | |
| 28,013 | | |
| 21,958 | | |
| 27.6 | % |
| ORDER BACKLOG: | |
As of January 31, | |
|
| | |
2025 | |
2024 | |
Change |
| North American Towable | |
$ | 1,073,758 | | |
$ | 836,202 | | |
| 28.4 | % |
| TOWABLE RV MARKET SHARE SUMMARY: (1) | |
Calendar Years |
|
|
|
|
| | |
2024 | |
2023 |
|
|
|
|
| U.S. Market | |
| 37.9 | % | |
| 40.4 | % |
|
|
|
|
| Canadian Market | |
| 38.8 | % | |
| 41.7 | % |
|
|
|
|
| Combined North American Market | |
| 38.0 | % | |
| 40.5 | % |
|
|
|
|
(1) Source: Statistical Surveys, Inc., Calendar years ended
December 31, 2024 and 2023.
Note: Data reported by Stat Surveys is based on official state and provincial
records. This information is subject to adjustment, is continuously updated, and is often impacted by delays in reporting by various states
or provinces.
Summary of Key Quarterly Segment Data – North American Motorized
RVs
Dollars are in thousands
| NET SALES: | |
Three Months Ended January 31, | |
|
| | |
2025 | |
2024 | |
Change |
| North American Motorized | |
| | | |
| | | |
| | |
| Class A | |
$ | 148,009 | | |
$ | 178,308 | | |
| (17.0 | )% |
| Class C | |
| 204,053 | | |
| 275,632 | | |
| (26.0 | )% |
| Class B | |
| 94,236 | | |
| 116,484 | | |
| (19.1 | )% |
| Total North American Motorized | |
$ | 446,298 | | |
$ | 570,424 | | |
| (21.8 | )% |
| # OF UNITS: | |
Three Months Ended January 31, | |
|
| | |
2025 | |
2024 | |
Change |
| North American Motorized | |
| | | |
| | | |
| | |
| Class A | |
| 847 | | |
| 875 | | |
| (3.2 | )% |
| Class C | |
| 1,902 | | |
| 2,539 | | |
| (25.1 | )% |
| Class B | |
| 777 | | |
| 1,024 | | |
| (24.1 | )% |
| Total North American Motorized | |
| 3,526 | | |
| 4,438 | | |
| (20.5 | )% |
| ORDER BACKLOG: | |
As of January 31, | |
|
| | |
2025 | |
2024 | |
Change |
| North American Motorized | |
$ | 1,124,735 | | |
$ | 1,072,687 | | |
| 4.9 | % |
| MOTORIZED RV MARKET SHARE SUMMARY: (1) | |
Calendar Years |
|
|
|
|
| | |
2024 | |
2023 |
|
|
|
|
| U.S. Market | |
| 47.0 | % | |
| 48.5 | % |
|
|
|
|
| Canadian Market | |
| 50.0 | % | |
| 51.5 | % |
|
|
|
|
| Combined North American Market | |
| 47.2 | % | |
| 48.7 | % |
|
|
|
|
(1) Source: Statistical Surveys, Inc., Calendar years ended
December 31, 2024 and 2023.
Note: Data reported by Stat Surveys is based on official state and provincial
records. This information is subject to adjustment, is continuously updated and is often impacted by delays in reporting by various states
or provinces.
Summary of Key Quarterly Segment Data – European RVs
Dollars are in thousands
| NET SALES: | |
Three Months Ended January 31, | |
|
| | |
2025 | |
2024 | |
Change |
| European | |
| |
| |
|
| Motorcaravan | |
$ | 335,646 | | |
$ | 424,813 | | |
| (21.0 | )% |
| Campervan | |
| 165,964 | | |
| 244,724 | | |
| (32.2 | )% |
| Caravan | |
| 42,180 | | |
| 51,087 | | |
| (17.4 | )% |
| Other | |
| 68,675 | | |
| 61,670 | | |
| 11.4 | % |
| Total European | |
$ | 612,465 | | |
$ | 782,294 | | |
| (21.7 | )% |
| # OF UNITS: | |
Three Months Ended January 31, | |
|
| | |
2025 | |
2024 | |
Change |
| European | |
| |
| |
|
| Motorcaravan | |
| 4,471 | | |
| 5,563 | | |
| (19.6 | )% |
| Campervan | |
| 3,138 | | |
| 5,382 | | |
| (41.7 | )% |
| Caravan | |
| 1,833 | | |
| 2,135 | | |
| (14.1 | )% |
| Total European | |
| 9,442 | | |
| 13,080 | | |
| (27.8 | )% |
| ORDER BACKLOG: | |
As of January 31, | |
|
| | |
2025 | |
2024 | |
Change |
| European | |
$ | 1,644,015 | | |
$ | 2,746,307 | | |
| (40.1 | )% |
| EUROPEAN RV MARKET SHARE SUMMARY: (1) | |
Calendar Years |
|
|
|
|
| | |
2024 | |
2023 |
|
|
|
|
| Motorcaravan and Campervan (2) | |
| 24.9 | % | |
| 20.9 | % |
|
|
|
|
| Caravan | |
| 18.0 | % | |
| 18.2 | % |
|
|
|
|
(1) Sources: Caravaning Industry Association e.V. (“CIVD”)
and European Caravan Federation (“ECF”), Calendar years ended December 31, 2024 and 2023.
Data from the ECF is subject to adjustment, continuously updated and is often impacted by delays in reporting by various countries (some
countries, including the United Kingdom, do not report OEM-specific data and are thus excluded from the market share calculation).
(2) The CIVD and ECF report motorcaravans and campervans together.
Note: Industry wholesale shipment data for the European RV market is not
available.
Non-GAAP Reconciliation
The following table reconciles net income (loss) to consolidated EBITDA
and Adjusted EBITDA:
EBITDA Reconciliation
($ in thousands)
| | |
Three Months Ended January 31, | |
Six Months Ended January 31, |
| | |
2025 | |
2024 | |
2025 | |
2024 |
| Net income (loss) | |
$ | (3,089 | ) | |
$ | 5,326 | | |
$ | (3,962 | ) | |
$ | 60,359 | |
| Add back: | |
| | | |
| | | |
| | | |
| | |
| Interest expense, net | |
| 11,950 | | |
| 28,229 | | |
| 27,178 | | |
| 48,426 | |
| Income tax provision | |
| 1,489 | | |
| 1,568 | | |
| 1,206 | | |
| 19,117 | |
| Depreciation and amortization of intangible assets | |
| 65,994 | | |
| 68,119 | | |
| 133,655 | | |
| 135,397 | |
| EBITDA | |
$ | 76,344 | | |
$ | 103,242 | | |
$ | 158,077 | | |
$ | 263,299 | |
| Add back: | |
| | | |
| | | |
| | | |
| | |
| Stock-based compensation expense | |
| 8,073 | | |
| 9,246 | | |
| 18,610 | | |
| 19,698 | |
| Change in LIFO reserve, net | |
| (1,500 | ) | |
| (3,000 | ) | |
| (1,500 | ) | |
| (3,000 | ) |
| Net expense (income) related to certain contingent liabilities | |
| — | | |
| (4,200 | ) | |
| — | | |
| (14,200 | ) |
| Non-cash foreign currency loss (gain) | |
| 1,254 | | |
| 1,724 | | |
| 4,646 | | |
| 745 | |
| Market value loss (gain) on equity investments | |
| 384 | | |
| 530 | | |
| 772 | | |
| 3,401 | |
| Equity method investment loss (gain) | |
| 2,251 | | |
| 3,502 | | |
| 4,505 | | |
| 9,437 | |
| Debt amendment expenses | |
| — | | |
| 7,175 | | |
| — | | |
| 7,175 | |
| Employee & facility strategic initiatives | |
| — | | |
| — | | |
| 15,459 | | |
| — | |
| Other loss (gain), including sales of PP&E | |
| 209 | | |
| (9,533 | ) | |
| (5,772 | ) | |
| (10,951 | ) |
| Adjusted EBITDA | |
$ | 87,015 | | |
$ | 108,686 | | |
$ | 194,797 | | |
$ | 275,604 | |
Adjusted EBITDA is a non-GAAP performance measure included to illustrate
and improve comparability of the Company's results from period to period, particularly in periods with unusual or one-time items. Adjusted
EBITDA is defined as net income (loss) before net interest expense, income tax expense (benefit) and depreciation and amortization adjusted
for certain unusual items and other one-time items. The Company considers this non-GAAP measure in evaluating and managing the Company's
operations and believes that discussion of results adjusted for these items is meaningful to investors because it provides a useful analysis
of ongoing underlying operating trends. The adjusted measures are not in accordance with, nor are they a substitute for, GAAP measures,
and they may not be comparable to similarly titled measures used by other companies.
Forward-Looking Statements
This release includes certain statements that are “forward-looking”
statements within the meaning of the U.S. Private Securities Litigation Reform Act of 1995, Section 27A of the Securities Act of 1933,
as amended, and Section 21E of the Securities Exchange Act of 1934, as amended. These forward-looking statements are made based on management’s
current expectations and beliefs regarding future and anticipated developments and their effects upon THOR, and inherently involve uncertainties
and risks. These forward-looking statements are not a guarantee of future performance. We cannot assure you that actual results will not
differ materially from our expectations. Factors which could cause materially different results include, among others: the impact of inflation
on the cost of our products as well as on general consumer demand; the effect of raw material and commodity price fluctuations, including
the impact of tariffs, and/or raw material, commodity or chassis supply constraints; the impact of war, military conflict, terrorism and/or
cyber-attacks, including state-sponsored or ransom attacks; the impact of sudden or significant adverse changes in the cost and/or availability
of energy or fuel, including those caused by geopolitical events, on our costs of operation, on raw material prices, on our suppliers,
on our independent dealers or on retail customers; the dependence on a small group of suppliers for certain components used in production,
including chassis; interest rates and interest rate fluctuations and their potential impact on the general economy and, specifically,
on our independent dealers and consumers and our profitability; the ability to ramp production up or down quickly in response to rapid
changes in demand while also managing costs and market share; the level and magnitude of warranty and recall claims incurred; the ability
of our suppliers to financially support any defects in their products; the financial health of our independent dealers and their ability
to successfully manage through various economic conditions; legislative, regulatory and tax law and/or policy developments including their
potential impact on our independent dealers, retail customers or on our suppliers; the costs of compliance with governmental regulation;
the impact of an adverse outcome or conclusion related to current or future litigation or regulatory investigations; public perception
of and the costs related to environmental, social and governance matters; legal and compliance issues including those that may arise in
conjunction with recently completed transactions; lower consumer confidence and the level of discretionary consumer spending; the impact
of exchange rate fluctuations; restrictive lending practices which could negatively impact our independent dealers and/or retail consumers;
management changes; the success of new and existing products and services; the ability to maintain strong brands and develop innovative
products that meet consumer demands; the ability to efficiently utilize existing production facilities; changes in consumer preferences;
the risks associated with acquisitions, including: the pace and successful closing of an acquisition, the integration and financial impact
thereof, the level of achievement of anticipated operating synergies from acquisitions, the potential for unknown or understated liabilities
related to acquisitions, the potential loss of existing customers of acquisitions and our ability to retain key management personnel of
acquired companies; a shortage of necessary personnel for production and increasing labor costs and related employee benefits to attract
and retain production personnel in times of high demand; the loss or reduction of sales to key independent dealers, and stocking level
decisions of our independent dealers; disruption of the delivery of units to independent dealers or the disruption of delivery of raw
materials, including chassis, to our facilities; increasing costs for freight and transportation; the ability to protect our information
technology systems from data breaches, cyber-attacks and/or network disruptions; asset impairment charges; competition; the impact of
losses under repurchase agreements; the impact of the strength of the U.S. dollar on international demand for products priced in U.S.
dollars; general economic, market, public health and political conditions in the various countries in which our products are produced
and/or sold; the impact of changing emissions and other related climate change regulations in the various jurisdictions in which our products
are produced, used and/or sold; changes to our investment and capital allocation strategies or other facets of our strategic plan; and
changes in market liquidity conditions, credit ratings and other factors that may impact our access to future funding and the cost of
debt.
These and other risks and uncertainties are discussed more fully in our
Quarterly Report on Form 10-Q for the quarter ended January 31, 2025 and in Item 1A of our Annual Report on Form 10-K for the year ended
July 31, 2024.
We disclaim any obligation or undertaking to disseminate any updates or
revisions to any forward-looking statements contained in this release or to reflect any change in our expectations after the date hereof
or any change in events, conditions or circumstances on which any statement is based, except as required by law.
16
v3.25.0.1
| X |
- DefinitionBoolean flag that is true when the XBRL content amends previously-filed or accepted submission.
| Name: |
dei_AmendmentFlag |
| Namespace Prefix: |
dei_ |
| Data Type: |
xbrli:booleanItemType |
| Balance Type: |
na |
| Period Type: |
duration |
|
| X |
- DefinitionFor the EDGAR submission types of Form 8-K: the date of the report, the date of the earliest event reported; for the EDGAR submission types of Form N-1A: the filing date; for all other submission types: the end of the reporting or transition period. The format of the date is YYYY-MM-DD.
| Name: |
dei_DocumentPeriodEndDate |
| Namespace Prefix: |
dei_ |
| Data Type: |
xbrli:dateItemType |
| Balance Type: |
na |
| Period Type: |
duration |
|
| X |
- DefinitionThe type of document being provided (such as 10-K, 10-Q, 485BPOS, etc). The document type is limited to the same value as the supporting SEC submission type, or the word 'Other'.
| Name: |
dei_DocumentType |
| Namespace Prefix: |
dei_ |
| Data Type: |
dei:submissionTypeItemType |
| Balance Type: |
na |
| Period Type: |
duration |
|
| X |
- DefinitionAddress Line 1 such as Attn, Building Name, Street Name
| Name: |
dei_EntityAddressAddressLine1 |
| Namespace Prefix: |
dei_ |
| Data Type: |
xbrli:normalizedStringItemType |
| Balance Type: |
na |
| Period Type: |
duration |
|
| X |
- Definition
+ References
+ Details
| Name: |
dei_EntityAddressCityOrTown |
| Namespace Prefix: |
dei_ |
| Data Type: |
xbrli:normalizedStringItemType |
| Balance Type: |
na |
| Period Type: |
duration |
|
| X |
- DefinitionCode for the postal or zip code
| Name: |
dei_EntityAddressPostalZipCode |
| Namespace Prefix: |
dei_ |
| Data Type: |
xbrli:normalizedStringItemType |
| Balance Type: |
na |
| Period Type: |
duration |
|
| X |
- DefinitionName of the state or province.
| Name: |
dei_EntityAddressStateOrProvince |
| Namespace Prefix: |
dei_ |
| Data Type: |
dei:stateOrProvinceItemType |
| Balance Type: |
na |
| Period Type: |
duration |
|
| X |
- DefinitionA unique 10-digit SEC-issued value to identify entities that have filed disclosures with the SEC. It is commonly abbreviated as CIK. Reference 1: http://www.xbrl.org/2003/role/presentationRef
-Publisher SEC
-Name Exchange Act
-Number 240
-Section 12
-Subsection b-2
| Name: |
dei_EntityCentralIndexKey |
| Namespace Prefix: |
dei_ |
| Data Type: |
dei:centralIndexKeyItemType |
| Balance Type: |
na |
| Period Type: |
duration |
|
| X |
- DefinitionIndicate if registrant meets the emerging growth company criteria. Reference 1: http://www.xbrl.org/2003/role/presentationRef
-Publisher SEC
-Name Exchange Act
-Number 240
-Section 12
-Subsection b-2
| Name: |
dei_EntityEmergingGrowthCompany |
| Namespace Prefix: |
dei_ |
| Data Type: |
xbrli:booleanItemType |
| Balance Type: |
na |
| Period Type: |
duration |
|
| X |
- DefinitionCommission file number. The field allows up to 17 characters. The prefix may contain 1-3 digits, the sequence number may contain 1-8 digits, the optional suffix may contain 1-4 characters, and the fields are separated with a hyphen.
| Name: |
dei_EntityFileNumber |
| Namespace Prefix: |
dei_ |
| Data Type: |
dei:fileNumberItemType |
| Balance Type: |
na |
| Period Type: |
duration |
|
| X |
- DefinitionTwo-character EDGAR code representing the state or country of incorporation.
| Name: |
dei_EntityIncorporationStateCountryCode |
| Namespace Prefix: |
dei_ |
| Data Type: |
dei:edgarStateCountryItemType |
| Balance Type: |
na |
| Period Type: |
duration |
|
| X |
- DefinitionThe exact name of the entity filing the report as specified in its charter, which is required by forms filed with the SEC. Reference 1: http://www.xbrl.org/2003/role/presentationRef
-Publisher SEC
-Name Exchange Act
-Number 240
-Section 12
-Subsection b-2
| Name: |
dei_EntityRegistrantName |
| Namespace Prefix: |
dei_ |
| Data Type: |
xbrli:normalizedStringItemType |
| Balance Type: |
na |
| Period Type: |
duration |
|
| X |
- DefinitionThe Tax Identification Number (TIN), also known as an Employer Identification Number (EIN), is a unique 9-digit value assigned by the IRS. Reference 1: http://www.xbrl.org/2003/role/presentationRef
-Publisher SEC
-Name Exchange Act
-Number 240
-Section 12
-Subsection b-2
| Name: |
dei_EntityTaxIdentificationNumber |
| Namespace Prefix: |
dei_ |
| Data Type: |
dei:employerIdItemType |
| Balance Type: |
na |
| Period Type: |
duration |
|
| X |
- DefinitionLocal phone number for entity.
| Name: |
dei_LocalPhoneNumber |
| Namespace Prefix: |
dei_ |
| Data Type: |
xbrli:normalizedStringItemType |
| Balance Type: |
na |
| Period Type: |
duration |
|
| X |
- DefinitionBoolean flag that is true when the Form 8-K filing is intended to satisfy the filing obligation of the registrant as pre-commencement communications pursuant to Rule 13e-4(c) under the Exchange Act. Reference 1: http://www.xbrl.org/2003/role/presentationRef
-Publisher SEC
-Name Exchange Act
-Number 240
-Section 13e
-Subsection 4c
| Name: |
dei_PreCommencementIssuerTenderOffer |
| Namespace Prefix: |
dei_ |
| Data Type: |
xbrli:booleanItemType |
| Balance Type: |
na |
| Period Type: |
duration |
|
| X |
- DefinitionBoolean flag that is true when the Form 8-K filing is intended to satisfy the filing obligation of the registrant as pre-commencement communications pursuant to Rule 14d-2(b) under the Exchange Act. Reference 1: http://www.xbrl.org/2003/role/presentationRef
-Publisher SEC
-Name Exchange Act
-Number 240
-Section 14d
-Subsection 2b
| Name: |
dei_PreCommencementTenderOffer |
| Namespace Prefix: |
dei_ |
| Data Type: |
xbrli:booleanItemType |
| Balance Type: |
na |
| Period Type: |
duration |
|
| X |
- DefinitionTitle of a 12(b) registered security. Reference 1: http://www.xbrl.org/2003/role/presentationRef
-Publisher SEC
-Name Exchange Act
-Number 240
-Section 12
-Subsection b
| Name: |
dei_Security12bTitle |
| Namespace Prefix: |
dei_ |
| Data Type: |
dei:securityTitleItemType |
| Balance Type: |
na |
| Period Type: |
duration |
|
| X |
- DefinitionName of the Exchange on which a security is registered. Reference 1: http://www.xbrl.org/2003/role/presentationRef
-Publisher SEC
-Name Exchange Act
-Number 240
-Section 12
-Subsection d1-1
| Name: |
dei_SecurityExchangeName |
| Namespace Prefix: |
dei_ |
| Data Type: |
dei:edgarExchangeCodeItemType |
| Balance Type: |
na |
| Period Type: |
duration |
|
| X |
- DefinitionBoolean flag that is true when the Form 8-K filing is intended to satisfy the filing obligation of the registrant as soliciting material pursuant to Rule 14a-12 under the Exchange Act. Reference 1: http://www.xbrl.org/2003/role/presentationRef
-Publisher SEC
-Name Exchange Act
-Section 14a
-Number 240
-Subsection 12
| Name: |
dei_SolicitingMaterial |
| Namespace Prefix: |
dei_ |
| Data Type: |
xbrli:booleanItemType |
| Balance Type: |
na |
| Period Type: |
duration |
|
| X |
- DefinitionTrading symbol of an instrument as listed on an exchange.
| Name: |
dei_TradingSymbol |
| Namespace Prefix: |
dei_ |
| Data Type: |
dei:tradingSymbolItemType |
| Balance Type: |
na |
| Period Type: |
duration |
|
| X |
- DefinitionBoolean flag that is true when the Form 8-K filing is intended to satisfy the filing obligation of the registrant as written communications pursuant to Rule 425 under the Securities Act. Reference 1: http://www.xbrl.org/2003/role/presentationRef
-Publisher SEC
-Name Securities Act
-Number 230
-Section 425
| Name: |
dei_WrittenCommunications |
| Namespace Prefix: |
dei_ |
| Data Type: |
xbrli:booleanItemType |
| Balance Type: |
na |
| Period Type: |
duration |
|
Thor Industries (NYSE:THO)
Historical Stock Chart
From Feb 2025 to Mar 2025

Thor Industries (NYSE:THO)
Historical Stock Chart
From Mar 2024 to Mar 2025
