With the global economy sputtering, some key commodities have
been hard hit. Oil has been especially victimized, thanks to its
high correlation with economic activity, and increasing dependence
on emerging markets to generate more demand for the important
product.
Thanks to these trends, the past few months have been a pretty
rough time for both crude oil and oil stocks/ETFs that target the
space. In fact, the price of WTI crude fell from about $108/bbl. at
the beginning of May to a low of just under $80/bbl. in late June,
although it has managed to rebound just a bit since then.
This collapse in oil prices hit a number of companies in the oil
producing segment quite hard in the end of the second quarter of
the year. In one six week stretch in the time period, the
Energy Select Sector SPDR (XLE) was actually down over
10.5%, underscoring just how rough trading had become for the
segment.
Yet while many investors were quite disappointed with these
returns, those who were in other corners of the oil market saw even
bigger losses in the time frame. Funds and stocks targeting oil
services, drilling, and exploration were down more than 15% in a
similar period, suggesting that the rough trading in oil hit the
more volatile corners of the hydrocarbon equity market pretty
hard.
Prices have come back in recent weeks across the oil market
though, as more worries over the Middle East are plaguing the space
while there is more hope for the domestic market too. End of year
spending looks to be decent while consumer confidence is high,
suggesting that more could be bullish about the economy leading to
more economic activity—and oil use—heading into 2013.
Given this, for oil bulls, it could be time to consider cycling
back into the equity side of the space in hopes of solid run up to
close out the year. Arguably the best way to do this could be via
some of the hardest hit segments in recent weeks, namely the oil
services space.
This corner has—in my opinion—been unfairly beaten down despite
the solid fundamentals underlying the space. After all, it should
be noted that drilling volume is on the rise and more production is
taking place across the world, giving oil service firms plenty of
opportunities to cash in on the boom (Read Three ETFs for the
Unconventional Oil Revolution).
However, it should be noted that many of the funds in this
space, and even the broad energy sector at large, don’t really have
favorable Zacks ETF Ranks at this time. In fact, XLE has a Rank of
3, or ‘Hold’ suggesting a neutral outlook for the broad space.
With that being said, it is important to remember that the Zacks
ETF Rank is designed for a relatively long time period and not just
the next few months. Thanks to this, some investors might want to
consider temporarily cycling into oil services, at least in the
short term, before pushing back out of the segment if oil fails to
hold strong above $85 (read Time to Buy Oil and Gas Services
ETFs?).
Clearly, the segment is one of the more volatile in the oil
industry and can be hard hit when prices are slumping, suggesting
that caution must be taken when looking at the sector. Yet for
those with a short time horizon and a belief that
oil can continue to rebound in the next few months, any of the
following four ETFs could be interesting picks to close out the
quarter:
Market Vectors Oil Services ETF (OIH)
OIH is by far the most popular and liquid choice in the oil
service space, tracking the Market Vectors US Listed Oil Services
25 Index. With this focus, the fund has just over 4.7 million
shares in volume a day and AUM of just over $1.25 billion.
The fund holds about 25 securities in its basket, giving heavy
weights to Schlumberger (SLB), National Oilwell Varco (NOV), and
Halliburton (HAL). This gives the fund a roughly 70% allocation to
the U.S., but decent international exposure of 13% to Switzerland,
and then another 15% combined to the United Kingdom and the
Netherlands (read Three ETFs for an Iranian Crisis).
Over the past month, OIH has lost about 10.2%, falling much
further than oil or the broad energy space, suggesting an oversold
situation. The fund currently has a Zacks ETF Rank of 3, or ‘Hold’
suggesting a performance in line with broader markets over the next
year.
iShares Dow Jones US Oil Equipment & Services ETF
(IEZ)
For another pretty popular way to target the space, investors
have iShares’ IEZ which follows the Dow Jones US Select Oil
Equipment & Services index. This benchmark tracks the US
segment of the market including firms that provide equipment or
services to oil fields and offshore platforms, such as drilling,
exploration, and a variety of other related segments
Top holdings in this fund include a nearly 20% weighting to SLB,
and then an 8.79% allocation to NOV and an 8.3% weight to HAL. IEZ
is pretty much entirely focused on the North American market,
although large caps account for just 55% of the total exposure in
the fund.
In terms of performance, IEZ has lost about 7.1% in the past
month, giving it a roughly 16.8% loss YTD, suggesting once more
that it could be oversold. Investors should note that the fund
currently has a Zacks ETF Rank of 3 or ‘Hold’ so it could continue
have an uncertain outlook once we get into 2013.
SPDR S&P Oil & Gas Equipment & Services ETF
(XES)
State Street’s entrant in the space tracks the S&P Oil &
Gas Equipment & Services Select Industry Index. This benchmark
is a modified equal weight index, ensuring that no one firm
dominates the fund’s risk/return profile (see Oil Bull Market is No
Place for MLP ETF Investors).
With this focus, the fund holds about 40 securities in its
basket putting a heavy focus on American stocks. In terms of
capitalization levels, large caps account for just 20% of assets
leaving more than 50% of the ETF for small and micro caps.
This ETF is also a low cost fund, charging investors just 35
basis points a year in fees. Furthermore, the performance has been
relatively decent in the trailing one month period, as it is down
about 6.4%, although the YTD look has the fund at a roughly 18.8%
loss. Due in part to this, the fund has a Zacks Rank of 3
suggesting it could perform in line with others in the space over
the next 12 months.
PowerShares Dynamic Oil & Gas Services
(PXJ)
The last choice investors have in the space targets a slightly
more ‘active’ index, the Dynamic Oil Services Intellidex Benchmark.
This index evaluates companies on a host of investment criteria
including growth, valuation, timeliness, and risk factors.
This produces a fund that has roughly 30 securities in its
basket although costs are somewhat higher at 63 basis points a year
in fees. The approach also ensures that a few companies do not
dominate the fund as large caps account for just over one-quarter
of the total, and small/micro caps make up roughly half of the fund
(see Invest Like Warren Buffett with These ETFs).
Meanwhile, top holdings include an interesting mix, as
Oceaneering takes the top spot at 5.3% of assets, while it is
closely trailed by Diamond Offshore Drilling and Cameron
International each make up about 5.1% of assets as well. In fact,
no one company makes up less than 2% of the portfolio suggesting a
very well spread out risk return profile.
In terms of performance, had lost a more respectable 6%% in the
past one month period, although it is down in line with the others
in the space from a year-to-date look. Still, the Zacks ETF Rank is
a little more bearish as the fund has a rank of 4 or ‘Sell’,
meaning that it could be rough going in this fund when compared to
others in the space over longer time periods.
Want the latest recommendations from Zacks Investment Research?
Today, you can download 7 Best Stocks for the Next 30
Days. Click to get this free report >>
HALLIBURTON CO (HAL): Free Stock Analysis Report
ISHARS-DJ OIL E (IEZ): ETF Research Reports
MKT VEC-OIL SVC (OIH): ETF Research Reports
PWRSH-DYN OIL&G (PXJ): ETF Research Reports
SCHLUMBERGER LT (SLB): Free Stock Analysis Report
SPDR-SP O&G EQP (XES): ETF Research Reports
To read this article on Zacks.com click here.
Zacks Investment Research
Want the latest recommendations from Zacks Investment Research?
Today, you can download 7 Best Stocks for the Next 30 Days. Click
to get this free report
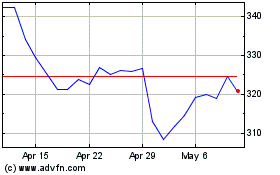
VanEck Oil Services ETF (AMEX:OIH)
Historical Stock Chart
From Nov 2024 to Dec 2024

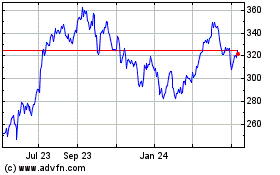
VanEck Oil Services ETF (AMEX:OIH)
Historical Stock Chart
From Dec 2023 to Dec 2024
