OMNI-LITE INDUSTRIES REPORTS FIRST QUARTER 2011 RESULTS
July 04 2011 - 2:13PM
PR Newswire (Canada)
CERRITOS, CA, July 4, 2011 /CNW/ -- OML-TSX VENTURE CERRITOS, CA,
July 4, 2011 /CNW/ - For the period ended March 31, 2011, Omni-Lite
Industries Canada Inc. is pleased to announce that revenue was
$1,482,314 US. Cash flow was $637,813 US. Net income was $307,899.
Earnings per share were $0.03 US per share. "This is a very
productive time at Omni-Lite with key brake, battery, and military
programs all going ahead simultaneously. These future revenue
streams should have a very positive effect on the growth of the
Company," stated David F. Grant, CEO. "As an example, the
revenue in the second quarter was $2,131,000 US, a 44% increase
from Q1 2011." Highlighting the quarter were the following events:
1) For the first time in the Company's recent history, gross
margins were affected by large orders of a product that provides
one of the lowest margins in the Company's inventory of products.
Sales of these products approached 150 percent of typical first
quarter sales and drove the contribution of that division from 11
percent of revenue in 2010 to 22 percent of revenue in 2011. These
sales portend a strong year in this division overall. While these
sales have continued at record pace in the second quarter of 2011,
the Company's financial model indicates that margins should return
to historical levels in the near future as the product mix changes
in subsequent quarters. 2) The transition to International
Financial Reporting Standards (IFRS). While Omni-Lite was not
severely affected by this change, the planning and preparation for
this event took significant Company resources. In addition,
Omni-Lite has had its Q1 balance sheet reviewed to IFRS and as a
result does not foresee additional resources devoted to the IFRS
transition. Because of the balance sheet audit, Omni-Lite has
delayed releasing the first quarter results by approximately 30
days, a delay which was approved by the TSX Venture Exchange to
assist all issuers in the transition to IFRS. 3) The earnings per
share numbers were affected by the financing completed in February
2011. The weighted average number of shares increased by about 11
percent in Q1 2011 over Q1 2010. 4) The Company's revenue was
partially affected by the reduction in orders for one military
program pending the replacement product currently in the final
approval stage. The Company expects to be in production with the
new component in third quarter of 2011. Financial Highlights
Revenue: For the period ended March 31, 2011, Omni-Lite reported
revenue of $1,482,314 ($1,441,150 CDN), a decrease of 19 percent
from the prior period in 2010. The Automotive division represented
the largest portion of sales with 27 percent of revenue. Sales in
this division were higher by 47 percent when compared to the period
ended March 31, 2010. The Military division contributed 26
percent of revenue, a 65 percent decrease from 2010. The
Aerospace division contributed 24 percent of revenue, an increase
of 8 percent from the same period in 2010. The Sports and
Recreation division contributed 22 percent of revenue, a 150
percent increase from 2010. The Commercial divisions provided
1 percent of the revenue. Sales by division and by geographic
location are summarized below: Division/ Sport & Segments
Military Aerospace Recreation Automotive Commercial Q1 2011 26% 24%
22% 27% 1% Q1 2010 59% 18% 7% 15% 1% Net Income: Net income was
$307,899 ($299,349 CDN) versus $484,087 in 2010, a decrease of 36
percent. A decrease in military revenue was largely
responsible for the reduction in revenue and income in the first
quarter of 2011 as compared with 2010. Earnings per share: Basic
earnings per share were $0.03 ($0.03 CDN) compared to $0.05 ($0.05
CDN) in 2010 based on the weighted average number of shares
outstanding of 11,769,089. The actual number of shares outstanding
was 13,419,166. The weighted average number of shares
increased approximately 11 percent over the first quarter of the
prior year. Under the Normal Course Issuer Bid, 34,700 shares
were repurchased for cancellation. SUMMARY OF FINANCIAL HIGHLIGHTS
(US $) All figures in US dollars unless noted.
____________________________________________________________________
|Basic Weighted Average |For the period|For the period | % |
|Shares Issued And | ended | ended |Increase | |Outstanding:
11,769,089 |March 31, 2011|March 31, 2010 |(Decrease)|
|__________________________|______________|_______________|__________|
|Revenue | $1,482,314 | $1,834,076 | (19%) |
|__________________________|______________|_______________|__________|
|Cash flow from operations(| | | | |(2)) | 637,813 | 768,309 |
(17%) |
|__________________________|______________|_______________|__________|
|Net Income | 307,899 | 484,087 | (38%) |
|__________________________|______________|_______________|__________|
|EPS (US) | 0.03 | 0.05 | (44%) |
|__________________________|______________|_______________|__________|
|EPS (CDN) | 0.03 | 0.05 | (47%) |
|__________________________|______________|_______________|__________|
(Note: at 3/31/11, $1US = $0.9722 CDN; 3/31/10, $1US = $1.0192 CDN)
((2) ) Cash flow from operations is a non-GAAP term requested by
the oil and gas investment community that represents net earnings
adjusted for non-cash items including depreciation, depletion and
amortization, future income taxes, asset write-downs and gains
(losses) on sale of assets, if any. Quarterly Information The
following table summarizes the Company's financial performance over
the last eight quarters. All figures in US dollars unless noted.
ALL FIGURES IN US DOLLARS UNLESS NOTED
__________________________________________________________________________________________
| | Mar | Dec | Sep | Jun | Mar | Dec | Sept | Jun | | | 31/2011 |
31/2010 | 30/2010 | 30/2010 | 31/2010 | 31/2009 | 30/2009 | 30/2009
|
|__________|_________|_________|_________|_________|_________|_________|_________|_________|
|Revenue
|1,482,314|1,126,037|1,720,995|2,439,705|1,834,076|1,175,516|1,084,771|1,151,296|
|__________|_________|_________|_________|_________|_________|_________|_________|_________|
|Cash Flow | | | | | | | | | |from | | | | | | | | | |Operations| |
| | | | | | | |((2)) | 637,813 | 523,347 | 881,838 |1,005,306|
768,309 | 429,416 | 314,077 | 395,702 |
|__________|_________|_________|_________|_________|_________|_________|_________|_________|
|Net Income| 307,899 | 220,290 | 427,806 | 687,889 | 484,087 |
83,011 | 95,078 | 170,322 |
|__________|_________|_________|_________|_________|_________|_________|_________|_________|
|EPS - | .026 | .017 | .048 | .066 | .045 | .008 | .009 | .016 |
|basic (US)| | | | | | | | |
|__________|_________|_________|_________|_________|_________|_________|_________|_________|
|EPS - | .025 | .017 | .048 | .067 | .045 | .008 | .009 | .016 |
|basic | | | | | | | | | |(CDN) | | | | | | | | |
|__________|_________|_________|_________|_________|_________|_________|_________|_________|
|EPS - | .026 | .016 | .047 | .066 | .045 | .008 | .009 | .016 |
|diluted | | | | | | | | | |(US) | | | | | | | | |
|__________|_________|_________|_________|_________|_________|_________|_________|_________|
|EPS - | .025 | .016 | .047 | .067 | .045 | .008 | .009 | .016 |
|diluted | | | | | | | | | |(CDN) | | | | | | | | |
|__________|_________|_________|_________|_________|_________|_________|_________|_________|
((2) ) Cash flow from operations is a non-GAAP term requested by
the oil and gas investment community that represents net earnings
adjusted for non-cash items including depreciation, depletion and
amortization, future income taxes, asset write-downs and gains
(losses) on sale of assets, if any. For complete results, please
visit www.sedar.com or request a copy from the Company. Omni-Lite
is a rapidly growing high technology company that develops and
manufactures precision components utilized by several Fortune 500
companies including Boeing, Airbus, Alcoa, Ford, Caterpillar, Borg
Warner, Chrysler, the U.S. Military, Nike, and adidas. Except for
historical information contained herein this document contains
forward-looking statements. These statements contain known and
unknown risks and uncertainties that may cause the Company's actual
results or outcomes to be materially different from those
anticipated and discussed herein. THE TSX-VENTURE EXCHANGE NEITHER
APPROVES NOR DISAPPROVES OF THE INFORMATION CONTAINED HEREIN.
To view this news release in HTML formatting, please use the
following URL:
http://www.newswire.ca/en/releases/archive/July2011/04/c3078.html p
align="justify" Mr. Tim Wang, CFObr/ Tel. No. (562) 404-8510
or (800) 577-6664 (Canada and USA)br/ Fax. No. (562) 926-6913,
email: a cr="true"
href="mailto:info@omni-lite.com"info@omni-lite.com/a /p p
align="justify" Website: a
href="http://www.omni-lite.com"www.omni-lite.com/a /p
Copyright
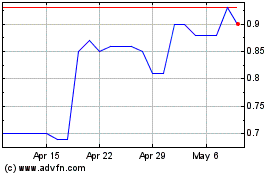
Omni Lite Industries Can... (TSXV:OML)
Historical Stock Chart
From Jun 2024 to Jul 2024

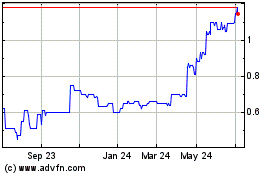
Omni Lite Industries Can... (TSXV:OML)
Historical Stock Chart
From Jul 2023 to Jul 2024
