ApeCoin Holds Steady At Key Level – Can A Rebound Follow?
October 31 2024 - 8:00PM
NEWSBTC
ApeCoin is holding steady at the crucial $1 support level, fueling
speculation on whether the bulls are ready for a comeback as it
maintains its position above this key mark. Recent bearish pressure
has driven the token to a point where a recovery might be on the
horizon, yet the critical question is: can buyers defend this level
and push prices higher? With momentum shifting and market sentiment
in flux, the scene is set for either a breakout on the upside or a
breakdown. This article aims to analyze ApeCoin’s resilience at a
critical support level, exploring whether current market dynamics
could spark a rebound. Through a breakdown of technical indicators
and recent price action, we seek to analyze the possibility of a
bullish reversal or signs of continued downward pressure on
ApeCoin. Technical Analysis: Signs Af A Rebound Or Breakdown? APE’s
price on the 4-hour chart is consolidating above the 100-day Simple
Moving Average (SMA) and the key $1 support level, indicating
market indecision. While the position above the SMA suggests an
optimistic trend, this consolidation could lead to a rally or
strong decline, depending on whether bulls or bears take control.
Meanwhile, the 4-hour Composite Trend Oscillator for ApeCoin shows
bearish signals, as its SMA line edges toward a crossover below the
signal lines near the zero level. This crossover attempt is
typically seen as a bearish indicator, suggesting that downside
momentum may be gaining steam. A successful crossover below the
signal lines could confirm a shift in trend, potentially signaling
more selling pressure on APE in the near term. Related Reading: Is
Apecoin On Your Radar? APE Soars By 30% In 48 Hours, Signaling A
Potential Bull Run On the daily chart, APE is in a consolidation
phase while showing downbeat strength as it nears the $1 mark.
Although it trades above the 100-day SMA, the increasing selling
pressure raises concerns about its ability to stay above the $1
level. This combination of consolidation and bearish momentum could
indicate a struggle to maintain its position, potentially leading
to a decline if the bearish trend continues. A detailed analysis of
the 1-day Composite Trend Oscillator shows that ApeCoin is
overbought, indicating possible extended losses. The signal line is
attempting to cross below the SMA line, which usually signals a
shift in momentum toward the downside and increasing selling
pressure. If this crossover happens, it could reinforce the
likelihood of continued declines, leading traders to reconsider
their positions amid the weakening bullish sentiment. Risk Vs.
Reward: What’s Next For ApeCoin? Based on the analysis, ApeCoin’s
price appears poised for a drop toward the $1 support level. A
breakdown below this mark could lead to additional losses for the
cryptocurrency, which could push it down to the $0.660 support
level and beyond. Related Reading: ApeCoin Climbs 21% In Last 7
Days As Sentiment Remains Bullish However, if ApeCoin breaks above
the $1 mark, the price is likely to move upward toward the $1.7
resistance level. Furthermore, a breach of this level could trigger
further upward movement, potentially leading to the $2.1 resistance
level and beyond. Featured image from Medium, chart from
Tradingview.com
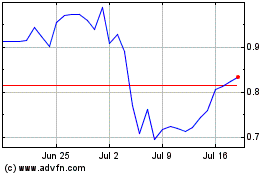
ApeCoin (COIN:APEUSD)
Historical Stock Chart
From Feb 2025 to Mar 2025

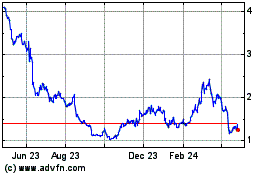
ApeCoin (COIN:APEUSD)
Historical Stock Chart
From Mar 2024 to Mar 2025
