false
0001543151
0001543151
2024-02-06
2024-02-06
iso4217:USD
xbrli:shares
iso4217:USD
xbrli:shares
UNITED
STATES
SECURITIES AND EXCHANGE COMMISSION
Washington,
D.C. 20549
_______________________________________________
FORM
8-K
_______________________________________________
CURRENT
REPORT
Pursuant
to Section 13 or 15(d)
of the
Securities Exchange Act of 1934
Date
of Report (Date of earliest event reported): February 6, 2024
_______________________________________________
UBER
TECHNOLOGIES, INC.
(Exact
name of registrant as specified in its charter)
_______________________________________________
| Delaware |
001-38902 |
45-2647441 |
| (State
or other jurisdiction of incorporation or organization) |
(Commission
File Number) |
(I.R.S.
Employer Identification No.) |
1725 Third Street
San Francisco,
California 94158
(Address
of principal executive offices, including zip code)
(415) 612-8582
(Registrant’s
telephone number, including area code)
Not Applicable
(Former
name or former address, if changed since last report)
_______________________________________________
Check
the appropriate box below if the Form 8-K filing is intended to simultaneously satisfy the filing obligation of the registrant
under any of the following provisions:
| ☐ |
Written
communications pursuant to Rule 425 under the Securities Act (17 CFR 230.425) |
| ☐ |
Soliciting
material pursuant to Rule 14a-12 under the Exchange Act (17 CFR 240.14a-12) |
| ☐ |
Pre-commencement
communications pursuant to Rule 14d-2(b) under the Exchange Act (17 CFR 240.14d-2(b)) |
| ☐ |
Pre-commencement
communications pursuant to Rule 13e-4(c) under the Exchange Act (17 CFR 240.13e-4(c)) |
Securities
registered pursuant to Section 12(b) of the Act:
| Title of each class |
|
Trading
Symbol(s) |
|
Name of each exchange
on which registered |
| Common
Stock, par value $0.00001 per share |
|
UBER |
|
New
York Stock Exchange |
Indicate
by check mark whether the registrant is an emerging growth company as defined in in Rule 405 of the Securities Act of 1933 (17
CFR §230.405) or Rule 12b-2 of the Securities Exchange Act of 1934 (17 CFR §240.12b-2). Emerging growth company
☐
If
an emerging growth company, indicate by check mark if the registrant has elected not to use the extended transition period for
complying with any new or revised financial accounting standards provided pursuant to Section 13(a) of the Exchange Act. ☐
Item 7.01 Regulation
FD Disclosure.
Share
Repurchase Authorization
On
February 6, 2024, the Board of Directors of Uber Technologies, Inc. (the “Company”) authorized the repurchase of up
to $7,000,000,000 in shares of the Company’s outstanding common stock. The timing, manner, price and amount of any repurchases
are determined by the discretion of management, depending
on market conditions and other factors. Repurchases may be made through open market purchases and accelerated share repurchases.
The exact number of shares to be repurchased by the Company, if any, is not guaranteed. Depending on market conditions
and other factors, these repurchases may be commenced or suspended at any time or periodically without prior notice.
A
copy of a press release issued to announce the repurchase authorization is furnished as Exhibit 99.1 to this report and is herein
incorporated herein by reference into this Item 7.01.
Investor
Update Presentation
On
February 14, 2024, the Company presented information regarding the Company’s financial and operational outlook and capital
allocation model. This investor update presentation is
furnished as Exhibit 99.1 to this report and is hereby incorporated by reference into this Item 7.01.
Over
the next three years, the Company expects:
| · | Gross
Bookings growth in the mid to high teens (CAGR) |
| · | Adjusted
EBITDA growth in the high 30s to 40% (CAGR) |
| · | Free
cash flow as a percentage of Adjusted EBITDA to be 90% or higher annually |
The information set forth under
this Item 7.01, including Exhibit 99.1, and Exhibit 99.2, is being furnished and shall not be deemed “filed” for purposes
of Section 18 of the Securities Exchange Act of 1934, as amended (the “Exchange Act”) or otherwise subject to the
liabilities of that section, nor shall it be deemed incorporated by reference in any filing under the Securities Act of 1933,
as amended, or the Exchange Act, regardless of any general incorporation language in such filing, except as otherwise expressly
stated in such filing.
Forward-Looking
Statements
This
Form 8-K contains forward-looking statements regarding our future business expectations which involve risks and uncertainties.
Actual results may differ materially from the results predicted, and reported results should not be considered as an indication
of future performance. Forward-looking statements include all statements that are not historical facts and can be identified by
terms such as “anticipate,” “believe,” “contemplate,” “continue,” “could,”
“estimate,” “expect,” “hope,” “intend,” “may,” “might,”
“objective,” “ongoing,” “plan,” “potential,” “predict,” “project,”
“should,” “target,” “will,” or “would” or similar expressions and the negatives
of those terms. Forward-looking statements involve known and unknown risks, uncertainties and other factors that may cause our
actual results, performance or achievements to be materially different from any future results, performance or achievements expressed
or implied by the forward-looking statements. These risks, uncertainties and other factors relate to, among others: competition,
managing our growth and corporate culture, financial performance, investments in new products or offerings, our ability to attract
drivers, consumers and other partners to our platform, our brand and reputation and other legal and regulatory developments, particularly
with respect to our relationships with drivers and couriers and the impact of the global economy, including rising inflation and
interest rates. For additional information on other potential risks and uncertainties that could cause actual results to differ
from the results predicted, please see our Annual Report on Form 10-K for the year ended December 31, 2022 and subsequent quarterly
reports and other filings filed with the Securities and Exchange Commission from time to time. All information provided in this
release and in the attachments is as of the date of this press release and any forward-looking statements contained herein are
based on assumptions that we believe to be reasonable as of this date. Undue reliance should not be placed on the forward-looking
statements in this press release, which are based on information available to us on the date hereof. We undertake no duty to update
this information unless required by law.
Non-GAAP
Financial Measures
To
supplement our financial information, which is prepared and presented in accordance with generally accepted accounting principles
in the United States of America (“GAAP”), we use the following non-GAAP financial measures: Adjusted EBITDA growth;
Free Cash Flow and Free Cash Flow as a percentage of Adjusted EBITDA. The presentation of this financial information in this Current
Report on Form 8-K is not intended to be considered in isolation or as a substitute for, or superior to, the financial information
prepared and presented in accordance with GAAP. We use these non-GAAP financial measures for financial and operational decision-making
and as a means to evaluate period-to-period comparisons. We believe that these non-GAAP financial measures provide meaningful
supplemental information regarding our performance by excluding certain items that may not be indicative of our recurring core
business operating results.
We
believe that both management and investors benefit from referring to these non-GAAP financial measures in assessing our performance
and when planning, forecasting, and analyzing future periods. These non-GAAP financial measures also facilitate management’s
internal comparisons to our historical performance. We believe these non-GAAP financial measures are useful to investors both
because (1) they allow for greater transparency with respect to key metrics used by management in its financial and operational
decision-making and (2) they are used by our institutional investors and the analyst community to help them analyze the health
of our business.
There
are a number of limitations related to the use of non-GAAP financial measures. In light of these limitations, we provide specific
information regarding the GAAP amounts excluded from these non-GAAP financial measures and evaluating these non-GAAP financial
measures together with their relevant financial measures in accordance with GAAP.
For
more information on these non-GAAP financial measures, please see the sections titled “Key Terms for Our Key Metrics and
Non-GAAP Financial Measures” and “Definitions of Non-GAAP Measures” included in our annual report on Form 10-K
for the fiscal year ended December 31, 2022 and our subsequent SEC filings. We are not able to reconcile the forward-looking non-GAAP
Adjusted EBITDA growth, Free Cash Flow or Free Cash Flow as a percentage of Adjusted EBITDA to the closest corresponding GAAP
measure without unreasonable efforts because we are unable to predict the ultimate outcome of certain significant items. These
items include, but are not limited to, significant legal settlements, unrealized gains and losses on equity investments, tax and
regulatory reserve changes, restructuring costs and acquisition and financing related impacts.
Item 9.01 Financial
Statements and Exhibits.
(d)
Exhibits
| 104.1 | Cover
page interactive data file (embedded within the Inline XBRL document). |
SIGNATURE
Pursuant
to the requirements of the Securities Exchange Act of 1934, the registrant has duly caused this report to be signed on its behalf
by the undersigned hereunto duly authorized.
| |
UBER
TECHNOLOGIES, INC. |
| |
|
| Date:
February 14, 2024 |
By:
/s/ Dara Khosrowshahi |
| |
Dara
Khosrowshahi |
| |
Chief
Executive Officer |
Exhibit 99.1
Uber
Announces Inaugural $7 Billion Share Repurchase Authorization
SAN FRANCISCO--Uber Technologies,
Inc. (NYSE: UBER) today announced that its Board of Directors has authorized the repurchase of up to $7 billion of the company’s
common stock.
“Today’s authorization
of our first-ever share repurchase program is a vote of confidence in the company’s strong financial momentum. We will be
thoughtful as it relates to the pace of our buyback, beginning with actions that partially offset stock-based compensation, and
working towards a consistent reduction in share count,” said Prashanth Mahendra-Rajah, CFO.
Uber will also host its previously
announced virtual Investor Update today at 5:00 a.m. Pacific Time (8:00 a.m. Eastern Time), where the company’s executive
leadership team will present an updated view of the company’s strategy, financial framework, and capital allocation plans,
followed by Q&A. A link for the live webcast and the accompanying materials are now available on Uber’s Investor Relations
website at investor.uber.com.
About Uber
Uber’s mission is to create
opportunity through movement. We started in 2010 to solve a simple problem: how do you get access to a ride at the touch of a
button? More than 47 billion trips later, we’re building products to get people closer to where they want to be. By changing how
people, food, and things move through cities, Uber is a platform that opens up the world to new possibilities.
Forward-Looking Statements
This press release contains
forward-looking statements regarding our future business expectations which involve risks and uncertainties. Actual results may
differ materially from the results predicted, and reported results should not be considered as an indication of future performance.
Forward-looking statements include all statements that are not historical facts and can be identified by terms such as “anticipate,”
“believe,” “contemplate,” “continue,” “could,” “estimate,” “expect,”
“hope,” “intend,” “may,” “might,” “objective,” “ongoing,”
“plan,” “potential,” “predict,” “project,” “should,” “target,”
“will,” or “would” or similar expressions and the negatives of those terms. Forward-looking statements
involve known and unknown risks, uncertainties and other factors that may cause our actual results, performance or achievements
to be materially different from any future results, performance or achievements expressed or implied by the forward-looking statements.
These risks, uncertainties and other factors relate to, among others: competition, managing our growth and corporate culture,
financial performance, investments in new products or offerings, our ability to attract drivers, consumers and other partners
to our platform, our brand and reputation and other legal and regulatory developments, particularly with respect to our relationships
with drivers and couriers and the impact of the global economy, including rising inflation and interest rates. For additional
information on other potential risks and uncertainties that could cause actual results to differ from the results predicted, please
see our most recent quarterly report on Form 10-Q for the quarter ended September 30, 2023 and subsequent annual reports, quarterly
reports and other filings filed with the Securities and Exchange Commission from time to time. All information provided in this
release and in the attachments is as of the date of this press release and any forward-looking statements contained herein are
based on assumptions that we believe to be reasonable as of this date. Undue reliance should not be placed on the forward-looking
statements in this press release, which are based on information available to us on the date hereof. We undertake no duty to update
this information unless required by law.
Investors and Analysts:
investor@uber.com
Press:
press@uber.com
Exhibit 99.2

INVESTO R UPDATE February 2024

2 Investor Update This presentation contains forward - looking statements regarding, among other things, our future business expectations, products, strategies and goals, including the future financial, strategic and operating performance of the Company. These forward - looking statements contained in this presentation are based on current expectations, estimates and as sumptions and are contingent on many factors, including, among other things, market conditions and the Company’s execution. Actual results may differ materially from the results predicted, and reported results sh ould not be considered as an indication of future performance. Forward - looking statements include all statements that are not historical facts and can be identified by terms such as “anticipate,” “believe,” “contemp lat e,” “continue,” “could,” “estimate,” “expect,” “hope,” “intend,” “may,” “might,” “objective,” “ongoing,” “plan,” “potential,” “predict,” “project,” “should,” “target,” “will,” or “would” or similar expressions and the negatives of th ose terms. Forward - looking statements involve known and unknown risks, uncertainties, and other factors that may cause our actual results, performance, or achievements to be materially different from any future results, p erf ormance, or achievements expressed or implied by the forward - looking statements. These risks, uncertainties, and other factors relate to, among others: competition; managing our growth and corporate culture ; f inancial performance, including our ability to attain and sustain profitability and our ability to attain and sustain positive cash flow; investments in new products or offerings; our ability to attract drivers, consumers, a nd other partners to our platform; our brand and reputation and other legal and regulatory developments and proceedings, particularly with respect to our relationships with drivers and couriers. In addition, other po ten tial risks and uncertainties that could cause actual results to differ from the results predicted include, among others, those risks and uncertainties included under the captions “Risk Factors” and “Management’s Discussion and Analysis of Financial Condition and Results of Operations” in our annual report on Form 10 - K for the year ended December 31, 2022, and subsequent annual reports, quarterly reports and other filings filed with the Sec urities and Exchange Commission from time to time. All information provided in this presentation is as of the date hereof and any forward - looking statements contained herein are based on assumptions that we belie ve to be reasonable as of such date. We undertake no duty to update this information unless required by law. Forward - Looking Statements Non - GAAP Financial Measures To supplement our financial information, which is prepared and presented in accordance with generally accepted accounting pri nci ples in the United States of America, or GAAP, we use the following non - GAAP financial measures: Adjusted EBITDA; Non - GAAP Costs and Operating Expenses; Free Cash Flow; as well as revenue growth rates in constant cu rrency. The presentation of this financial information is not intended to be considered in isolation or as a substitute for, or superior to, the financial information prepared and presented in accordanc e w ith GAAP. We use these non - GAAP financial measures for financial and operational decision - making and as a means to evaluate period - to - period comparisons. We believe that these non - GAAP financial measures provide meanin gful supplemental information regarding our performance by excluding certain items that may not be indicative of our recurring core business operating results. We believe that both management and investors be nef it from referring to these non - GAAP financial measures in assessing our performance and when planning, forecasting, and analyzing future periods. These non - GAAP financial measures also facilitate management’s interna l comparisons to our historical performance. We believe these non - GAAP financial measures are useful to investors both because (1) they allow for greater transparency with respect to key metrics used by man age ment in its financial and operational decision - making and (2) they are used by our institutional investors and the analyst community to help them analyze the health of our business. There are a number of limitations related to the use of non - GAAP financial measures. In light of these limitations we provide sp ecific information regarding the GAAP amounts excluded from these non - GAAP financial measures and evaluating these non - GAAP financial measures together with their relevant financial measures in accordance with GAA P. For more information on these non - GAAP financial measures, please see the section titled “Non - GAAP Reconciliations” included at the end of this presentation. In regards to forward looking non - GAAP guid ance and targets provided in this presentation, we are not able to reconcile the forward - looking non - GAAP Adjusted EBITDA or Free Cash Flow measures to the closest corresponding GAAP measure without unreasonable effo rts because we are unable to predict the ultimate outcome of certain significant items. These items include, but are not limited to significant legal settlements, unrealized gains and losses on equity inve stm ents, tax and regulatory reserve changes, restructuring costs and acquisition and financing related impacts.

3 Investor Update COMPANY OVERVIEW 3 3

4 Investor Update Committed to our mission We reimagine the way the world moves for the better 4 Investor Update Company Overview

Company Overview 5 Investor Update We’ve proven out our platform’s promise — and we’re just getting started 5 Investor Update 1. FY’18 is the first available full fiscal year data at the time of IPO 2. See Non - GAAP Reconciliations 150M Monthly Active Platform Consumers Q4’23 $138B Gross Bookings $4.1B Adjusted EBITDA² 2023 91M Monthly Active Platform Consumers Q4’18 $50B Gross Bookings ($1.8B) Adjusted EBITDA² 2023 IPO ¹ Company Overview

6 Investor Update An outstanding management team committed to relentless innovation and improvement Dara Khosrowshahi Chief Executive Officer Joined Uber in 2017 Prashanth Mahendra - Rajah Chief Financial Officer Joined Uber in 2023 Jill Hazelbaker Senior Vice President, Marketing & Public Affairs Joined Uber in 2015 Nikki Krishnamurthy Chief People Officer Joined Uber in 2018 Tony West Senior Vice President, Chief Legal Officer, and Corporate Secretary Joined Uber in 2017 Gus Fuldner Senior Vice President, Safety & Core Services Joined Uber in 2013 Pierre - Dimitri Gore - Coty Senior Vice President, Delivery Joined Uber in 2012 Albert Greenberg Vice President, Platform Engineering Joined Uber in 2021 Sundeep Jain Chief Product Officer and Senior Vice President, Engineering Joined Uber in 2018 Andrew Macdonald Senior Vice President, Mobility & Business Operations Joined Uber in 2012

Company Overview 7 Investor Update As we’ve scaled, our platform has shown enormous power Breadth of offerings with unmatched global scale Shared and compounding marketplace tech Operational excellence Renowned brand and differentiated membership program Consumer and earner impact Best - in - class experience Higher engagement Better retention Financial impact Faster time to market and ramp of new offerings Lower customer acquisition and tech costs Higher margins and investment returns

Company Overview 8 Investor Update Consumers are using more of our products and spending more on our platform 1. Consumers defined as the number of unique consumers in markets where we operate Mobility and Delivery who completed a Mobi lit y ride and/or received a Delivery order on our platform at least once in a given month, averaged over each month in the quarter 2. Multi - product consumers defined as active consumers in markets where we operate Mobility and Delivery who used two or more pr oducts (either within a line of business or across lines of businesses) in a given month, averaged over each month in the quarter 3. Single - product consumers defined as active consumers in markets where we operate Mobility and Delivery who used one product i n a given month, averaged over each month in the quarter More than a third of monthly consumers ¹ are multi - product ² Multi - product consumers spend over 3x more than single - product consumers ³ 3.0x 3.4x Q4’21 Q4’23 Average single - product consumer Average multi - product consumer 34% 21%

Company Overview 9 Investor Update Cross - promotion at scale drives efficiencies in CAC The Mobility and Delivery apps are meaningful channels of growth for one another We have a dedicated product team building our cross - promotion paths The cost of incremental acquisition is 50% that of paid channels 2 1. Markets where we operate Mobility and Delivery as of Q4’23 2. FY’23 US Delivery (non - iOS) consumer acquisition costs 31% of Delivery First Trips come from the Mobility app 1 22% of Mobility First Trips come from the Delivery app 1 Paid channels CRM

Company Overview 10 Investor Update Growing Uber One member base driving higher engagement 1. Percentage of Mobility and Delivery Gross Bookings coming from members as of Dec’23 2. Global monthly spend as of Q4’23 19M 3x member growth since Q4’21 30% Total Gross Bookings Coverage¹ 3.4x Member vs. non member monthly spend² 45% Delivery Gross Bookings Coverage

Company Overview 11 Investor Update Driver and courier engagement remains strong; more ways to flexibly earn via the Uber Driver app 1.7x Delivery - only 1.1x Mobility - only …and higher engagement 2 Delivery - only Mobility - only Cross - platform Single driver app = higher retention 1 … +19pp Delivery - only +1pp Mobility - only Delivery - only Mobility - only Cross - platform 1. US 28 - day earner retention data as of Q4’23 2. US supply hours per earner as of Q4’23

Company Overview 12 Investor Update New / Resurrected Drivers Courier Acquisition & Upsell Courier acquisition and upsell is 50% of the cost of new driver acquisition 1 ~20% of Mobility driver first trips come from the courier pool Uber’s platform provides for low cost supply acquisition 1. US data as of FY’23

Company Overview 13 Investor Update Business platform: more ways for partners to reach customers Uber for Business Uber Health Uber Connect Advertising Uber Direct

Company Overview 14 Investor Update Video Journey Ad in Uber App Video Tablet Ad with Video & QR Code Homepage Billboard in Uber Eats App Post - Checkout Ad in Uber Eats App From awareness… …to action Advertisers reach unique consumers and drive action across Uber’s advertising ecosystem

Company Overview 15 Investor Update Power of our shared technical platform: more data, more capabilities UberX Reserve UberX Share Black Taxi HCV Food Alcohol Connect Convenience Grocery Freight Identity Unified login, authorization, personalization Dispatching Upfront assignment, queuing, batching, positioning Infrastructure Storage, indexing/search, data flow, frameworks, configs, pipelines, ML labeling Maps Routing/navigation, pickup/dropoff points, ETAs Pricing Dynamic pricing/surge Support Agent network, automation, workflow, support channels Payments Unified wallet, local payment methods, risk and fraud tools Trip life - cycle State management, post processing, error management, receipts Localization Language, tax, compliance Ordering On demand, scheduled, multi - job

Company Overview 16 Investor Update Massive data sets and shared architecture enhance AI capabilities peak predictions per second 10M models trained per month 20K 16 Company Overview 16 Investor Update Personalization Eats Feed, Search, Rides Efficient Marketplace Matching, Routing, Dispatch, Pricing, Incentives Risk & Safety ID verification, Fraud & incident prevention GenAI for Productivity Code, Data & Oncall assistants, Automated testing & fixes GenAI for Automations Support bots, Document automations GenAI for Magical UX for consumers and earners

Company Overview 17 Investor Update Online food delivery Core business and shared tech are clearly extensible: multiple multi - billion dollar adjacencies, with more to come UberX Uber Reserve ~10x ¹ Hailables ~4x ¹ Grocery & Retail ~2x ¹ Advertising Enterprise solutions Last - mile logistics Travel And more… And more… 1. Trip growth FY’21 - FY’23

18 Investor Update Delivering Profitable Growth 3 - Year Outlook Gross Bookings Growth (Constant currency 1 ) Mid to high teens CAGR Primarily driven by MAPCs and Trips per MAPC growth Adjusted EBITDA 2 Growth High 30s% to 40% CAGR Healthy profitability expansion, while opportunistically reinvesting into longer - term growth Free Cash Flow 2 as % of Adjusted EBITDA 2 (Annual basis) 90%+ Significant and improving Free Cash Flow conversion Driving sustainable earnings growth at scale 1. Constant currency growth is calculated by translating our current period financial results using the corresponding prior period’s monthly exchange rates for our transacted currencies other than the U.S. dollar 2. See Non - GAAP Reconciliations

Company Overview 19 Investor Update What sets us apart Leading global platform to go anywhere and get anything Category - defining leadership serving multiple multi - trillion dollar markets with products leveraging our technology, infrastructure and platform Substantial and sustainable growth opportunities Further penetration of market opportunities through innovation and expansion within anchor categories, with a focus on sustainable growth At a financial inflection turbocharged by platform benefits Robust Adjusted EBITDA generation and Free Cash Flow conversion driven by operating leverage, capital discipline, and structurally lower customer acquisition costs and higher lifetime value

20 Investor Update MOBILITY Make every journey better 20 20

21 Investor Update Mobility ~$70B in Gross Bookings (+ 32% YoY ) ¹ ~$5B in Adjusted EBITDA 2 Global player operating in >70 countries Industry - leading scale, making every journey better $42B $69B $1.5B $5.0B 2018 2019 2020 2021 2022 2023 2018 2019 2020 2021 2022 2023 Adj. EBITDA ($) Adj. EBITDA Margin 3 Growth Profitability Market Leadership 10/10 Category leader in all top 10 countries 1. Growth rate shown on a constant currency basis 2. See Non - GAAP Reconciliations 3. Adjusted EBITDA as a % of Gross Bookings

22 Investor Update Mobility New geographies: “Unlock” markets now delivering $3B Gross Bookings annual run rate 2 Expanding use cases: 15% - > 30% of Trips on non - UberX products 1 Low cost products: Moto + Auto account for 13% of consumer first Trips and 19% of Vehicle first Trips. 3 UberX Share successfully launched in 13 countries Cost reduction: Driving down costs like support and payments to improve leverage ~70bps as a % of Gross Bookings 4 Vehicles 1 Mobility is firing on all cylinders +56% +13% Trips Per Consumer 1 +75% Drivers 1 +39% Consumers 1 Supply Demand 1. Average monthly in Q4’23 vs. Q4’21 2. Q4’23 Gross Bookings annual run rate from Argentina, Germany, Italy, Japan, South Korea, & Spain 3. As of Q4’23 4. Q4’23 vs. Q4’21 22
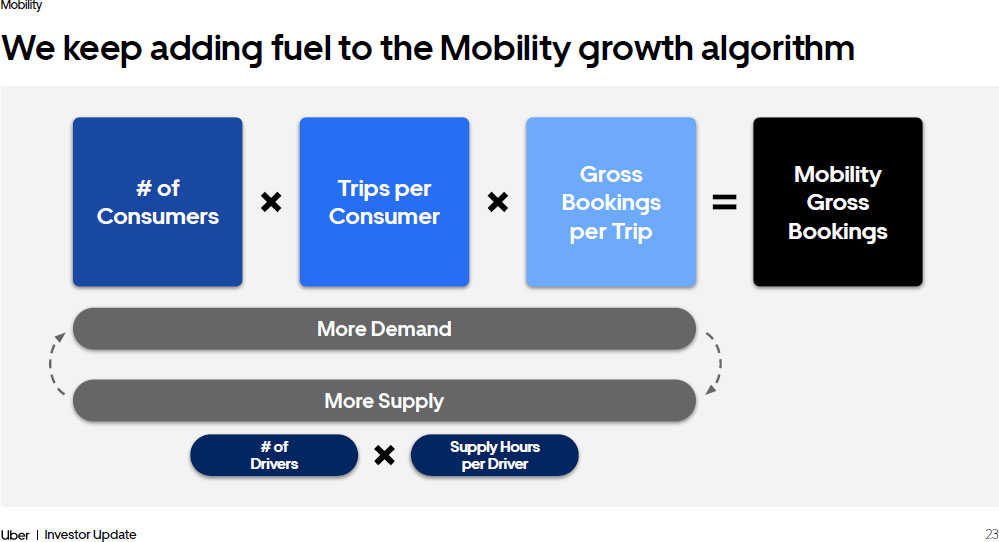
23 Investor Update Mobility We keep adding fuel to the Mobility growth algorithm # of Consumers Trips per Consumer Gross Bookings per Trip Mobility Gross Bookings More Demand More Supply # of Drivers Supply Hours per Driver

24 Investor Update Mobility Success in Mobility starts with drivers , the engine of growth Local, on - the - ground operational execution has significantly increased our driver base +75% Jan’22 Dec’23 Tech innovation and power of the platform - > structural supply advantage + Upfront fares & destination + Earnings transparency + Multi - gig earning opportunities + Earnings heatmap + Safety features + Reserved Trips + Deactivation Review Center 1. Chart reflects monthly active Mobility drivers

25 Investor Update Mobility Compared to non - Fleet supply: ● More supply hours per vehicle ● Higher rate of accepted dispatches ● Lower driver cancellation rate ✔ ✔ New York City San Francisco Los Angeles Paris Driver growth will come from both traditional base and new pools of supply Uber + Taxi = Better Together Uber is the platform of choice in a growing gig economy Fleet partnerships add high - quality and highly engaged supply Driver Platform Preference 1 1. Preference among multi - apping drivers for Uber vs. main competitor as of Q4’23 2. Average monthly in Q4’23 vs. Q4’21 3. As of Q4’23 US Brazi l UK Mexico ✔ ✔ ✔ ✔ ✔ ✔ Uber Competitor London Rome Rio de Janeiro Cancun 2.5x Growth in active taxis 2 (~5% of overall driver base) 18% of global supply hours come from Fleets 3

26 Investor Update Mobility 1. Consumers who took at least one Mobility Trip in a given month Even in our most mature markets, we are growing consumers at a strong pace — with lots of runway left Matching the higher penetration rates in our portfolio is a tens - of - billions of Gross Bookings opportunity US Brazil UK Mexico Canada Australia India France Spain Germany Monthly consumer penetration Average monthly consumers 1 / Total population 18+ 20% 10% 0% @Mexico penetration, India would add ~$11B annual GB Q4’23 penetration Q4’21 penetration Reserve helps us unlock suburban consumers: of these originate in the suburbs 40% of Reserve Trips are non - airport 75% @UK penetration, US would add ~ $13B annual GB >

27 Investor Update Mobility Global Uber for Business SAM We still have plenty of headroom to increase consumers across our key use cases Uber for Business serves 170K orgs globally, but we are still <10% penetrated in the SAM 4 Airports is a $10B business, but we are still <10% penetrated 1 on global airport Trips Global scale fuels trial: Total Addressable Spend Among Existing Fortune 500 Accounts Fortune 500 Uber Spend Matching Fortune 500 capture rates and wallet share globally = $12B 5 1. Uber airport consumers / total originating + departing airport passengers as reported by OAG 2. Share of total Mobility first Trips which are to/from an airport is 2x vs. share of total Mobility Trips which are to/from an airport 3. As of Q4’23 4. Serviceable addressable market is business spend across U4B - served use - cases in Travel, Eats, Health, Transit, Ops/Logistics 5. Account capture is % of enterprise and mid - market companies signed up for Uber for Business Better product - market fit: Illustrative - only New consumers are 2x more likely to take their first trip to or from an airport 2 ~20% of US airport drop off Trips are now on Reserve 3
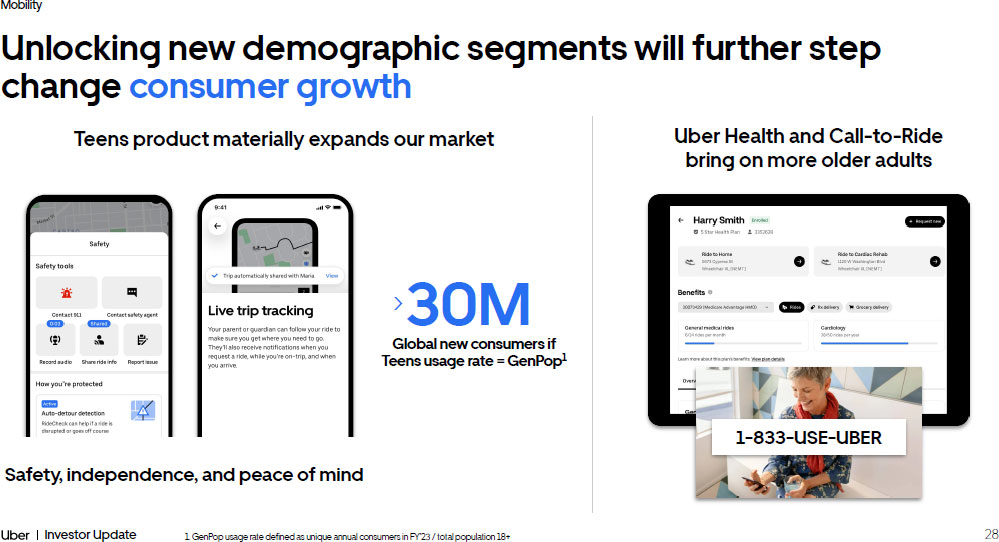
28 Investor Update Mobility Unlocking new demographic segments will further step change consumer growth Teens product materially expands our market 30M > Global new consumers if Teens usage rate = GenPop 1 1. GenPop usage rate defined as unique annual consumers in FY’23 / total population 18+ Safety, independence, and peace of mind Uber Health and Call - to - Ride bring on more older adults 1 - 833 - USE - UBER

29 Investor Update Mobility Germany We’re planting the seeds for consistent consumer growth in huge new countries where Uber is not yet a verb Italy ~4X South Korea ~10 X ~2X Spain ~2X Japan ~2X ~11 X Argentina 2021 2023 2021 2023 2021 2023 2021 2023 2021 2023 2021 2023 1. Q4 Gross Bookings annual run rate 2. Country data is Gross Bookings 3. Growth multipliers shown on a constant currency basis $1B 2021 1 $3B 2023 1 ↓

30 Investor Update Mobility A high proportion of low frequency consumers represents a huge opportunity to increase engagement Monthly Trips per Consumer 1 % of Monthly Consumers If all 1x consumers became 2x consumers = +$4B annual Gross Bookings 40% 20% 0% 9x+ 5 - 6x 3 - 4x 1 - 2x 7 - 8x ~50% of consumers take only 1 - 2 Trips per month 1. As of Q4’23
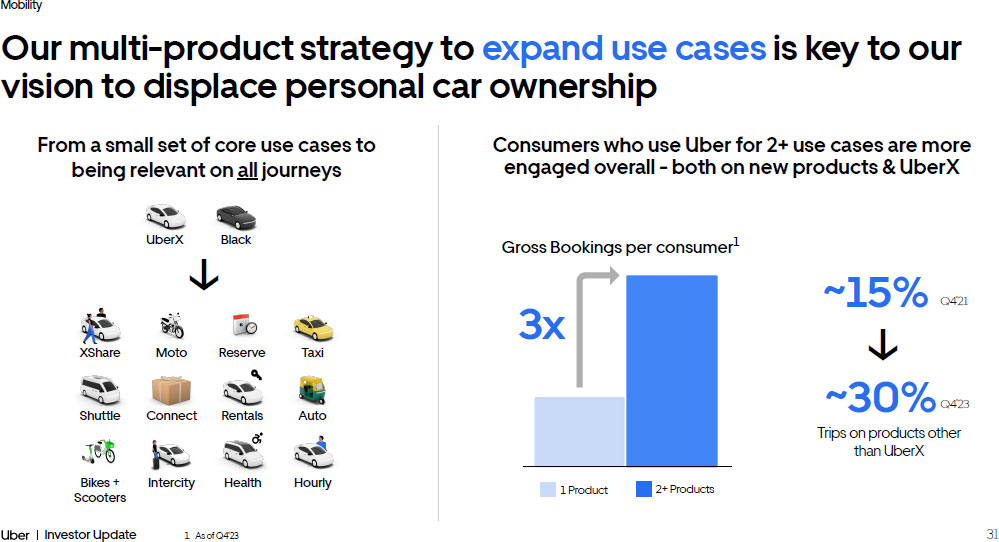
31 Investor Update Mobility ~15% ~30% Our multi - product strategy to expand use cases is key to our vision to displace personal car ownership Gross Bookings per consumer 1 Trips on products other than UberX Consumers who use Uber for 2+ use cases are more engaged overall - both on new products & UberX Q4’2 1 Q4’2 3 From a small set of core use cases to being relevant on all journeys ↓ 1. As of Q4’23 2+ Products 1 Product 3x Black UberX Reserve XShare Moto Shuttle Connect Rentals Intercity Bikes + Scooters Health Hourly Taxi Auto ↓

32 Investor Update Mobility Vast majority of global trips happen below the price point of UberX; low cost products unlock daily engagement Structurally lowering costs via: Low cost products unlock higher frequency Any Mobility Product XShare Moto Shuttle Mobility Monthly Trips per Consumer 4 Less Expensive Form Factors Cost Efficiency of Sharing Annual Trips 1 from Moto + Auto, growing +90% YoY 2 850M 1. Q4’23 annual run rate 2. Average monthly Trips in Q4‘23 vs Q4’22 3. 90th percentile of Mobility trips per rider among riders who are active on UberX Share and Shuttle, respectively. Figures exc lud e first time riders in a given month 4. As of Q4’23. Denominator is consumers who used a given product. Numerator is all Mobility Trips done by those consumers 35 Mobility Trips per month from the top decile of product consumers 3 22 10 5.6 XShare Shuttle Moto Auto >

33 Investor Update Mobility Our product portfolio serves consumer needs at various price points and delivers balanced growth in average fare Managing balanced growth across low cost and premium products supports modest average fare growth over time Convenience & Comfort - > Avg Fare - > Moto Low - cost offerings Shuttle Auto Bikes + Scooters XShare Group Rides UberX Comfort Comfort Electric Green Premium offerings Reserve Black SUV Intercity Hourly Standard offerings UberX Low Cost Premium 2021 2023 India Case Study Modest overall average fare growth thanks to balance of Low Cost & Premium Market Average Gross Bookings / Trip Gross Bookings

34 Investor Update Mobility Autonomous vehicles will significantly expand our TAM # of Consumers Trips per Consumer Gross Bookings per Trip Mobility Gross Bookings More Demand More Supply # of Drivers Supply Hours per Driver Autonomous Vehicles Lower cost / mile on AV leads to lower average fare Lower average fare in turn leads to more consumers and higher engagement 1 2

35 Investor Update Mobility Uber offers the greatest value for AV partners ● Hybrid network of autonomous and human drivers - > expedites AV commercialization while maintaining reliability and managing consumer experience ● Our matching efficiency and scale - > the best utilization and unit economics for AV fleets ● Our ridehailing go - to - market and operations expertise - > allows AV companies to focus on responsibly advancing their AV technology 10 live partnerships shaping the AV mobility, delivery, and freight ecosystem Leading AV companies are choosing Uber as the best autonomous platform partner to bring AVs to market Delivery Freight Mobility
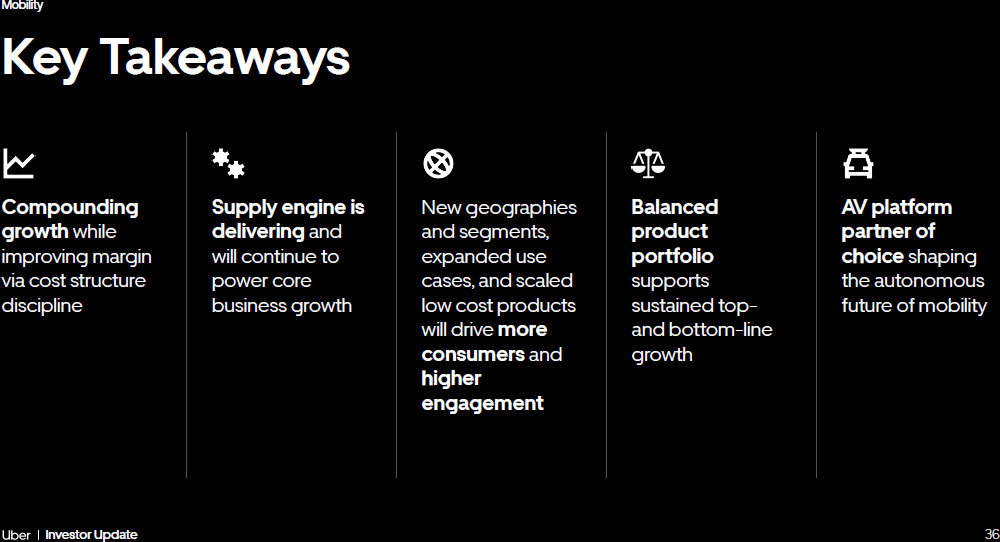
36 Investor Update Mobility Compounding growth while improving margin via cost structure discipline Supply engine is delivering and will continue to power core business growth Balanced product portfolio supports sustained top - and bottom - line growth New geographies and segments, expanded use cases, and scaled low cost products will drive more consumers and higher engagement Key Takeaways AV platform partner of choice shaping the autonomous future of mobility

37 Investor Update DELIVERY Deliver a better day 37 37 37

38 Investor Update Delivery Delivery keeps delivering Growth $1.5B Market Leadership 7 leading positions in our top 10 countries 10/10 Top countries by Gross Bookings saw category position gains in 2023 $1.5B ~$65B in Gross Bookings (+ 15% YoY ) ¹ Profitability Adj. EBITDA ($) Adj. EBITDA Margin 3 ~$1.5B in Adjusted EBITDA 2 2018 2019 2020 2021 2022 2023 2018 2019 2020 2021 2022 2023 1. Growth rate shown on a constant currency basis 2. See Non - GAAP Reconciliations 3. Adjusted EBITDA as a % of Gross Bookings $8B $64B $1.5B ($0.6B)

39 Investor Update Delivery +19% Strong execution across our operational input metrics Merchants 1 +11% Trips Per Consumer 1 +8% Consumers 1 +29% Couriers 1 Expanding Use Cases: 14% of Delivery consumers ordering Grocery & Retail monthly, up 6 pp² Growing Membership: Increased Membership coverage by over 20 pp to 45%² Scaling Merchant Tools ³ : Direct is >100M annualized Trips and advertising ~$900M annualized revenue 39 1. Average monthly in Q4’23 vs. Q4’21 2. Dec’23 vs. Dec’21 3. As of Q4’23
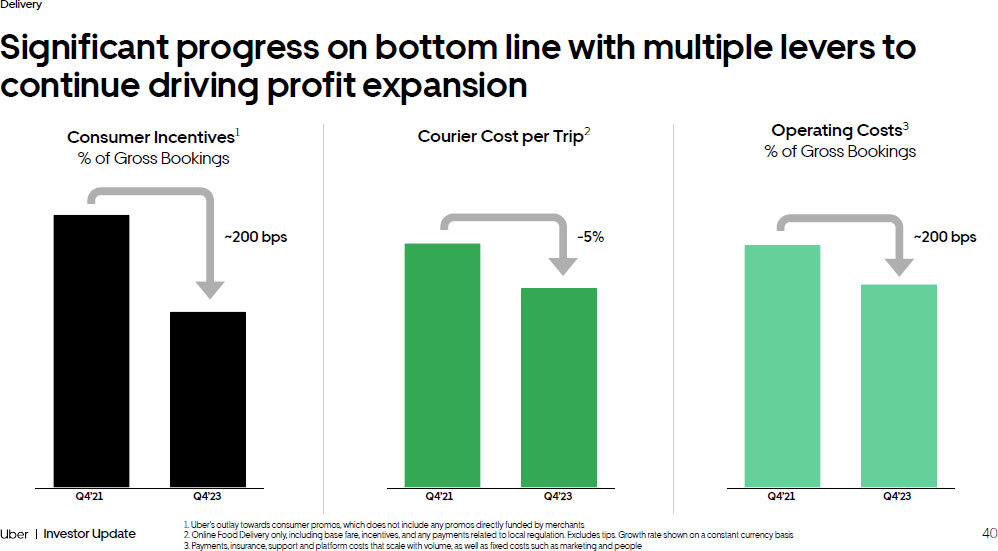
40 Investor Update Delivery Significant progress on bottom line with multiple levers to continue driving profit expansion ~200 bps - 5% 1. Uber's outlay towards consumer promos, which does not include any promos directly funded by merchants 2. Online Food Delivery only, including base fare, incentives, and any payments related to local regulation. Excludes tips. G row th rate shown on a constant currency basis 3. Payments, insurance, support and platform costs that scale with volume, as well as fixed costs such as marketing and peopl e ~200 bps Q4’21 Q4’23 Q4’23 Q4’21 Q4’23 Q4’21

41 Investor Update Delivery Consistent execution across our growth building blocks will compound top line for the long - term Supply (Merchant and Earner Partners) # of Consumers Trips per Consumer Gross Bookings per Trip Delivery Gross Bookings

42 Investor Update Delivery We have plenty of headroom to increase monthly consumers 8% 22% 1. Higher Penetrated and Lower Penetrated countries represent samples from Delivery segment top 10 countries by Gross Booking s 2. TAM penetrations represent monthly and annual active consumers / total population 18+ Monthly Consumers Annual Consumers 2% 7% Monthly Consumers Annual Consumers Q4’21 Penetration Q4’23 Penetration Only ~35% of Annual Consumers engage monthly Q4’21 Penetration Q4’23 Penetration

43 Investor Update Delivery Adding new merchants attracts and engages new consumers — we are still early in capturing the opportunity <30% <25% <5% <10% <20% <10% <45% <35% <50% <25% 1. Include unique locations of restaurant and grocery merchants United Kingdom Germany Taiwan (ROC) Canada Spain France United States Mexico Australia Chile Active Q4’21 Active Q4’23 TAM
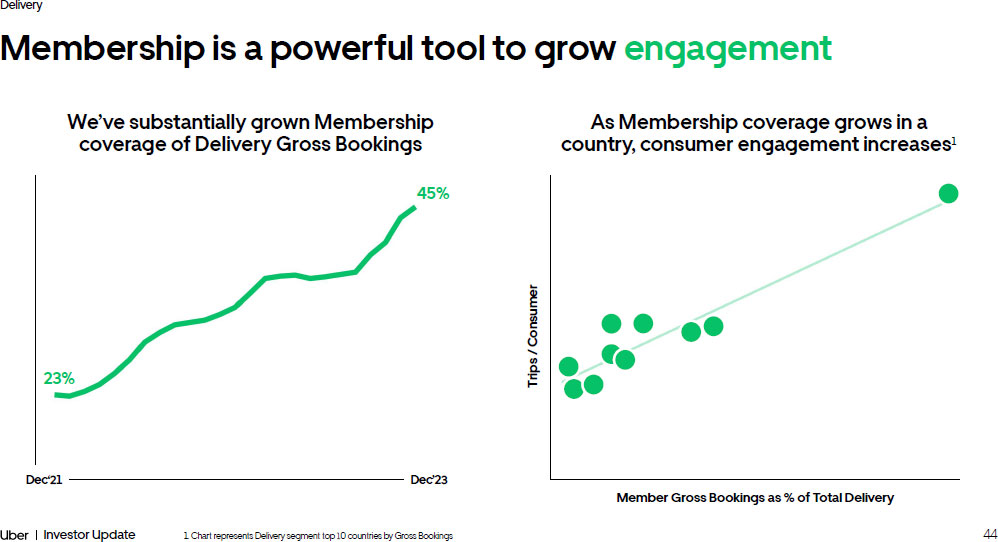
44 Investor Update Delivery Membership is a powerful tool to grow engagement We’ve substantially grown Membership coverage of Delivery Gross Bookings Dec‘21 Dec’23 As Membership coverage grows in a country, consumer engagement increases ¹ Trips / Consumer 1. Chart represents Delivery segment top 10 countries by Gross Bookings Member Gross Bookings as % of Total Delivery 45% 23%

45 Investor Update Delivery - 420 bps Investments in the consumer experience drive increased engagement and retention We’ve been able to lower net consumer fees 1 as % of basket 2 significantly ~25 % Reduction of Incomplete Delivery Trips At today’s scale the reduction in failed Trips 3 results in >$500M in annualized Gross Bookings 1. All fees paid by the consumer, net of promotions and Membership discounts 2. Gross value of items purchased before discounts or promotions 3. Orders that were placed but not fulfilled In - app improvements to aid in discovery and surface more content Simplified Navigation Universal search and easy access for location, cart, Categories & Filters Frictionless page filtering Carousel - Based Feed New carousel content, ranking, ads ranking High Intent Bottom Tabs Entry points for grocery and reorder use cases Affordability Reliability In - app experience Dec’21 Dec’22 Dec’23

46 Investor Update Delivery We’re building a world class Grocery & Retail product to expand into new use cases and categories 1. Portion of monthly Grocery & Retail consumers who reordered within 28 days of their last order Consumer Retention 1 Dec’22 +580 bps Dec’21 Dec’23 Seamless search experience Easily navigate thousands of merchants and SKUs across Grocery & Retail via filters and universal search Prominent brand placement Driving awareness of the major Grocery & Retail brands on our platform Personalized content Leveraging platform - wide data to curate personalized content and experiences for consumers

47 Investor Update Delivery Grocery & Retail grows the number of purchasing occasions and helps to further increase engagement Only Food Delivery Consumer Food Delivery and Grocery & Retail Consumer Food Delivery and Grocery & Retail Member 1.0x 3.0x 3.7x 1. As of H2’23

48 Investor Update Delivery Direct expands our TAM and complements our marketplace 48 18 Active markets ~3.5x Increase in Direct Trips 1 >60% of Direct Trips are non - restaurant deliveries Package Returns Parcel Delivery Big & Bulky 1. Q4’23 vs. Q4’21

49 Investor Update Delivery Our marketing tools, ads and offers, drive value for our merchants and advertising partners Sponsored Listings Ads in Search CPG Ads >8x Average Return on Ad Spend 3 ~5% Total spend on ads and merchant offers as % of Gross Bookings 1,2 Best - in - class country >10% of Gross Bookings 1. As of Dec’23 2. Includes advertising dollars and merchant funded offers 3. Average Return on Ad Spend for FY’23 Merchant Offers 49
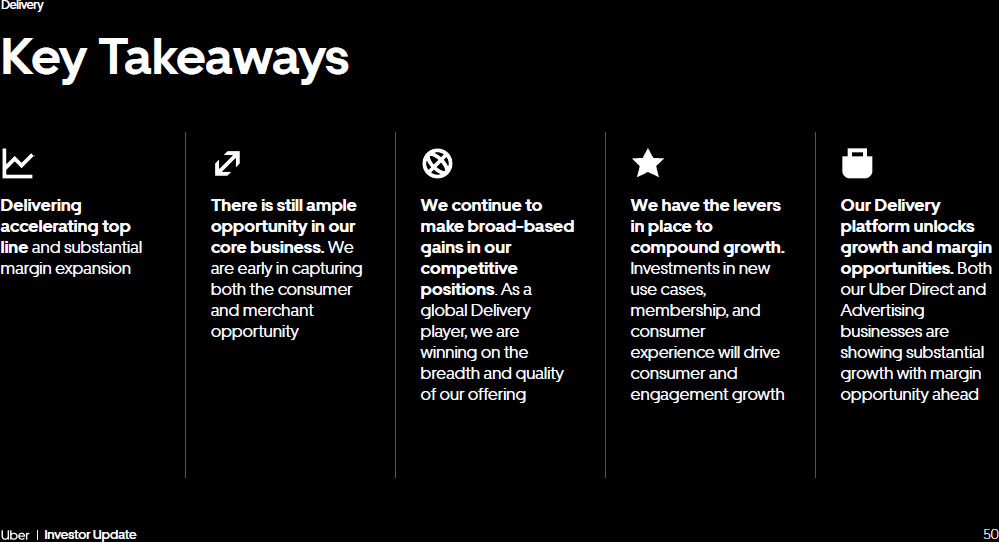
50 Investor Update Delivery Delivering accelerating top line and substantial margin expansion There is still ample opportunity in our core business. We are early in capturing both the consumer and merchant opportunity We continue to make broad - based gains in our competitive positions . As a global Delivery player, we are winning on the breadth and quality of our offering We have the levers in place to compound growth. Investments in new use cases, membership, and consumer experience will drive consumer and engagement growth Key Takeaways Our Delivery platform unlocks growth and margin opportunities. Both our Uber Direct and Advertising businesses are showing substantial growth with margin opportunity ahead

51 Investor Update ECONOMIC IMPACT & REGULATO RY PROGRESS 51 51 51

52 Investor Update Economic Impact & Regulatory Process Uber’s impact on the world is greater than ever 52 Drivers & Couriers Driver & Courier Earnings since 2016 Countries Driver & Courier Earnings in 2023 1 6.8M 70+ $280B + $61.9B 1. Earnings inclusive of tips 2. Source: 2022 survey of Australian drivers and couriers Flexible work is more important than ever 9 out of 10 drivers and couriers say they would not keep driving or delivering if it didn’t offer flexibility 2

53 Investor Update Economic Impact & Regulatory Process Upfront Fares & Destinations Record my Ride Deactivation review To ensure we remain the platform of choice for flexible work, we’re always innovating and improving the driver and courier experience

54 Investor Update Economic Impact & Regulatory Process Defining the future of work: flexibility with benefits and protections

55 Investor Update Economic Impact & Regulatory Process 235,000 taxi drivers in 33 countries are earning on Uber In 2023, taxi drivers globally earned $1.6B by accepting trips via Uber. Using Uber means taxi drivers can stay busier and earn more, while our consumers get better service. In San Francisco, for example, taxi drivers who take UberX trips earned on average 27% more than those who don’t. That’s almost $1,800 a month from Uber trips alone. In Buenos Aires, we found that drivers tripled their hourly earnings on Uber after they started taking UberX trips.

56 Investor Update Economic Impact & Regulatory Process 56 Investor Update Economic Impact & Regulatory Process Coming soon

57 Investor Update Economic Impact & Regulatory Process Monthly Active ZEV Drivers (Global) We have more than 126,000 monthly active zero - emission vehicle drivers, doubling from this time last year and completing 287 million Trips over the last three years alone. World’s largest zero - emission vehicle rideshare platform 57 Q4’21 Q1’22 Q2’22 Q3’22 Q4’22 Q1’23 Q2’23 Q3’23 Q4’23 126K 18K ~7x

58 Investor Update Economic Impact & Regulatory Process Uber drivers have become the world’s early adopters of EVs, going electric 7x faster than regular motorists 58 Investor Update Economic Impact & Regulatory Process

59 Investor Update Economic Impact & Regulatory Process Investing in sustainability isn’t just the right thing to do, it’s also good for business Environment is a top concern among Alpha and Gen Z 2 59 of Gen Z prefer to buy from sustainable brands 1 62% are willing to pay 10% more for sustainable products 1 54% 1. Source: First Insight 2. As of H2’23

60 Investor Update Economic Impact & Regulatory Process 60 Investor Update Economic Impact & Regulatory Process Cities Earners Taxis

61 Investor Update DELIVERIN G PROFITABL E GROWTH 61 61 61

Delivering Profitable Growth 62 Investor Update 62 Opportunity to extend profitable growth and strengthen capital allocation Building a more positive world with an enormous impact Uniquely positioned at the intersection of the digital and physical world Network effects supported by industry leading marketplace technology Why Uber Investor Update Delivering Profitable Growth

63 Investor Update Delivering Profitable Growth Significant growth and momentum since IPO 1. See Non - GAAP Reconciliations 2. Adjusted EBITDA as a % of Gross Bookings Mobility Gross Bookings +2.8x +$88B Adjusted EBITDA 1 +$6B 2018 2019 2020 2021 2022 2023 2018 2019 2020 2021 2022 2023 Adjusted EBITDA Margin 2 Adjusted EBITDA ($1.8B) ($2.7B) ($2.5B) ($0.8B) $1.7B $4.1B (3.6%) (4.3%) (4.4%) (0.9%) 1.5% 3.0% $138B $115B $90B $58B $65B $50B Delivery Freight

64 Investor Update Delivering Profitable Growth Compelling financial track record 64 Growth at scale 20% + Gross Bookings CAGR (2021 - 2023) Met or exceeded Gross Bookings and Adjusted EBITDA expectations for 8 straight quarters Adjusted EBITDA Profitability (Q3’21) Positive Free Cash Flow (Q2’22) GAAP Operating Profitability (Q2’23)

65 Investor Update Delivering Profitable Growth 3 - Year Outlook Gross Bookings Growth (Constant currency 1 ) Mid to high teens CAGR Primarily driven by MAPCs and Trips per MAPC growth Adjusted EBITDA 2 Growth High 30s% to 40% CAGR Healthy profitability expansion, while opportunistically reinvesting into longer - term growth Free Cash Flow 2 as % of Adjusted EBITDA 2 (Annual basis) 90%+ Significant and improving Free Cash Flow conversion Driving sustainable earnings growth at scale 1. Constant currency growth is calculated by translating our current period financial results using the corresponding prior period’s monthly exchange rates for our transacted currencies other than the U.S. dollar 2. See Non - GAAP Reconciliations

66 Investor Update Delivering Profitable Growth Operational excellence Shared and compounding marketplace tech Breath of offerings with unmatched global scale Renowned brand and differentiated membership program It all starts with the power of the platform Power of the Platform Lower CAC, higher engagement and retention Faster time to market to drive consumers and frequency More affordable price points Scheduled B2B New age groups Travel Emerging market products Operating leverage + Higher investment returns
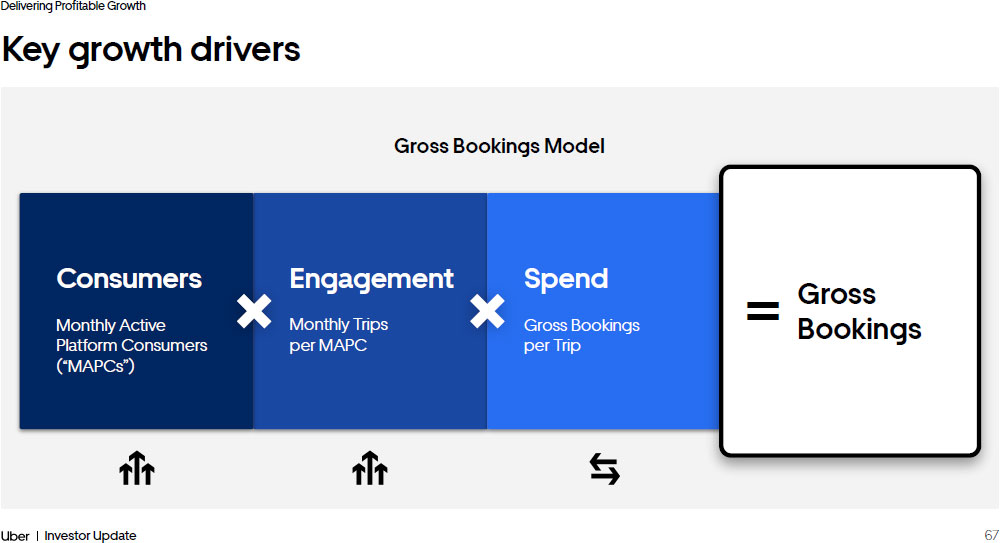
67 Investor Update Delivering Profitable Growth Engagement Monthly Trips per MAPC Key growth drivers Gross Bookings Model Consumers Monthly Active Platform Consumers (“MAPCs”) Spend Gross Bookings per Trip Gross Bookings =

68 Investor Update Delivering Profitable Growth 15% CAGR 80M 2018 2019 2020 2021 2022 2023 102M 82M 107M 123M 140M Still in very early stages of penetrating our large TAMs 1. MAPC amounts shown for each year represent the average of the quarterly MAPCs for each respective year 2. “Monthly consumers” (MAPCs) as a percentage of population of people over the age of 18 across Mobility and Delivery active co untries <5% monthly consumer penetration 2 Future Drivers New and emerging geographies New consumer demographics Expanded use cases MAPC Growth 1 Our Opportunity

69 Investor Update Delivering Profitable Growth Deepening engagement by getting consumers to use Uber more 1. Average monthly Trips divided by MAPCs for each year. MAPC amounts shown for each year represent the average of the quarte rly MAPCs for each respective year <50% of MAPCs use Uber only once or twice per month 6% CAGR Future Drivers Multi - product use Membership Data - led product improvements Monthly Trips per MAPC 1 Growth Our Opportunity 5.5 2018 2019 2020 2021 2022 2023 5.7 5.1 5.0 5.2 5.6

70 Investor Update Delivering Profitable Growth GAAP operating profitability achieved in Q2’23 GAAP Operating Income (Loss) 1 Adjusted EBITDA 1,2 Adjusted EBITDA Margin 3 $168 ($482) ($713) ($495) ($142) ($262) $326 $394 $652 $364 $516 $665 $761 $916 $1,092 $1,283 0.6% 1.3% 1.8% 2.2% 2.4% 2.7% 3.1% 3.4% 1. Figures in millions 2. See Non - GAAP Reconciliations 3. Adjusted EBITDA as a % of Gross Bookings

71 Investor Update Delivering Profitable Growth A majority of our top markets are profitable, and have increased profitability in the last two years 1. Top 10 countries shown based on Gross Bookings for FY’23 for each segment 2. Adjusted EBITDA as a % of Gross Bookings for each respective segment 7% ~3pp 2% Not Profitable x Margins Reduced Profitable x Margins Expanded Adj. EBITDA Margin 2 FY’23 Adj. EBITDA Margin FY’23 vs. FY21 Delivery Total Top Ten Countries Mobility Total Top Ten Countries 85% of Top Countries 1 Profitable Demonstrating power of the platform 85% of Top Countries Improved Margins Since FY’21 Continued Headroom for Margin Expansion Majority remain below best - in - class

72 Investor Update Delivering Profitable Growth ~80 bps ~280 bps Significant progress on bottom line with multiple initiatives to continue driving profit expansion 3% Headcount Growth CAGR ⁴ ~100 bps 1. Primarily includes refunds & appeasement expenses and support agent costs 2. Includes payment card fees, chargebacks, and other payment - related expenses 3. See Non - GAAP Reconciliations 4. Compared to 2019 Future margin expansion drivers Support Unlock Generative AI opportunities to improve support experience and drive cost efficiencies Payments Leverage new tech functionalities across the platform to minimize payment costs Fixed Cost Leverage Maintain cost discipline on headcount and SBC 2019 2021 2023 Volume - based discounts Payment on - shoring Least cost routing Alternative payments Fraud prevention 2019 2021 2023 Reduced in - person support Increased automation Low cost locations Reduced defects 2019 2021 2023

73 Investor Update Delivering Profitable Growth 90%+ (% of Adj. EBITDA) ~60% (% of Adj. EBITDA) 1. See Non - GAAP Reconciliations 2. Free Cash Flow conversion shown as an annual average, and defined as Free Cash Flow as a percentage of Adjusted EBITDA 2018 - 2020 2021 - 2023 2024 - 2026 ($7.1B) ($10.4B) $5.0B $3.0B Free Cash Flow has reached an inflection point Adjusted EBITDA 1 Free Cash Flow 1 Free Cash Flow Conversion 2
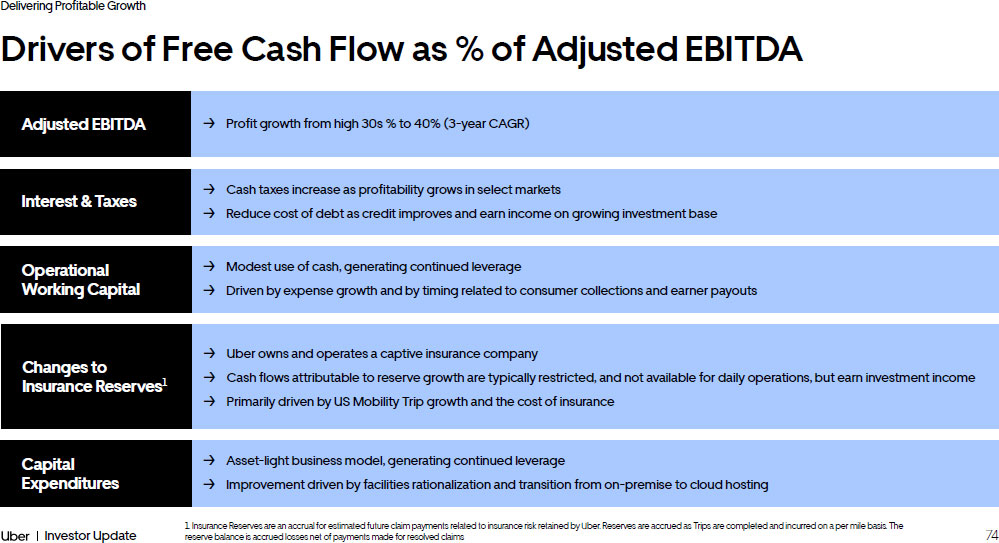
74 Investor Update Delivering Profitable Growth Drivers of Free Cash Flow as % of Adjusted EBITDA 1. Insurance Reserves are an accrual for estimated future claim payments related to insurance risk retained by Uber. Reserves ar e accrued as Trips are completed and incurred on a per mile basis. The reserve balance is accrued losses net of payments made for resolved claims → Uber owns and operates a captive insurance company → Cash flows attributable to reserve growth are typically restricted, and not available for daily operations, but earn investme nt income → Primarily driven by US Mobility Trip growth and the cost of insurance Changes to Insurance Reserves 1 → Profit growth from high 30s % to 40% (3 - year CAGR) Adjusted EBITDA → Cash taxes increase as profitability grows in select markets → Reduce cost of debt as credit improves and earn income on growing investment base Interest & Taxes → Modest use of cash, generating continued leverage → Driven by expense growth and by timing related to consumer collections and earner payouts Operational Working Capital → Asset - light business model, generating continued leverage → Improvement driven by facilities rationalization and transition from on - premise to cloud hosting Capital Expenditures
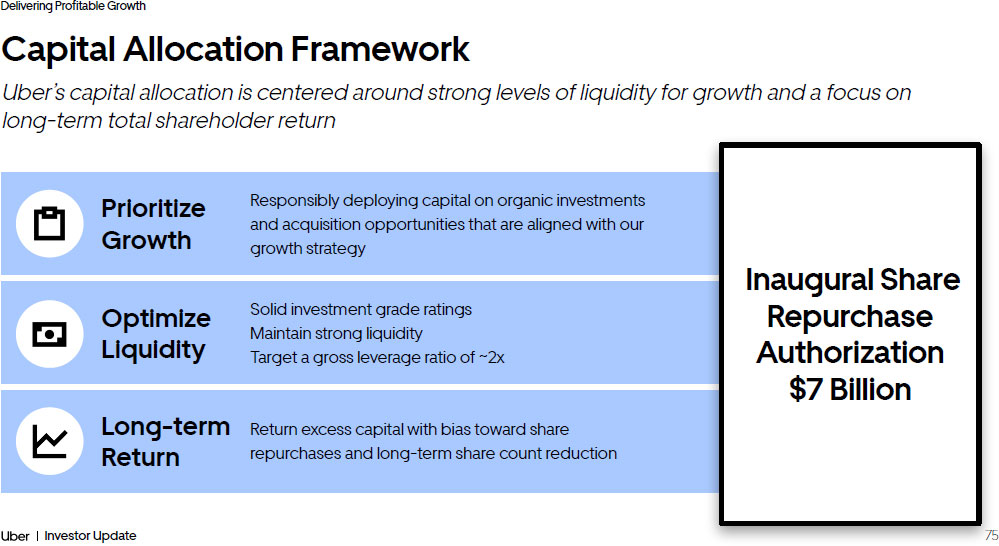
75 Investor Update Delivering Profitable Growth Capital Allocation Framework Uber’s capital allocation is centered around strong levels of liquidity for growth and a focus on long - term total shareholder return Prioritize Growth Responsibly deploying capital on organic investments and acquisition opportunities that are aligned with our growth strategy Optimize Liquidity Solid investment grade ratings Maintain strong liquidity Target a gross leverage ratio of ~2x Long - term Return Return excess capital with bias toward share repurchases and long - term share count reduction Inaugural Share Repurchase Authorization $7 Billion

Delivering Profitable Growth 76 Investor Update Summary investment highlights Strong financial track record of sustained growth and profitability expansion Mid to high teens Gross Bookings CAGR, supported by massive addressable markets and expansion of new products and services Operational rigor to continue driving outsized profitability and cash flow growth; Adjusted EBITDA to grow >2x the rate of topline growth with 90%+ Free Cash Flow conversion Disciplined capital allocation framework focused on ensuring optimal liquidity for growth and total long - term shareholder return

77 Investor Update Non - GAAP Reconciliations
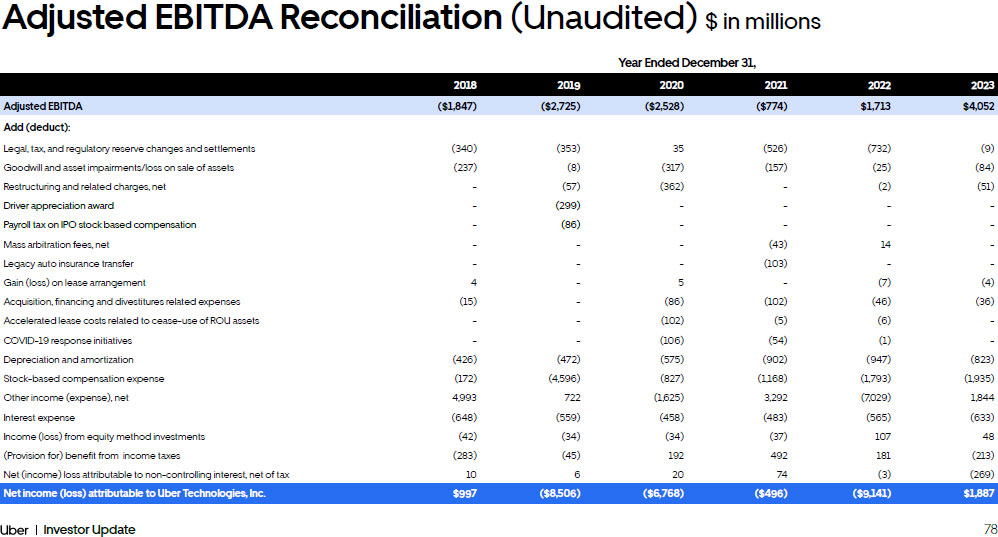
78 Investor Update Adjusted EBITDA Reconciliation (Unaudited) $ in millions Year Ended December 31, 2018 2019 2020 2021 2022 2023 Adjusted EBITDA ($1,847) ($2,725) ($2,528) ($774) $1,713 $4,052 Add (deduct): Legal, tax, and regulatory reserve changes and settlements (340) (353) 35 (526) (732) (9) Goodwill and asset impairments/loss on sale of assets (237) (8) (317) (157) (25) (84) Restructuring and related charges, net - (57) (362) - (2) (51) Driver appreciation award - (299) - - - - Payroll tax on IPO stock based compensation - (86) - - - - Mass arbitration fees, net - - - (43) 14 - Legacy auto insurance transfer - - - (103) - - Gain (loss) on lease arrangement 4 - 5 - (7) (4) Acquisition, financing and divestitures related expenses (15) - (86) (102) (46) (36) Accelerated lease costs related to cease - use of ROU assets - - (102) (5) (6) - COVID - 19 response initiatives - - (106) (54) (1) - Depreciation and amortization (426) (472) (575) (902) (947) (823) Stock - based compensation expense (172) (4,596) (827) (1,168) (1,793) (1,935) Other income (expense), net 4,993 722 (1,625) 3,292 (7,029) 1,844 Interest expense (648) (559) (458) (483) (565) (633) Income (loss) from equity method investments (42) (34) (34) (37) 107 48 (Provision for) benefit from income taxes (283) (45) 192 492 181 (213) Net (income) loss attributable to non - controlling interest, net of tax 10 6 20 74 (3) (269) Net income (loss) attributable to Uber Technologies, Inc. $997 ($8,506) ($6,768) ($496) ($9,141) $1,887

79 Investor Update Financial Framework Three Months Ended March 31, June 30, Sept 30, Dec 31, March 31, June 30, Sept 30, Dec 31, 2022 2022 2022 2022 2023 2023 2023 2023 Adjusted EBITDA $168 $364 $516 $665 $761 $916 $1,092 $1,283 Add (deduct): Legal, tax, and regulatory reserve changes and settlements - (368) (283) (81) (250) 155 13 73 Goodwill and asset impairments/loss on sale of assets (13) (4) - (8) (67) (16) (2) 1 Restructuring and related charges, net (2) - - - (22) (9) (4) (16) Mass arbitration fees, net - 14 - - - - - - Gain (loss) on lease arrangement (7) - - - 1 2 1 (8) Acquisition, financing and divestitures related expenses (14) (6) (19) (7) (8) (10) (9) (9) Accelerated lease costs related to cease - use of ROU assets - - - (6) - - - - COVID - 19 response initiatives (1) - - - - - - - Depreciation and amortization (254) (243) (227) (223) (207) (208) (205) (203) Stock - based compensation expense (359) (470) (482) (482) (470) (504) (492) (469) Other income (expense), net (5,557) (1,704) (535) 767 292 273 (52) 1,331 Interest expense (129) (139) (146) (151) (168) (144) (166) (155) Income from equity method investments 18 17 30 42 36 4 3 5 (Provision for) benefit from income taxes 232 (77) (58) 84 (55) (65) 40 (133) Net (income) loss attributable to non - controlling interest, net of tax (12) 15 (2) (5) - - 2 (271) Net income (loss) attributable to Uber Technologies, Inc. ($5,930) ($2,601) ($1,206) $595 ($157) $394 $221 $1,429 Adjusted EBITDA Reconciliation (Unaudited) $ in millions
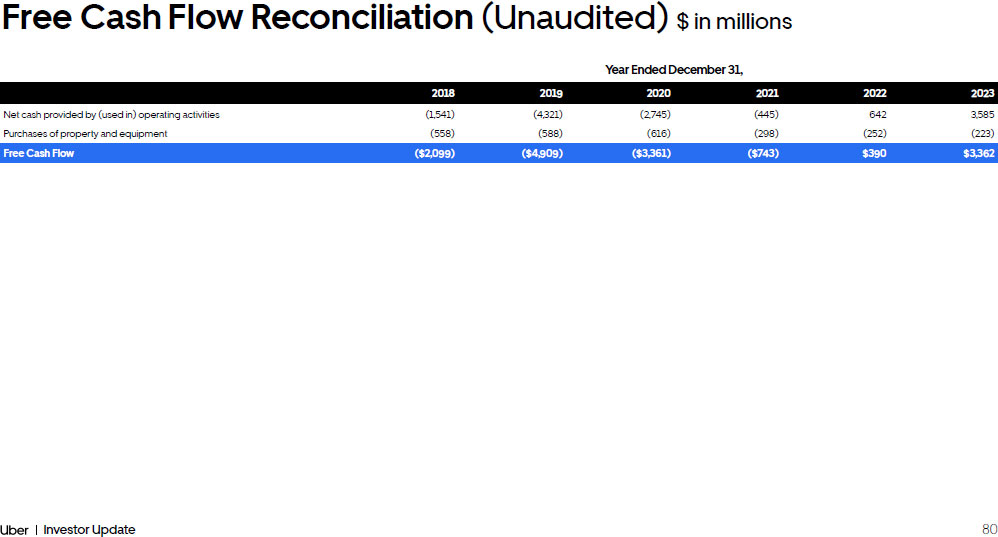
80 Investor Update Financial Framework Year Ended December 31, 2018 2019 2020 2021 2022 2023 Net cash provided by (used in) operating activities (1,541) (4,321) (2,745) (445) 642 3,585 Purchases of property and equipment (558) (588) (616) (298) (252) (223) Free Cash Flow ($2,099) ($4,909) ($3,361) ($743) $390 $3,362 Free Cash Flow Reconciliation (Unaudited) $ in millions

81 Investor Update Financial Framework Year Ended December 31, 2019 2020 2021 2022 2023 GAAP Research and development $4,836 $2,205 $2,054 $2,798 $3,164 Payroll tax on IPO stock - based compensation (53) - - - - Restructuring and related charges (31) (84) - - (17) Acquisition, financing, and divestitures related expenses - (12) (22) - - Goodwill and asset impairment/loss on sale of assets - - (52) - - Stock - based compensation (2,958) (477) (614) (1,060) (1,215) Non - GAAP Research and development $1,794 $1,632 $1,366 $1,738 $1,932 Gross Bookings 65,001 57,897 90,415 115,395 137,865 GAAP Research and development as % of Gross Bookings 7.4% 3.8% 2.3% 2.4% 2.3% Non - GAAP Research and development as % of Gross Bookings 2.8% 2.8% 1.5% 1.5% 1.4% Non - GAAP Costs and Operating Expenses Reconciliations (Unaudited) $ in millions Year Ended December 31, 2019 2020 2021 2022 2023 GAAP General and administrative $3,299 $2,666 $2,316 $3,136 $2,682 Payroll tax on IPO stock - based compensation (17) - - - - Legal, tax, and regulatory reserve changes and settlements (389) 93 26 (635) (22) Goodwill and asset impairment/loss on sale of assets (8) (299) (101) (25) (84) Restructuring and related charges (5) (86) - - (8) Gain (loss) on lease arrangements, net - 5 - (7) (5) Acquisition, financing, and divestitures related expenses - (45) (66) (38) (27) Accelerated lease costs related to cease - use of ROU assets - (102) (5) (6) - Mass arbitration fees - - (43) 14 - Stock - based compensation (942) (230) (332) (477) (440) Non - GAAP General and administrative $1,938 $2,002 $1,795 $1,962 $2,096 Gross Bookings 65,001 57,897 90,415 115,395 137,865 GAAP GAAP General and administrative as % of Gross Bookings 5.1% 4.6% 2.6% 2.7% 1.9% Non - GAAP GAAP General and administrative as % of Gross Bookings 3.0% 3.5% 2.0% 1.7% 1.5%

v3.24.0.1
Cover
|
Feb. 06, 2024 |
| Cover [Abstract] |
|
| Document Type |
8-K
|
| Amendment Flag |
false
|
| Document Period End Date |
Feb. 06, 2024
|
| Entity File Number |
001-38902
|
| Entity Registrant Name |
UBER
TECHNOLOGIES, INC.
|
| Entity Central Index Key |
0001543151
|
| Entity Tax Identification Number |
45-2647441
|
| Entity Incorporation, State or Country Code |
DE
|
| Entity Address, Address Line One |
1725 Third Street
|
| Entity Address, City or Town |
San Francisco
|
| Entity Address, State or Province |
CA
|
| Entity Address, Postal Zip Code |
94158
|
| City Area Code |
(415)
|
| Local Phone Number |
612-8582
|
| Written Communications |
false
|
| Soliciting Material |
false
|
| Pre-commencement Tender Offer |
false
|
| Pre-commencement Issuer Tender Offer |
false
|
| Title of 12(b) Security |
Common
Stock, par value $0.00001 per share
|
| Trading Symbol |
UBER
|
| Security Exchange Name |
NYSE
|
| Entity Emerging Growth Company |
false
|
| Entity Information, Former Legal or Registered Name |
Not Applicable
|
| X |
- DefinitionBoolean flag that is true when the XBRL content amends previously-filed or accepted submission.
| Name: |
dei_AmendmentFlag |
| Namespace Prefix: |
dei_ |
| Data Type: |
xbrli:booleanItemType |
| Balance Type: |
na |
| Period Type: |
duration |
|
| X |
- DefinitionFor the EDGAR submission types of Form 8-K: the date of the report, the date of the earliest event reported; for the EDGAR submission types of Form N-1A: the filing date; for all other submission types: the end of the reporting or transition period. The format of the date is YYYY-MM-DD.
| Name: |
dei_DocumentPeriodEndDate |
| Namespace Prefix: |
dei_ |
| Data Type: |
xbrli:dateItemType |
| Balance Type: |
na |
| Period Type: |
duration |
|
| X |
- DefinitionThe type of document being provided (such as 10-K, 10-Q, 485BPOS, etc). The document type is limited to the same value as the supporting SEC submission type, or the word 'Other'.
| Name: |
dei_DocumentType |
| Namespace Prefix: |
dei_ |
| Data Type: |
dei:submissionTypeItemType |
| Balance Type: |
na |
| Period Type: |
duration |
|
| X |
- DefinitionAddress Line 1 such as Attn, Building Name, Street Name
| Name: |
dei_EntityAddressAddressLine1 |
| Namespace Prefix: |
dei_ |
| Data Type: |
xbrli:normalizedStringItemType |
| Balance Type: |
na |
| Period Type: |
duration |
|
| X |
- Definition
+ References
+ Details
| Name: |
dei_EntityAddressCityOrTown |
| Namespace Prefix: |
dei_ |
| Data Type: |
xbrli:normalizedStringItemType |
| Balance Type: |
na |
| Period Type: |
duration |
|
| X |
- DefinitionCode for the postal or zip code
| Name: |
dei_EntityAddressPostalZipCode |
| Namespace Prefix: |
dei_ |
| Data Type: |
xbrli:normalizedStringItemType |
| Balance Type: |
na |
| Period Type: |
duration |
|
| X |
- DefinitionName of the state or province.
| Name: |
dei_EntityAddressStateOrProvince |
| Namespace Prefix: |
dei_ |
| Data Type: |
dei:stateOrProvinceItemType |
| Balance Type: |
na |
| Period Type: |
duration |
|
| X |
- DefinitionA unique 10-digit SEC-issued value to identify entities that have filed disclosures with the SEC. It is commonly abbreviated as CIK. Reference 1: http://www.xbrl.org/2003/role/presentationRef
-Publisher SEC
-Name Exchange Act
-Number 240
-Section 12
-Subsection b-2
| Name: |
dei_EntityCentralIndexKey |
| Namespace Prefix: |
dei_ |
| Data Type: |
dei:centralIndexKeyItemType |
| Balance Type: |
na |
| Period Type: |
duration |
|
| X |
- DefinitionIndicate if registrant meets the emerging growth company criteria. Reference 1: http://www.xbrl.org/2003/role/presentationRef
-Publisher SEC
-Name Exchange Act
-Number 240
-Section 12
-Subsection b-2
| Name: |
dei_EntityEmergingGrowthCompany |
| Namespace Prefix: |
dei_ |
| Data Type: |
xbrli:booleanItemType |
| Balance Type: |
na |
| Period Type: |
duration |
|
| X |
- DefinitionCommission file number. The field allows up to 17 characters. The prefix may contain 1-3 digits, the sequence number may contain 1-8 digits, the optional suffix may contain 1-4 characters, and the fields are separated with a hyphen.
| Name: |
dei_EntityFileNumber |
| Namespace Prefix: |
dei_ |
| Data Type: |
dei:fileNumberItemType |
| Balance Type: |
na |
| Period Type: |
duration |
|
| X |
- DefinitionTwo-character EDGAR code representing the state or country of incorporation.
| Name: |
dei_EntityIncorporationStateCountryCode |
| Namespace Prefix: |
dei_ |
| Data Type: |
dei:edgarStateCountryItemType |
| Balance Type: |
na |
| Period Type: |
duration |
|
| X |
- DefinitionThe exact name of the entity filing the report as specified in its charter, which is required by forms filed with the SEC. Reference 1: http://www.xbrl.org/2003/role/presentationRef
-Publisher SEC
-Name Exchange Act
-Number 240
-Section 12
-Subsection b-2
| Name: |
dei_EntityRegistrantName |
| Namespace Prefix: |
dei_ |
| Data Type: |
xbrli:normalizedStringItemType |
| Balance Type: |
na |
| Period Type: |
duration |
|
| X |
- DefinitionThe Tax Identification Number (TIN), also known as an Employer Identification Number (EIN), is a unique 9-digit value assigned by the IRS. Reference 1: http://www.xbrl.org/2003/role/presentationRef
-Publisher SEC
-Name Exchange Act
-Number 240
-Section 12
-Subsection b-2
| Name: |
dei_EntityTaxIdentificationNumber |
| Namespace Prefix: |
dei_ |
| Data Type: |
dei:employerIdItemType |
| Balance Type: |
na |
| Period Type: |
duration |
|
| X |
- DefinitionLocal phone number for entity.
| Name: |
dei_LocalPhoneNumber |
| Namespace Prefix: |
dei_ |
| Data Type: |
xbrli:normalizedStringItemType |
| Balance Type: |
na |
| Period Type: |
duration |
|
| X |
- DefinitionBoolean flag that is true when the Form 8-K filing is intended to satisfy the filing obligation of the registrant as pre-commencement communications pursuant to Rule 13e-4(c) under the Exchange Act. Reference 1: http://www.xbrl.org/2003/role/presentationRef
-Publisher SEC
-Name Exchange Act
-Number 240
-Section 13e
-Subsection 4c
| Name: |
dei_PreCommencementIssuerTenderOffer |
| Namespace Prefix: |
dei_ |
| Data Type: |
xbrli:booleanItemType |
| Balance Type: |
na |
| Period Type: |
duration |
|
| X |
- DefinitionBoolean flag that is true when the Form 8-K filing is intended to satisfy the filing obligation of the registrant as pre-commencement communications pursuant to Rule 14d-2(b) under the Exchange Act. Reference 1: http://www.xbrl.org/2003/role/presentationRef
-Publisher SEC
-Name Exchange Act
-Number 240
-Section 14d
-Subsection 2b
| Name: |
dei_PreCommencementTenderOffer |
| Namespace Prefix: |
dei_ |
| Data Type: |
xbrli:booleanItemType |
| Balance Type: |
na |
| Period Type: |
duration |
|
| X |
- DefinitionTitle of a 12(b) registered security. Reference 1: http://www.xbrl.org/2003/role/presentationRef
-Publisher SEC
-Name Exchange Act
-Number 240
-Section 12
-Subsection b
| Name: |
dei_Security12bTitle |
| Namespace Prefix: |
dei_ |
| Data Type: |
dei:securityTitleItemType |
| Balance Type: |
na |
| Period Type: |
duration |
|
| X |
- DefinitionName of the Exchange on which a security is registered. Reference 1: http://www.xbrl.org/2003/role/presentationRef
-Publisher SEC
-Name Exchange Act
-Number 240
-Section 12
-Subsection d1-1
| Name: |
dei_SecurityExchangeName |
| Namespace Prefix: |
dei_ |
| Data Type: |
dei:edgarExchangeCodeItemType |
| Balance Type: |
na |
| Period Type: |
duration |
|
| X |
- DefinitionBoolean flag that is true when the Form 8-K filing is intended to satisfy the filing obligation of the registrant as soliciting material pursuant to Rule 14a-12 under the Exchange Act. Reference 1: http://www.xbrl.org/2003/role/presentationRef
-Publisher SEC
-Name Exchange Act
-Section 14a
-Number 240
-Subsection 12
| Name: |
dei_SolicitingMaterial |
| Namespace Prefix: |
dei_ |
| Data Type: |
xbrli:booleanItemType |
| Balance Type: |
na |
| Period Type: |
duration |
|
| X |
- DefinitionTrading symbol of an instrument as listed on an exchange.
| Name: |
dei_TradingSymbol |
| Namespace Prefix: |
dei_ |
| Data Type: |
dei:tradingSymbolItemType |
| Balance Type: |
na |
| Period Type: |
duration |
|
| X |
- DefinitionBoolean flag that is true when the Form 8-K filing is intended to satisfy the filing obligation of the registrant as written communications pursuant to Rule 425 under the Securities Act. Reference 1: http://www.xbrl.org/2003/role/presentationRef
-Publisher SEC
-Name Securities Act
-Number 230
-Section 425
| Name: |
dei_WrittenCommunications |
| Namespace Prefix: |
dei_ |
| Data Type: |
xbrli:booleanItemType |
| Balance Type: |
na |
| Period Type: |
duration |
|
Uber Technologies (NYSE:UBER)
Historical Stock Chart
From Mar 2024 to Apr 2024

Uber Technologies (NYSE:UBER)
Historical Stock Chart
From Apr 2023 to Apr 2024
