0001665918
false
0001665918
2023-10-23
2023-10-23
iso4217:USD
xbrli:shares
iso4217:USD
xbrli:shares
UNITED STATES
SECURITIES AND EXCHANGE COMMISSION
Washington, D.C. 20549
FORM 8-K
CURRENT REPORT
Pursuant to Section 13 or 15(d) of
The Securities Exchange Act of 1934
Date of Report (Date of Earliest Event Reported):
October 23, 2023
US Foods Holding Corp.
(Exact name of registrant as specified in its
charter)
| |
|
|
|
|
| Delaware |
|
001-37786 |
|
26-0347906 |
| (State or other jurisdiction of incorporation) |
|
(Commission File Number) |
|
(I.R.S. Employer Identification No.) |
9399 W. Higgins Road,
Suite 100, Rosemont, IL 60018
(Address of principal executive offices) (Zip Code)
(847) 720-8000
(Registrant’s telephone number, including area
code)
Not Applicable
(Former name, former address and former fiscal year,
if changed since last report)
Check the appropriate box below if the Form 8-K filing is intended to simultaneously
satisfy the filing obligation of the registrant under any of the following provisions:
| ☐ | Written
communications pursuant to Rule 425 under the Securities Act (17 CFR 230.425) |
| ☐ | Soliciting
material pursuant to Rule 14a-12 under the Exchange Act (17 CFR 240.14a-12) |
| ☐ | Pre-commencement
communications pursuant to Rule 14d-2(b) under the Exchange Act (17 CFR 240.14d-2(b)) |
| ☐ | Pre-commencement
communications pursuant to Rule 13e-4(c) under the Exchange Act (17 CFR 240.13e-4(c)) |
Securities registered pursuant to Section 12(b) of the Act:
| |
|
|
|
|
| Title of each class |
|
Trading Symbol(s) |
|
Name of each exchange on which registered |
| Common Stock, Par Value $0.01 |
|
USFD |
|
New York Stock Exchange |
Indicate by check mark whether the registrant is an
emerging growth company as defined in as defined in Rule 405 of the Securities Act of 1933 (§230.405 of this chapter) or Rule 12b-2
of the Securities Exchange Act of 1934 (§240.12b-2 of this chapter).
| ☐ | If an
emerging growth company, indicate by check mark if the registrant has elected not to use the extended transition period for complying
with any new or revised financial accounting standards provided pursuant to Section 13(a) of the Exchange Act. |
| Item 7.01. | Regulation FD Disclosure |
The presentation furnished herewith
as Exhibit 99.1 is being provided to certain shareholders, on or after October 23, 2023, as part of the Company’s shareholder engagement
program.
The information contained in
this Item 7.01 as well as in Exhibit 99.1 is furnished and shall not be deemed “filed” for purposes of Section 18 of the Securities
Exchange Act of 1934 (as amended, the “Exchange Act”) or otherwise subject to the liabilities of that Section, and
shall not be or be deemed to be incorporated by reference into any of the Company’s filings under the Securities Act of 1933, as
amended, or the Exchange Act.
| Item 9.01. | Financial Statements and Exhibits. |
(d) Exhibits.
Exhibit No. Description
| 99.1 | Shareholder Engagement Presentation (Fall 2023). |
| 104 | Cover Page Interactive Data File (embedded within the Inline
XBRL document). |
SIGNATURES
Pursuant to the requirements of the Exchange Act, the
registrant has duly caused this report to be signed on its behalf by the undersigned hereunto duly authorized.
| |
US FOODS HOLDING CORP. |
|
| |
|
|
|
| |
|
|
|
| Date: October 23, 2023 |
By: |
/s/ Stephanie D. Miller |
|
| |
|
Name: Stephanie D. Miller |
|
|
| |
|
Title: Corporate Secretary |
|
|
| |
|
|
|
US Foods Holding Corp. 8-K
Exhibit 99.1

Environmental, Social & Governance Update Fall 2023

Cautionary Statements Regarding Forward - Looking Information Statements in this presentation which are not historical in nature, are “forward - looking statements” within the meaning of the f ederal securities laws. These statements often include words such as “believe,” “expect,” “project,” “anticipate,” “intend,” “plan,” “outlook,” “estimate,” “target,” “seek, ” “ will,” “may,” “would,” “should,” “could,” “forecast,” “mission,” “strive,” “more,” “goal,” or similar expressions (although not all forward - looking statements may contain such words) and are based upon various assumptions and our experience in the industry, as well as historical trends, current conditions, and expected future developments. However, you should understand that these statements are not guarantees of performance or results and there are a number of risks, uncertainties and other important factors that coul d c ause our actual results to differ materially from those expressed in the forward - looking statements, including, among others: economic factors affecting consumer confidence and d iscretionary spending and reducing the consumption of food prepared away from home; cost inflation/deflation and commodity volatility; competition; reliance on thir d p arty suppliers and interruption of product supply or increases in product costs; changes in our relationships with customers and group purchasing organizations; our ability to in crease or maintain the highest margin portions of our business; achievement of expected benefits from cost savings initiatives; increases in fuel costs; changes in consumer ea tin g habits; cost and pricing structures; the impact of climate change or related legal, regulatory or market measures; impairment charges for goodwill, indefinite - lived intangible assets or other long - lived assets; the impact of governmental regulations; product recalls and product liability claims; our reputation in the industry; labor relations and i ncr eased labor costs and continued access to qualified and diverse labor; indebtedness and restrictions under agreements governing our indebtedness; interest rate increases; our re pla cement of the London Interbank Offered Rate with an alternative reference rate; disruption of existing technologies and implementation of new technologies; cybersecurity in cidents and other technology disruptions; risks associated with intellectual property, including potential infringement; effective integration of acquired businesses; potent ial costs associated with shareholder activism; changes in tax laws and regulations and resolution of tax disputes; certain provisions in our governing documents; health and sa fety risks to our associates and related losses; adverse judgments or settlements resulting from litigation; extreme weather conditions, natural disasters and other catastrop hic events; and management of retirement benefits and pension obligations. For a detailed discussion of these risks, uncertainties and other factors that could cause our results to differ materially f rom those anticipated or expressed in any forward - looking statements, see the section entitled “Risk Factors” in our Annual Report on Form 10 - K for the fiscal year ended December 31, 2022 filed with the Securities and Exchange Commission (“SEC”) on February 17, 2023. Additional risks and uncertainties are discussed from time to time in curre nt, quarterly and annual reports filed by the Company with the SEC, which are available on the SEC’s website at www.sec.gov and the Company’s investor relations page at ww w.i r.usfoods.com. Additionally, we operate in a highly competitive and rapidly changing environment; new risks and uncertainties may emerge from time to time, and it is no t possible to predict all risks nor identify all uncertainties. The forward - looking statements contained in this presentation speak only as of the date of this presentation and are based on information and estimates available to us at this time. We undertake no obligation to update or revise any forward - looking statements, except as may be re quired by law. The inclusion of information in this report is not an indication that the Company deems such information to be material or im por tant to an understanding of the business or an investment decision with respect to the Company's securities. Disclaimer Page 1

USFD Company Overview

US Foods Distribution Center States with CHEF’STORE Stores US Foods – At a Glance 3

4

Continued Progress Across the Business in Q2 2023 • Grew total case volume 3%, led by growth in independents, healthcare and hospitality • Grew Adjusted EBITDA 17% to a new quarterly record • Expanded Adjusted EBITDA margin 60 bps • Continued market share gains with independent restaurants for ninth consecutive quarter • Largely completed next generation customer digital platform (MOXē) rollout to local customers and readying for national customer deployment • Expanded VITALS toolset usage to bring added value to customers by helping them more effectively manage overall costs • Significantly improved safety results • Continued improvement in productivity and turnover • Sustained positive results from flexible scheduling; rolled out to additional pilot markets and readying for broader H2 deployment • Reduced net leverage to 3.0x; debt upgraded by credit rating agencies • Pre - paid $60 million of term loan and reduced floating rate exposure via $450 million interest rate caps • Repurchased $166 million in shares • Acquired Renzi Foodservice in Q3 Expanded Industry Leading Customer Experience Position Delivered on Capital Allocation Priorities Delivered Strong Financial Results (1) Continued Supply Chain Excellence Progress 5 (1) All non - GAAP measures referenced herein are from the Company’s Q2 2023 financial statements. Reconciliations of all such non - GAAP measures are provided in the attached Appendix, which was also included in the Company’s Q2 2023 earnings presentation.

Environmental, Social and Governance (ESG) Update

Key ESG Highlights Governance – Track record of governance best practices, led by high quality, experienced and diverse Board of Directors, including restoration of single class of common stock in 2023 Planet – Reduced absolute Scope 1 and Scope 2 greenhouse gas (GHG) emissions by 13% from our 2019 climate goal baseline Product – Offered 2,600+ local, sustainable and well - being Exclusive Brand products (+13% from 2021) and distributed more than 2.4 million cases of Serve Good Responsible Disposable products (+14% from 2019) People – Filled 47% of new or open leadership roles with women or people of color, exceeding our 40% goal 7

Food Industry Supply Chain & Logistics CEO Leadership Sustainability & Corporate Responsibility Accounting/Finance Risk Management Technology Marketing & Strategy Human Capital Management Other Public Company Boards Knowledge, Skills & Experience Highly - experienced Board with unique backgrounds, qualifications and skills providing effective oversight Demographics & Tenure 3.7 years Average Tenure 11 1 Independent Non-Independent 25% 8% 8% 58% Women Black Asian 42% Diverse 4 7 1 Over 65 Between 50 and 65 Under 50 62 Average Age 92% Independent 7 5 Less than 5 yrs Between 5 and 10 yrs 8

Governance Highlights Declassified Board – all directors elected annually x Majority vote standard in uncontested director elections x Independent Chair of the Board x No shareholder rights plan (poison pill) x Annual say - on - pay vote, with more than 80% support each year x Annual Board and committee self - evaluations x Shareholders can amend bylaws without a supermajority vote x Regular Enhancements Since IPO in 2016 x Expanded Nominating and Corporate Governance Committee Charter to reflect oversight of CSR strategies x Added directors and refreshed Committee membership x Removed supermajority vote standard to remove directors x Adopted majority vote standard in uncontested director elections with director resignation policy x Appointed Lead Independent Director IPO through 2021 x Separated Chair / CEO roles x Refreshed 3 of 4 committee chairs and rotated Committee assignments x Added directors to Nom / Gov and Compensation Committees x Expanded Compensation and Human Capital Committee charter to capture its human capital oversight responsibilities 2022 x Eliminated multiple classes of stock through cancellation of Series A Preferred Stock x Restored right of common stockholders to elect all directors x Amended and restated Company Charter to apply federal forum selection to Securities Act disputes and to extend exculpation provisions to Company officers 2023 Commitment to High Standards of Corporate Governance Regular enhancements demonstrate Board’s commitment to best practices and responsiveness to shareholder feedback 9

2021 Contacted 60% of our outstanding stock Met with 35% of our outstanding stock 2022 Contacted 80% of our outstanding stock Met with 63% of our outstanding stock Shareholder Engagement By the Numbers Commitment to Proactive Shareholder Engagement • US Foods recognizes the value of listening to our shareholders and considering their perspectives • Throughout the year, we maintain an ongoing dialogue with our stockholders to discuss their areas of focus and to provide updates on our corporate governance, executive compensation, sustainability and human capital management programs • The feedback we receive from our shareholders is carefully reviewed and informs our Board’s agenda • During 2022 and in the spring of 2023, we held extensive discussions with shareholders to better understand their perspectives, including on the following topics: □ Strategic priorities □ Financial growth plans □ Board composition and refreshment □ Proposed governance updates □ Executive compensation □ Labor relations □ Corporate social responsibility 10

• Drove Net Sales of $9.1 Billion (+2.1% from Q2 2022) • Increased Gross Profit 15% to $1.6 Billion and Net Income to $182 Million • Delivered Record Adjusted EBITDA of $432 Million • Expanded Adjusted EBITDA Margin by 60 bps • Repurchased $166 Million of Shares and Prepaid $60 Million of Debt • Signed definitive agreement for Renzi Foodservice acquisition, our first tuck - in M&A transaction since pre - pandemic, which closed in Q3 2023 • Focused on winning under our four pillars of Culture, Service, Growth and Profit • Improved year - over - year safety results by ~20% Experienced Public Company CEO is Driving Shareholder Value Base Salary 4% Annual Cash Incentive 7% Annual Long - Term Incentive Award 25% Make Whole RSUs 34% Make Whole PSUs 20% Make Whole Cash 10% Total at - risk compensation 86% ▪ Base Salary: $1.3 million ▪ Target Annual Incentive Bonus Opportunity: 150% of Base Salary ▪ Target Annual LTIP Award: 555% of Base Salary (50% RSUs; 50% PSUs) ▪ Make Whole Compensation for Forfeited Awards: • One - time sign on awards to account for cash / equity awards that forfeited at his prior employer • RSUs with a grant date value of $10 million (ratable vesting over 3 years) • PSUs with a grant date value of $6 million, which vest on attainment stock price goals (two tranches – >$40/share and >$55/share for 30 consecutive trading days) + continued service • Cash award of $3 million (no longer subject to forfeiture) Overview of CEO Compensation David E. Flitman • 35 years of relevant industry experience • Former President and Chief Executive Officer of Builders FirstSource and BMC Stock Holdings • Deep foodservice and distribution industry experience including executive roles at Performance Food Group • Track record of driving operational excellence, profitable growth, shareholder returns and a people - centric, high - performing culture Q2 2023 Highlights (1) 11 (1) All non - GAAP measures referenced herein are from the Company’s Q2 2023 financial statements. Reconciliations of all such non - GAAP measures are provided in the attached Appendix, which was also included in the Company’s Q2 2023 earnings presentation.

Executive Pay Aligned with Shareholder Interests Compensation Program Balances Performance Orientation and Shareholder Alignment Elements of Executive Pay and Related Objectives • Attracts talent and supports retention • Forms basis for AIP target award Base Salary • Links executive pay to US Foods’ financial performance • Drives the achievement of annual business objectives • 2023 AIP design includes primary Adjusted EBITDA metric (80%) and a new secondary metric (20%) regarding distribution cost per case, replacing local and national market share, which sends a strong signal to the entire organization that operational improvements are critical to achieving our long - range plan Annual Incentive Plan (AIP) Award • 50% of Long - Term Incentive Plan mix • Encourages executive retention through multi - year vesting schedule • Supports long - range plan by providing executive officers with an ownership stake in US Foods and aligning interests with those of our stockholders Restricted Stock Units (RSUs) • 50% of Long - Term Incentive Plan mix • Maintained Adjusted EBITDA growth rate (70%) and Return on Invested Capital (30%) PSU mix • Incentivize achievement of three - year financial goals and link executive pay to US Foods’ financial performance • Supports long - range plan by providing executive officers with an ownership stake in US Foods and aligning interests with those of our stockholders Performance Share Units (PSUs) • Compensate executives for leadership and performance during a period of transition • Ensure short - and medium - term stability across the US Foods’ leadership team Special Retention Awards 12
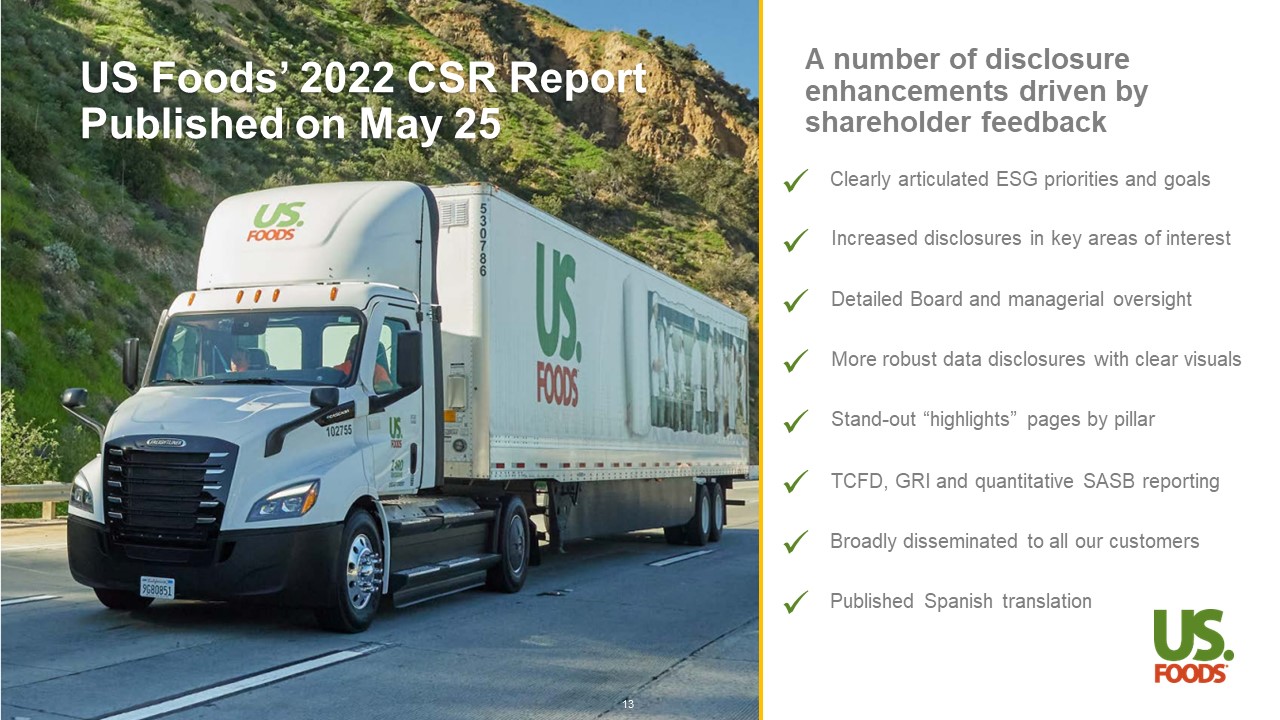
US Foods’ 2022 CSR Report Published on May 25 x x x x x x x x Clearly articulated ESG priorities and goals Increased disclosures in key areas of interest Detailed Board and managerial oversight More robust data disclosures with clear visuals Stand - out “highlights” pages by pillar TCFD, GRI and quantitative SASB reporting Broadly disseminated to all our customers Published Spanish translation A number of disclosure enhancements driven by shareholder feedback 13

2022 CSR Report Highlights Continued Progress Across Key Environment, Social and Governance Issues Planet x Reduced absolute Scope 1 and Scope 2 GHG emissions 13% from a 2019 climate goal baseline year x Reported first - ever scope 3 GHG footprint x Enhanced select SASB disclosures with quantitative metrics to provide increased transparency on environmental performance x Took delivery of our first 40 electric trucks x Decreased emissions intensity ( - 19%) and energy intensity ( - 10%) against 2015 baseline (1)(2) People x Filled 47% of new or open leadership roles with women or people of color – exceeding our annual goal of 40% x Increased diverse representation across all job levels and added new workforce diversity metrics to provide increased workforce transparency x Spent $723M with certified diverse suppliers and $2.4B with small businesses – a 27% combined spend increase over 2021 – and introduced new economic impact data Products x Offered 2,600+ local, sustainable and well - being Exclusive Brand products (+13% over 2021) x Distributed more than 2.4 million cases of Serve Good Responsible Disposable products (+14% over 2019) x Maintained commitment since 2019 to use only certified sustainable palm oil in 100% of Exclusive Brand products x Updated Responsible Sourcing Policy and Supplier Code of Conduct to reflect recognized supply chain management frameworks (1) Emissions intensity measured as pounds of CO2e per case delivered. Includes the Food Group and Smart Foodservice acquisitions . (2) Energy intensity is measured in kilowatt hours per case shipped. 14
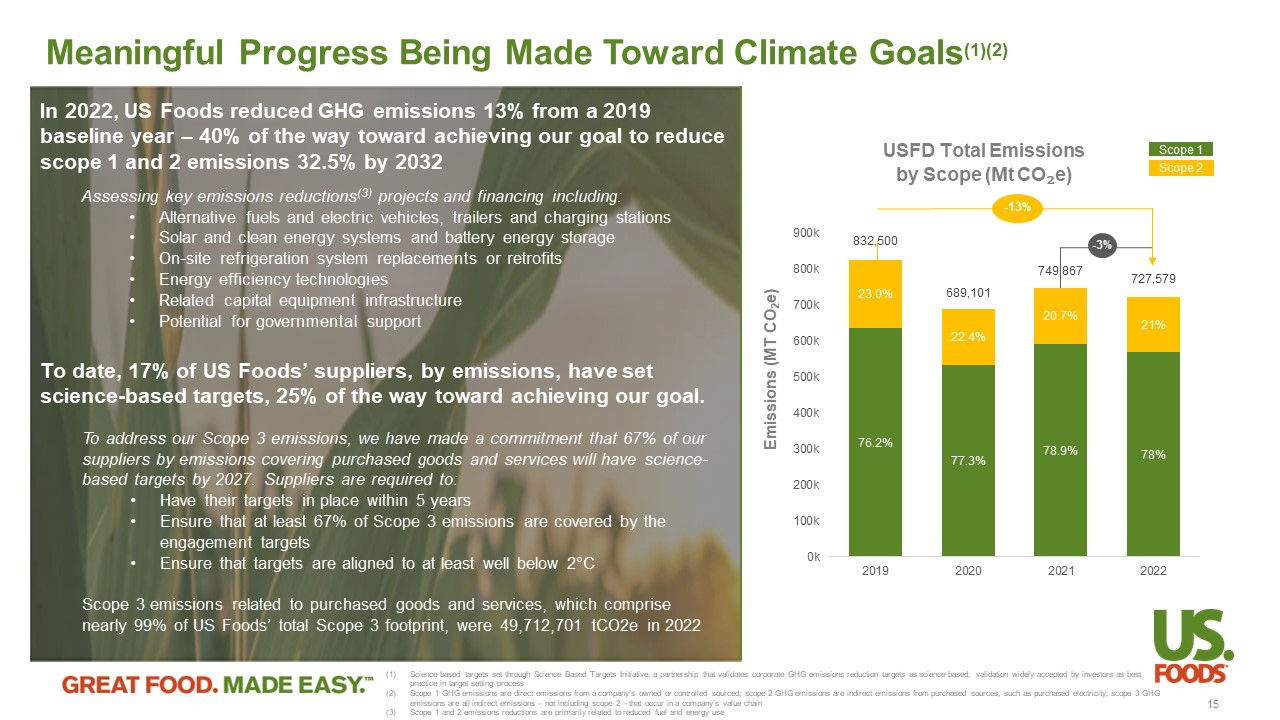
Meaningful Progress Being Made Toward Climate Goals (1)(2) Assessing key emissions reductions (3) projects and financing including : • Alternative fuels and electric vehicles, trailers and charging stations • Solar and clean energy systems and battery energy storage • On - site refrigeration system replacements or retrofits • Energy efficiency technologies • Related capital equipment infrastructure • Potential for governmental support USFD Total Emissions by Scope (Mt CO ₂ e) Emissions (MT CO 2 e) 76.2% 77.3% 78.9% 78% 23.0% 22.4% 20.7% 21% 832,500 689,101 749,867 727,579 0k 100k 200k 300k 400k 500k 600k 700k 800k 900k 2019 2020 2021 2022 Scope 1 Scope 2 - 3% - 13% In 2022, US Foods reduced GHG emissions 13% from a 2019 baseline year – 40% of the way toward achieving our goal to reduce scope 1 and 2 emissions 32.5% by 2032 To address our Scope 3 emissions, we have made a commitment that 67% of our suppliers by emissions covering purchased goods and services will have science - based targets by 2027. Suppliers are required to: • Have their targets in place within 5 years • Ensure that at least 67% of Scope 3 emissions are covered by the engagement targets • Ensure that targets are aligned to at least well below 2 ƒ C Scope 3 emissions related to purchased goods and services, which comprise nearly 99% of US Foods’ total Scope 3 footprint, were 49,712,701 tCO2e in 2022 To date, 17% of US Foods’ suppliers, by emissions, have set science - based targets, 25% of the way toward achieving our goal. (1) Science - based targets set through Science Based Targets Initiative, a partnership that validates corporate GHG emissions reduction targets as science - based; validation widely accepted by investors a s best practice in target setting process (2) Scope 1 GHG emissions are direct emissions from a company’s owned or controlled sourced; scope 2 GHG emissions are indirect emis sions from purchased sources, such as purchased electricity; scope 3 GHG emissions are all indirect emissions – not including scope 2 – that occur in a company’s value chain (3) Scope 1 and 2 emissions reductions are primarily related to reduced fuel and energy use 15

16 *Figures include trade and indirect spend with Tier 1 suppliers 0 100 200 300 400 500 600 700 800 2018 2019 2020 2021 2022 Program Development Suppliers Spend ($M) Our supplier diversity program enhances our network of vendor partnerships with small businesses and companies that are owned and operated by a diverse spectrum of people consisting of women, minorities, veterans, LGBT+ and individuals with disabilities Memberships $723M + with ~500 certified diverse suppliers* $2.4B+ with 2,600+ small businesses* 32,785 total jobs supported in FY 2022 $1.92B total wages in FY 2022 2022 Highlights Growing Relationships with Diverse Suppliers 16

Providing local, sustainable and well - being products Product sustainability is integrated via our Hungry For Better program which provides strategic guardrails for the development of products that are local, sustainable and/or support well - being with an emphasis on products that are innovative and on - trend The program assesses social and environmental benefits and prioritizes where we can have the greatest impact Hungry For Better program supports our goals to grow sustainable product revenue and case growth year - over - year 2,600+ Exclusive Brand products in the Hungry For Better program 12% of all E xclusive Brand products qualified for the Hungry For Better program 90+ Serve Local suppliers 1,700+ well - being products Hungry for Better ▪ Launched in 2018 , our Serve Local program better connects our customers with their regional farmers, producers and/or manufacturers ▪ Serve Local products are sourced within 400 miles of where the products ship or within the state from where the products ship ▪ Developed with suppliers that are committed to our defined standards for responsible practices ▪ Launched climate - conscious pillar to ensure Serve Good products reduce GHG emissions ▪ Come with a third - party verified claim of responsible sourcing or contribution to waste reduction ▪ Arrive in packaging that meets our strict standards , designed to minimize waste and prioritize use of recycled materials ▪ Supports consumer needs by offering a growing portfolio of products with clean and simple ingredients, plant - forward attributes or positive nutrient claims ▪ Includes products with simple, recognizable ingredients , as well as products that can satisfy specific dietary preferences Serve Local Serve Good Well - Being 17

Innovative products, currently being produced by the Company, are helping to reduce greenhouse gas emissions Serve Good’s Newest Pillar – Climate - Conscious Climate - Friendly Re sult in lower GHG emissions than 70% of all products assessed by HowGood Carbon - Negative Remove more GHG from the atmosphere than they emit, a s verified by a third - party lifecycle analysis against international standards Carbon - Neutral Result in products where the total amount of GHG emissions produced is effectively canceled out by actions that remove or reduce an equal amount of GHG emissions from the atmosphere 18

Embracing Diversity and Inclusion Our commitment to diversity and inclusion is grounded in three strategic areas of focus Creating a more inclusive work environment where everyone feels safe, valued and that their voices matter Increasing the diversity of our workforce and leaders by investing in programs to build a diverse talent pipeline and accelerate the development of our underrepresented associates Supporting underserved communities and businesses by enhancing our outreach 56% of our associates were women or people of color as of January 1, 2023, up from 54% in January 2022 47% of our new or open leadership roles were filled by women or people of color in 2022 Coordinated 72 pairings for our 2022 cohort of the Learning Partners Program Launched D&I training for Culinary & Restaurant Operations Onboarded five external talent - attraction partners Assigned Bias Training eLearning to 10,000+ associates, managers and leaders Expanded functional representation dashboards designed to assess progress towards a holistic and innovative workforce Sponsored 9 Employee Resource Groups that provide community and education across the organization; 11,000 associates attended more than 95 events Hosted D&I Regional Roundtable in partnership with the Multicultural Foodservice & Hospitality Alliance Introduced and conducted ten Power of Dialogue Sessions to understand D&I awareness, readiness and opportunities 1 2 3 19

Enhanced Demographic Disclosure* In response to shareholder feedback, we have provided increased transparency on demographic metrics, including race and ethnicity, for multiple employment levels 20 *Graphs show Company’s proxy disclosures for workforce diversity, as of January 1, 2023
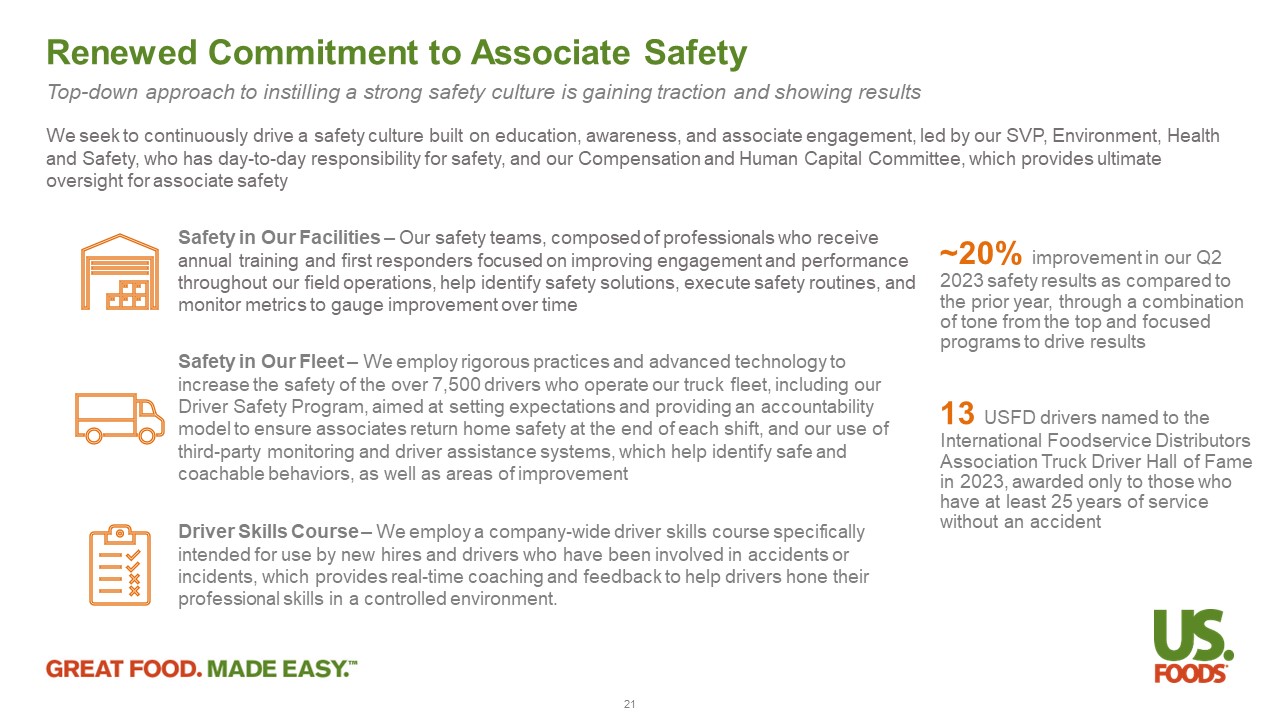
Renewed Commitment to Associate Safety Top - down approach to instilling a strong safety culture is gaining traction and showing results 21 ~20 % improvement in our Q2 2023 safety results as compared to the prior year, through a combination of tone from the top and focused programs to drive results 13 USFD drivers named to the International Foodservice Distributors Association Truck Driver Hall of Fame in 2023, awarded only to those who have at least 25 years of service without an accident We seek to continuously drive a safety culture built on education, awareness, and associate engagement, led by our SVP, Envir onm ent, Health and Safety, who has day - to - day responsibility for safety, and our Compensation and Human Capital Committee, which provides ultim ate oversight for associate safety Safety in Our Facilities – Our safety teams, composed of professionals who receive annual training and first responders focused on improving engagement and performance throughout our field operations, help identify safety solutions, execute safety routines, and monitor metrics to gauge improvement over time Safety in Our Fleet – We employ rigorous practices and advanced technology to increase the safety of the over 7,500 drivers who operate our truck fleet, including our Driver Safety Program, aimed at setting expectations and providing an accountability model to ensure associates return home safety at the end of each shift, and our use of third - party monitoring and driver assistance systems, which help identify safe and coachable behaviors, as well as areas of improvement Driver Skills Course – We employ a company - wide driver skills course specifically intended for use by new hires and drivers who have been involved in accidents or incidents, which provides real - time coaching and feedback to help drivers hone their professional skills in a controlled environment.

Corporate Social Responsibility 2023 Noteworthy Company for Diversity DiversityInc 2023 America’s Most Innovative Companies Fortune Magazine 2023 Top - Rated ESG Company Sustainalytics 2023 America’s Best Large Employers Newsweek 2023 W orld's Most Trustworthy Companies Newsweek 2023 America's Greatest Workplaces for Parents and Families, Women, and Diversity Newsweek 22

Appendix: Q2 Fiscal 2023 Summary Non - GAAP Reconciliations

Quarterly Case Volume Trend vs. Prior Year Independent Restaurant Case Growth (1)(2) YOY percent change for total and organic cases 0.2% 74.4% 25.1% 20.6% 9.2% 0.3% 2.9% 5.8 % 7.8 % 4.8 % 8.1% 79.1% Q1 Q2 Q3 Q4 Q1 Q2 Q3 Q4 Q1 Q2 Organic Case Growth by Quarter (1)(2) YOY percent change -30% -20% -10% 0% 10% 20% 30% 40% 50% 60% 70% 80% Q1 Q2 Q3 Q4 Q1 Q2 Q3 Q4 Q1 Q2 Independent Restaurants Healthcare/Hospitality All Other 2021 Acquisitions Organic (6.4%) 50.3% 18.5% 13.1% 4.1% (0.4%) 0.7% 2.6 % 5.4 % 2.7 % (0.9%) 53.5% Q1 Q2 Q3 Q4 Q1 Q2 Q3 Q4 Q1 Q2 2021 2022 2022 2023 2023 2021 2022 2023 24 Acquisitions Organic (1) Independent restaurant case growth was negatively impacted by approximately 70 basis points for Q2’23 from slower growth in C HEF ’STORE due to system conversion challenges, which are largely resolved. Broadline independent restaurant case growth for Q2’23 was 5.5%. (2) Case volume results exclude the impact of the 53 rd week in the fourth quarter of fiscal 2020 and fiscal 2021. Total Case Growth (2) YOY percent change for total and organic cases

• Net leverage expected to be below 3.0x by year - end • Repaid $71M and $66M on 2019 and 2021 Incremental Term Loan Facilities in Q1 and Q2 2023 respectively • SOFR was 5.10% as of July 1, 2023 • 2 - year 5% interest rate caps on $450M of notional value against term loans (3) • A 100 bps increase in SOFR would result in ~$15M additional interest expense and ($0.04) reduction in Adjusted Diluted EPS (1) US Foods Debt Summary (1) Reconciliations of these non - GAAP measures are provided in this Appendix (2) Floating Rate % includes the impact of interest rate caps (3) The Company's maximum exposure to the variable component of interest will be 5% on the notional amount covered by interest ra te caps $ Millions Maturity Interest Terms Interest Rate as of July 1, 2023 Carrying Value as of July 1, 2023 Carrying Value as of January 1, 2023 ABL Facility December 7, 2027 - - - 2019 Incremental Term Loan Facility (net of $14 and $19 of unamortized deferred financing costs, respectively) September 13, 2026 SOFR + 2.11% 7.22% 1,170 1,232 2021 Incremental Term Loan Facility (net of $4 and $6 of unamortized deferred financing costs, respectively) November 22, 2028 SOFR + 2.86% 7.97% 717 786 Total Floating Rate Debt 1,887 2,018 Secured Senior Notes due 2025 (net of $5 and $7 of unamortized deferred financing costs, respectively) April 15, 2025 6.25% 995 993 Unsecured Senior Notes due 2029 (net of $7 and $7 of unamortized deferred financing costs,respectively) February 15, 2029 4.75% 893 893 Unsecured Senior Notes due 2030 (net of $4 and $4 of unamortized deferred financing costs, respectively) June 1, 2030 4.625% 496 496 Obligations under financing leases 2023-2040 1.26%-8.31% 472 446 Other Debt January 1, 2031 5.75% 8 8 Total Fixed Rate 2,864 2,836 Total Debt 4,751 4,854 Less: Cash (379) (211) Net Debt (1) 4,372 4,643 Net Leverage Ratio (1) 3.0x 3.5x % Floating Rate (2) 31% 42% 25

Second Quarter Financial Performance Note : Figures may not foot due to rounding 1. R econciliations of these non - GAAP measures are provided in this Appendix . 2. GAAP Diluted EPS calculated using net income available to common shareholders . Adjusted Diluted EPS is calculated as Adjusted net income divided by Non - GAAP weighted average diluted shares outstanding . 3. Represents Adjusted EBITDA as a percentage of Net Sales . Adjusted (1) (unaudited) Reported (unaudited) 13 Weeks Ended 13 Weeks Ended Change July 2, 2022 July 1, 2023 Change July 2, 2022 July 1, 2023 ($ in millions, except per share data) 2.7% Case Growth 2.1% 8,827 9,013 Net Sales 8.8% 1,448 1,576 15.0% 1,383 1,591 Gross Profit 110 bps 16.4% 17.5% 200 bps 15.7% 17.7% % of Net Sales 5.6% 1,085 1,146 2.9% 1,233 1,269 Operating Expenses 40 bps 12.3% 12.7% 10 bps 14.0% 14.1% % of Net Sales 17.8% 169 199 160.0% 70 182 Net Income 17.9% $0.67 $0.79 170.4% $0.27 $0.73 Diluted EPS (2) 17.4% 368 432 Adjusted EBITDA 60 bps 4.2% 4.8% Adjusted EBITDA Margin (3) 26

Year to Date Financial Performance Note : Figures may not foot due to rounding 1. Reconciliations of these non - GAAP measures are provided in this Appendix . 2. GAAP Diluted EPS calculated using net income available to common shareholders . Adjusted Diluted EPS is calculated as Adjusted net income divided by Non - GAAP weighted average diluted shares outstanding . 3. Represents Adjusted EBITDA as a percentage of Net Sales . Adjusted (1) (unaudited) Reported (unaudited) 26 Weeks Ended 26 Weeks Ended Change July 2, 2022 July 1, 2023 Change July 2, 2022 July 1, 2023 ($ in millions, except per share data) 4.0% Case Growth 5.6% 16,625 17,555 Net Sales 11.3% 2,715 3,021 17.0% 2,578 3,016 Gross Profit 90 bps 16.3% 17.2% 170 bps 15.5% 17.2% % of Net Sales 6.5% 2,117 2,255 4.7% 2,394 2,507 Operating Expenses 10 bps 12.7% 12.8% (10) bps 14.4% 14.3% % of Net Sales 30.1% 249 324 319.0% 63 264 Net Income 30.3% $0.99 $1.29 425.0% $0.20 $1.05 Diluted EPS (2) 26.3% 609 769 Adjusted EBITDA 70 bps 3.7% 4.4% Adjusted EBITDA Margin (3) 27

Non - GAAP Reconciliation - Adjusted Gross Profit and Adjusted Operating Expenses (1) - (5) footnotes located on next slide 26 Weeks Ended 13 Weeks Ended (unaudited) (unaudited) July 2, 2022 July 1, 2023 July 2, 2022 July 1, 2023 ($ in millions) $2,578 $3,016 $1,383 $1,591 Gross profit (GAAP) 137 5 65 (15) LIFO reserve change (1) $2,715 $3,021 $1,448 $1,576 Adjusted Gross profit (Non - GAAP) $2,394 $2,507 $1,233 $1,269 Operating expenses (GAAP) Adjustments: (159) (171) (81) (84) Depreciation expense (22) (22) (11) (11) Amortization expense (21) (28) (9) (14) Share - based compensation expense (2) (29) (7) (15) (3) Business transformation costs (3) (2) — (2) — COVID - 19 other related expenses (4) (44) (24) (30) (11) Business acquisition and integration related costs and other (5) $2,117 $2,255 $1,085 $1,146 Adjusted Operating expenses (Non - GAAP) 28

Non - GAAP Reconciliation - Adjusted Gross Profit and Adjusted Operating Expenses 1. Represents the non - cash impact of LIFO reserve adjustments . 2. Share - based compensation expense for expected vesting of stock awards and employee stock purchase plan . 3. Transformational costs represent non - recurring expenses prior to formal launch of strategic projects with anticipated long - term benefits to the Company . These costs generally relate to third party consulting and non - capitalizable construction or technology . For the 13 weeks and 26 weeks ended July 1 , 2023 , business transformation costs related to projects associated with information technology infrastructure initiatives . For the 13 weeks and 26 weeks ended July 2 , 2022 , business transformation costs consist of new facility openings, supply chain strategy improvements, and information technology infrastructure initiatives . 4. Includes COVID - 19 related costs that we are permitted to addback for purposes of calculating Adjusted EBITDA under certain agreements governing our indebtedness . 5. Includes : (i) aggregate acquisition and integration related costs of $ 11 million and $ 6 million for the 13 weeks ended July 1 , 2023 and July 2 , 2022 , respectively and $ 21 million and $ 12 million for the 26 weeks ended July 1 , 2023 and July 2 , 2022 , respectively ; (ii) CEO sign on bonus of $ 3 million for the 26 weeks ended July 1 , 2023 (iii) contested proxy and related legal and consulting costs of $ 14 million for the 13 weeks ended July 2 , 2022 , and $ 21 million for the 26 weeks ended July 2 , 2022 , respectively ; and (iv) CEO severance for $ 5 million for the 13 and 26 weeks ended July 2 , 2022 and (v) other gains, losses or costs that we are permitted to addback for purposes of calculating Adjusted EBITDA under certain agreements governing our indebtedness . 29
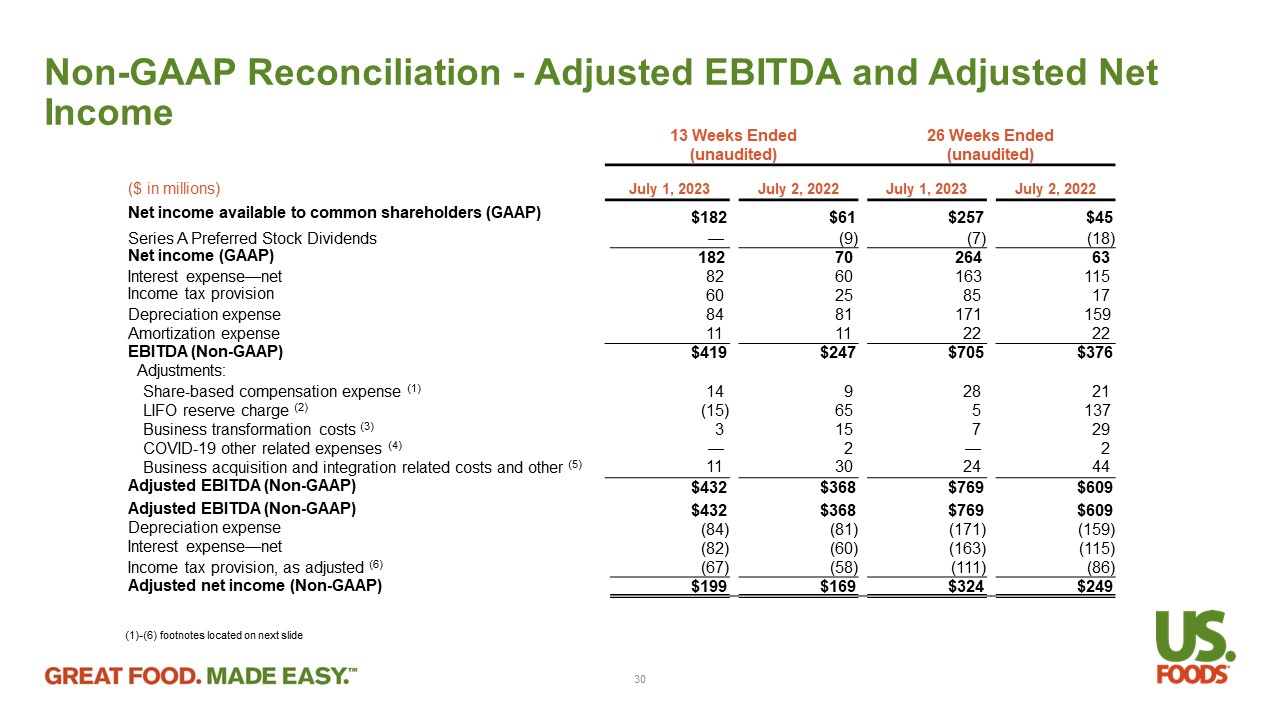
Non - GAAP Reconciliation - Adjusted EBITDA and Adjusted Net Income (1) - (6) footnotes located on next slide 26 Weeks Ended 13 Weeks Ended (unaudited) (unaudited) July 2, 2022 July 1, 2023 July 2, 2022 July 1, 2023 ($ in millions) $45 $257 $61 $182 Net income available to common shareholders (GAAP) (18) (7) (9) — Series A Preferred Stock Dividends 63 264 70 182 Net income (GAAP) 115 163 60 82 Interest expense — net 17 85 25 60 Income tax provision 159 171 81 84 Depreciation expense 22 22 11 11 Amortization expense $376 $705 $247 $419 EBITDA (Non - GAAP) Adjustments: 21 28 9 14 Share - based compensation expense (1) 137 5 65 (15) LIFO reserve charge (2) 29 7 15 3 Business transformation costs (3) 2 — 2 — COVID - 19 other related expenses (4) 44 24 30 11 Business acquisition and integration related costs and other (5) $609 $769 $368 $432 Adjusted EBITDA (Non - GAAP) $609 $769 $368 $432 Adjusted EBITDA (Non - GAAP) (159) (171) (81) (84) Depreciation expense (115) (163) (60) (82) Interest expense — net (86) (111) (58) (67) Income tax provision, as adjusted (6) $249 $324 $169 $199 Adjusted net income (Non - GAAP) 30

Non - GAAP Reconciliation - Adjusted EBITDA and Adjusted Net Income 1. Share - based compensation expense for expected vesting of stock awards and employee stock purchase plan . 2. Represents the non - cash impact of LIFO reserve adjustments . 3. Transformational costs represent non - recurring expenses prior to formal launch of strategic projects with anticipated long - term benefits to the Company . These costs generally relate to third party consulting and non - capitalizable construction or technology . For the 13 weeks and 26 weeks ended July 1 , 2023 , business transformation costs related to projects associated with information technology infrastructure initiatives . For the 13 weeks and 26 weeks ended July 2 , 2022 , business transformation costs consist of new facility openings, supply chain strategy improvements, and information technology infrastructure initiatives . 4. Includes COVID - 19 related costs that we are permitted to addback for purposes of calculating Adjusted EBITDA under certain agreements governing our indebtedness . 5. Includes : (i) aggregate acquisition and integration related costs of $ 11 million and $ 6 million for the 13 weeks ended July 1 , 2023 and July 2 , 2022 , respectively and $ 21 million and $ 12 million for the 26 weeks ended July 1 , 2023 and July 2 , 2022 , respectively ; (ii) CEO sign on bonus of $ 3 million for the 26 weeks ended July 1 , 2023 (iii) contested proxy and related legal and consulting costs of $ 14 million for the 13 weeks ended July 2 , 2022 , and $ 21 million for the 26 weeks ended July 2 , 2022 , respectively ; and (iv) CEO severance for $ 5 million for the 13 and 26 weeks ended July 2 , 2022 and (v) other gains, losses or costs that we are permitted to addback for purposes of calculating Adjusted EBITDA under certain agreements governing our indebtedness . 6. Represents our income tax provision adjusted for the tax effect of pre - tax items excluded from Adjusted net income and the removal of applicable discrete tax items . Applicable discrete tax items include changes in tax laws or rates, changes related to prior year unrecognized tax benefits, discrete changes in valuation allowances, and excess tax benefits associated with share - based compensation . The tax effect of pre - tax items excluded from Adjusted net income is computed using a statutory tax rate after taking into account the impact of permanent differences and valuation allowances . 31

Non - GAAP Reconciliation - Adjusted Diluted Earnings Per Share (EPS) ( 1) - (8) footnotes located on next slide 26 Weeks Ended 13 Weeks Ended (unaudited) (unaudited) July 2, 2022 July 1, 2023 July 2, 2022 July 1, 2023 $0.20 $1.05 $0.27 $0.73 Diluted EPS (GAAP) 0.08 0.11 0.04 0.06 Share - based compensation expense (1) 0.55 0.02 0.26 (0.06) LIFO reserve charge (2) 0.12 0.03 0.06 0.01 Business transformation costs (3) 0.01 — 0.01 — COVID - 19 other related expenses (4) 0.18 0.10 0.12 0.04 Business acquisition and integration related costs and other (5) (0.15) (0.02) (0.09) 0.01 Income tax provision, as adjusted (6) $ 0.99 $ 1.29 $ 0.67 $ 0.79 Adjusted Diluted EPS (Non - GAAP) (7) 251,120,642 251,389,602 250,908,286 250,991,512 Weighted - average diluted shares outstanding (Non - GAAP) (8) 32

Non - GAAP Reconciliation - Adjusted Diluted Earnings Per Share (EPS) 1. Share - based compensation expense for expected vesting of stock awards and employee stock purchase plan . 2. Represents the non - cash impact of LIFO reserve adjustments . 3. Transformational costs represent non - recurring expenses prior to formal launch of strategic projects with anticipated long - term benefits to the Company . These costs generally relate to third party consulting and non - capitalizable construction or technology . For the 13 weeks and 26 weeks ended July 1 , 2023 , business transformation costs related to projects associated with information technology infrastructure initiatives . For the 13 weeks and 26 weeks ended July 2 , 2022 , business transformation costs consist of new facility openings, supply chain strategy improvements, and information technology infrastructure initiatives . 4. Includes COVID - 19 related costs that we are permitted to addback for purposes of calculating Adjusted EBITDA under certain agreements governing our indebtedness . 5. Includes : (i) aggregate acquisition and integration related costs of $ 11 million and $ 6 million for the 13 weeks ended July 1 , 2023 and July 2 , 2022 , respectively and $ 21 million and $ 12 million for the 26 weeks ended July 1 , 2023 and July 2 , 2022 , respectively ; (ii) CEO sign on bonus of $ 3 million for the 26 weeks ended July 1 , 2023 (iii) contested proxy and related legal and consulting costs of $ 14 million for the 13 weeks ended July 2 , 2022 , and $ 21 million for the 26 weeks ended July 2 , 2022 , respectively ; and (iv) CEO severance for $ 5 million for the 13 and 26 weeks ended July 2 , 2022 and (v) other gains, losses or costs that we are permitted to addback for purposes of calculating Adjusted EBITDA under certain agreements governing our indebtedness . 6. Represents our income tax provision adjusted for the tax effect of pre - tax items excluded from Adjusted net income and the removal of applicable discrete tax items . Applicable discrete tax items include changes in tax laws or rates, changes related to prior year unrecognized tax benefits, discrete changes in valuation allowances, and excess tax benefits associated with share - based compensation . The tax effect of pre - tax items excluded from Adjusted net income is computed using a statutory tax rate after taking into account the impact of permanent differences and valuation allowances . 7. Adjusted Diluted EPS is calculated as Adjusted net income divided by weighted average diluted shares outstanding (Non - GAAP) . 8. For purposes of the Adjusted Diluted EPS calculation (Non - GAAP), when the Company has net income (GAAP), weighted average diluted shares outstanding (Non - GAAP) is used and assumes conversion of the Series A convertible preferred stock, and, when the Company has net loss (GAAP) and assumed conversion of the Series A convertible preferred stock would be antidilutive, weighted - average diluted shares outstanding (GAAP) is used . 33

Non - GAAP Reconciliation - Net Debt and Net Leverage Ratios (1) Trailing Twelve Months (TTM) Adjusted EBITDA (2) Net debt / TTM Adjusted EBITDA (unaudited) July 2, 2022 December 31, 2022 July 1, 2023 ($ in millions, except ratios) $5,020 $4,854 $4,751 Total Debt (GAAP) (197) (211) (379) Cash, cash equivalents and restricted cash $4,823 $4,643 $4,372 Net Debt (Non - GAAP) $1,161 $1,310 $1,470 Adjusted EBITDA (1) 4.2 3.5 3.0 Net Leverage Ratio (2) 34

v3.23.3
Cover
|
Oct. 23, 2023 |
| Cover [Abstract] |
|
| Document Type |
8-K
|
| Amendment Flag |
false
|
| Document Period End Date |
Oct. 23, 2023
|
| Entity File Number |
001-37786
|
| Entity Registrant Name |
US Foods Holding Corp.
|
| Entity Central Index Key |
0001665918
|
| Entity Tax Identification Number |
26-0347906
|
| Entity Incorporation, State or Country Code |
DE
|
| Entity Address, Address Line One |
9399 W. Higgins Road
|
| Entity Address, Address Line Two |
Suite 100
|
| Entity Address, City or Town |
Rosemont
|
| Entity Address, State or Province |
IL
|
| Entity Address, Postal Zip Code |
60018
|
| City Area Code |
(847)
|
| Local Phone Number |
720-8000
|
| Written Communications |
false
|
| Soliciting Material |
false
|
| Pre-commencement Tender Offer |
false
|
| Pre-commencement Issuer Tender Offer |
false
|
| Title of 12(b) Security |
Common Stock, Par Value $0.01
|
| Trading Symbol |
USFD
|
| Security Exchange Name |
NYSE
|
| Entity Emerging Growth Company |
false
|
| Entity Information, Former Legal or Registered Name |
Not Applicable
|
| X |
- DefinitionBoolean flag that is true when the XBRL content amends previously-filed or accepted submission.
| Name: |
dei_AmendmentFlag |
| Namespace Prefix: |
dei_ |
| Data Type: |
xbrli:booleanItemType |
| Balance Type: |
na |
| Period Type: |
duration |
|
| X |
- DefinitionFor the EDGAR submission types of Form 8-K: the date of the report, the date of the earliest event reported; for the EDGAR submission types of Form N-1A: the filing date; for all other submission types: the end of the reporting or transition period. The format of the date is YYYY-MM-DD.
| Name: |
dei_DocumentPeriodEndDate |
| Namespace Prefix: |
dei_ |
| Data Type: |
xbrli:dateItemType |
| Balance Type: |
na |
| Period Type: |
duration |
|
| X |
- DefinitionThe type of document being provided (such as 10-K, 10-Q, 485BPOS, etc). The document type is limited to the same value as the supporting SEC submission type, or the word 'Other'.
| Name: |
dei_DocumentType |
| Namespace Prefix: |
dei_ |
| Data Type: |
dei:submissionTypeItemType |
| Balance Type: |
na |
| Period Type: |
duration |
|
| X |
- DefinitionAddress Line 1 such as Attn, Building Name, Street Name
| Name: |
dei_EntityAddressAddressLine1 |
| Namespace Prefix: |
dei_ |
| Data Type: |
xbrli:normalizedStringItemType |
| Balance Type: |
na |
| Period Type: |
duration |
|
| X |
- DefinitionAddress Line 2 such as Street or Suite number
| Name: |
dei_EntityAddressAddressLine2 |
| Namespace Prefix: |
dei_ |
| Data Type: |
xbrli:normalizedStringItemType |
| Balance Type: |
na |
| Period Type: |
duration |
|
| X |
- Definition
+ References
+ Details
| Name: |
dei_EntityAddressCityOrTown |
| Namespace Prefix: |
dei_ |
| Data Type: |
xbrli:normalizedStringItemType |
| Balance Type: |
na |
| Period Type: |
duration |
|
| X |
- DefinitionCode for the postal or zip code
| Name: |
dei_EntityAddressPostalZipCode |
| Namespace Prefix: |
dei_ |
| Data Type: |
xbrli:normalizedStringItemType |
| Balance Type: |
na |
| Period Type: |
duration |
|
| X |
- DefinitionName of the state or province.
| Name: |
dei_EntityAddressStateOrProvince |
| Namespace Prefix: |
dei_ |
| Data Type: |
dei:stateOrProvinceItemType |
| Balance Type: |
na |
| Period Type: |
duration |
|
| X |
- DefinitionA unique 10-digit SEC-issued value to identify entities that have filed disclosures with the SEC. It is commonly abbreviated as CIK. Reference 1: http://www.xbrl.org/2003/role/presentationRef
-Publisher SEC
-Name Exchange Act
-Number 240
-Section 12
-Subsection b-2
| Name: |
dei_EntityCentralIndexKey |
| Namespace Prefix: |
dei_ |
| Data Type: |
dei:centralIndexKeyItemType |
| Balance Type: |
na |
| Period Type: |
duration |
|
| X |
- DefinitionIndicate if registrant meets the emerging growth company criteria. Reference 1: http://www.xbrl.org/2003/role/presentationRef
-Publisher SEC
-Name Exchange Act
-Number 240
-Section 12
-Subsection b-2
| Name: |
dei_EntityEmergingGrowthCompany |
| Namespace Prefix: |
dei_ |
| Data Type: |
xbrli:booleanItemType |
| Balance Type: |
na |
| Period Type: |
duration |
|
| X |
- DefinitionCommission file number. The field allows up to 17 characters. The prefix may contain 1-3 digits, the sequence number may contain 1-8 digits, the optional suffix may contain 1-4 characters, and the fields are separated with a hyphen.
| Name: |
dei_EntityFileNumber |
| Namespace Prefix: |
dei_ |
| Data Type: |
dei:fileNumberItemType |
| Balance Type: |
na |
| Period Type: |
duration |
|
| X |
- DefinitionTwo-character EDGAR code representing the state or country of incorporation.
| Name: |
dei_EntityIncorporationStateCountryCode |
| Namespace Prefix: |
dei_ |
| Data Type: |
dei:edgarStateCountryItemType |
| Balance Type: |
na |
| Period Type: |
duration |
|
| X |
- DefinitionThe exact name of the entity filing the report as specified in its charter, which is required by forms filed with the SEC. Reference 1: http://www.xbrl.org/2003/role/presentationRef
-Publisher SEC
-Name Exchange Act
-Number 240
-Section 12
-Subsection b-2
| Name: |
dei_EntityRegistrantName |
| Namespace Prefix: |
dei_ |
| Data Type: |
xbrli:normalizedStringItemType |
| Balance Type: |
na |
| Period Type: |
duration |
|
| X |
- DefinitionThe Tax Identification Number (TIN), also known as an Employer Identification Number (EIN), is a unique 9-digit value assigned by the IRS. Reference 1: http://www.xbrl.org/2003/role/presentationRef
-Publisher SEC
-Name Exchange Act
-Number 240
-Section 12
-Subsection b-2
| Name: |
dei_EntityTaxIdentificationNumber |
| Namespace Prefix: |
dei_ |
| Data Type: |
dei:employerIdItemType |
| Balance Type: |
na |
| Period Type: |
duration |
|
| X |
- DefinitionLocal phone number for entity.
| Name: |
dei_LocalPhoneNumber |
| Namespace Prefix: |
dei_ |
| Data Type: |
xbrli:normalizedStringItemType |
| Balance Type: |
na |
| Period Type: |
duration |
|
| X |
- DefinitionBoolean flag that is true when the Form 8-K filing is intended to satisfy the filing obligation of the registrant as pre-commencement communications pursuant to Rule 13e-4(c) under the Exchange Act. Reference 1: http://www.xbrl.org/2003/role/presentationRef
-Publisher SEC
-Name Exchange Act
-Number 240
-Section 13e
-Subsection 4c
| Name: |
dei_PreCommencementIssuerTenderOffer |
| Namespace Prefix: |
dei_ |
| Data Type: |
xbrli:booleanItemType |
| Balance Type: |
na |
| Period Type: |
duration |
|
| X |
- DefinitionBoolean flag that is true when the Form 8-K filing is intended to satisfy the filing obligation of the registrant as pre-commencement communications pursuant to Rule 14d-2(b) under the Exchange Act. Reference 1: http://www.xbrl.org/2003/role/presentationRef
-Publisher SEC
-Name Exchange Act
-Number 240
-Section 14d
-Subsection 2b
| Name: |
dei_PreCommencementTenderOffer |
| Namespace Prefix: |
dei_ |
| Data Type: |
xbrli:booleanItemType |
| Balance Type: |
na |
| Period Type: |
duration |
|
| X |
- DefinitionTitle of a 12(b) registered security. Reference 1: http://www.xbrl.org/2003/role/presentationRef
-Publisher SEC
-Name Exchange Act
-Number 240
-Section 12
-Subsection b
| Name: |
dei_Security12bTitle |
| Namespace Prefix: |
dei_ |
| Data Type: |
dei:securityTitleItemType |
| Balance Type: |
na |
| Period Type: |
duration |
|
| X |
- DefinitionName of the Exchange on which a security is registered. Reference 1: http://www.xbrl.org/2003/role/presentationRef
-Publisher SEC
-Name Exchange Act
-Number 240
-Section 12
-Subsection d1-1
| Name: |
dei_SecurityExchangeName |
| Namespace Prefix: |
dei_ |
| Data Type: |
dei:edgarExchangeCodeItemType |
| Balance Type: |
na |
| Period Type: |
duration |
|
| X |
- DefinitionBoolean flag that is true when the Form 8-K filing is intended to satisfy the filing obligation of the registrant as soliciting material pursuant to Rule 14a-12 under the Exchange Act. Reference 1: http://www.xbrl.org/2003/role/presentationRef
-Publisher SEC
-Name Exchange Act
-Section 14a
-Number 240
-Subsection 12
| Name: |
dei_SolicitingMaterial |
| Namespace Prefix: |
dei_ |
| Data Type: |
xbrli:booleanItemType |
| Balance Type: |
na |
| Period Type: |
duration |
|
| X |
- DefinitionTrading symbol of an instrument as listed on an exchange.
| Name: |
dei_TradingSymbol |
| Namespace Prefix: |
dei_ |
| Data Type: |
dei:tradingSymbolItemType |
| Balance Type: |
na |
| Period Type: |
duration |
|
| X |
- DefinitionBoolean flag that is true when the Form 8-K filing is intended to satisfy the filing obligation of the registrant as written communications pursuant to Rule 425 under the Securities Act. Reference 1: http://www.xbrl.org/2003/role/presentationRef
-Publisher SEC
-Name Securities Act
-Number 230
-Section 425
| Name: |
dei_WrittenCommunications |
| Namespace Prefix: |
dei_ |
| Data Type: |
xbrli:booleanItemType |
| Balance Type: |
na |
| Period Type: |
duration |
|
US Foods (NYSE:USFD)
Historical Stock Chart
From Jan 2025 to Feb 2025

US Foods (NYSE:USFD)
Historical Stock Chart
From Feb 2024 to Feb 2025
