Definitive Materials Filed by Investment Companies. (497)
June 18 2013 - 4:09PM
Edgar (US Regulatory)
Filed pursuant to Rule 497(e)
File Nos. 333-148624 and 811-22167
ALLIANZ FUNDS MULTI-STRATEGY TRUST
Supplement Dated June 18, 2013 to the
Statutory Prospectuses for Administrative Class and Class A, Class C, Class D, Class P, Class R and Class R6
Shares of Allianz Funds Multi-Strategy Trust, dated April 1, 2013 (as supplemented thereafter)
Disclosure Relating to AllianzGI Retirement 2015 Fund, AllianzGI Retirement 2020 Fund, AllianzGI
Retirement 2025 Fund, AllianzGI Retirement 2030 Fund, AllianzGI Retirement 2035 Fund, AllianzGI
Retirement 2040 Fund, AllianzGI Retirement 2045 Fund, AllianzGI Retirement 2050 Fund, and
AllianzGI Retirement 2055 Fund (the “Target Date Funds”)
Within the “Overview of Allianz Target Funds” section, the following paragraph is hereby added at the end of the subsection captioned
“Asset Allocation Process – First Step”:
The glidepath for the Target Date Funds is currently based on the asset allocations
of the Dow Jones Real Return Target Date Indices, which are indices designed to measure the performance of multi-asset-class portfolios and for use as benchmarks for “lifecycle” funds such as the Target Date Funds. In researching the
glidepath for the Target Date Funds and making the decision to base the glidepath on a public benchmark, the portfolio managers used data, research and analyses prepared by Risklab, which is a research center operated by an affiliate of the
Sub-Adviser and based in Germany. Risklab’s staff includes academic researchers and professionals who focus on matters relating to strategic asset allocation, risk management and quantitative market research. In connection with their continued
use of various research tools and services provided by Risklab, the portfolio managers of the Target Date Funds may commission reports that provide quantitative data on expected market returns and correlations, as well as illustrative portfolios
based on these numbers. The portfolio managers may, from time to time, direct Risklab to undertake special studies or research projects.
Please retain this Supplement for future reference.
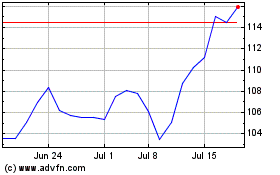
Visteon (NASDAQ:VC)
Historical Stock Chart
From Jun 2024 to Jul 2024

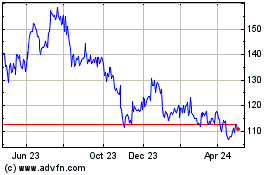
Visteon (NASDAQ:VC)
Historical Stock Chart
From Jul 2023 to Jul 2024
