| Important Statements (cont.)
17
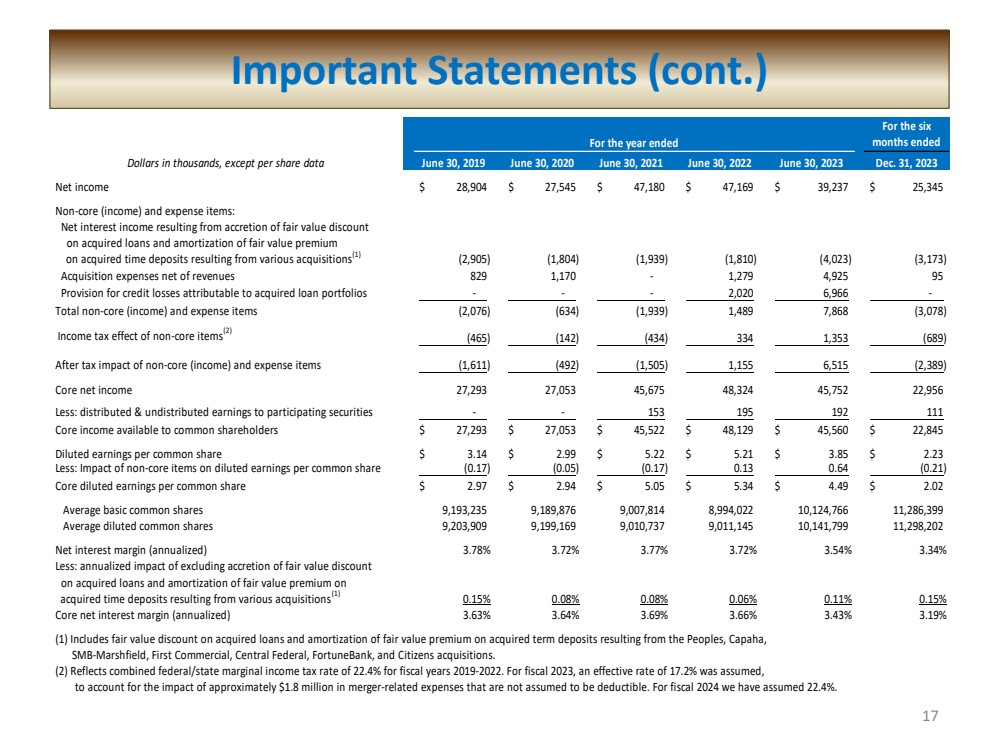
For the six
months ended
Dollars in thousands, except per share data June 30, 2019 June 30, 2020 June 30, 2021 June 30, 2022 June 30, 2023 Dec. 31, 2023
Net income $ 28,904 $ 27,545 $ 47,180 $ 47,169 $ 39,237 $ 25,345
Non-core (income) and expense items:
Net interest income resulting from accretion of fair value discount
on acquired loans and amortization of fair value premium
on acquired time deposits resulting from various acquisitions(1)
(2,905) (1,804) (1,939) (1,810) (4,023) (3,173)
Acquisition expenses net of revenues 829 1,170 - 1,279 4,925 95
Provision for credit losses attributable to acquired loan portfolios - - - 2,020 6,966 -
Total non-core (income) and expense items (2,076) (634) (1,939) 1,489 7,868 (3,078)
Income tax effect of non-core items(2)
(465) (142) (434) 334 1,353 (689)
After tax impact of non-core (income) and expense items (1,611) (492) (1,505) 1,155 6,515 (2,389)
Core net income 27,293 27,053 45,675 48,324 45,752 22,956
Less: distributed & undistributed earnings to participating securities - - 153 195 192 111
Core income available to common shareholders $ 27,293 $ 27,053 $ 45,522 $ 48,129 $ 45,560 $ 22,845
Diluted earnings per common share $ 3.14 $ 2.99 $ 5.22 $ 5.21 $ 3.85 $ 2.23
Less: Impact of non-core items on diluted earnings per common share (0.17) (0.05) (0.17) 0.13 0.64 (0.21)
Core diluted earnings per common share $ 2.97 $ 2.94 $ 5.05 $ 5.34 $ 4.49 $ 2.02
Average basic common shares 9,193,235 9,189,876 9,007,814 8,994,022 10,124,766 11,286,399
Average diluted common shares 9,203,909 9,199,169 9,010,737 9,011,145 10,141,799 11,298,202
Net interest margin (annualized) 3.78% 3.72% 3.77% 3.72% 3.54% 3.34%
Less: annualized impact of excluding accretion of fair value discount
on acquired loans and amortization of fair value premium on
acquired time deposits resulting from various acquisitions(1) 0.15% 0.08% 0.08% 0.06% 0.11% 0.15%
Core net interest margin (annualized) 3.63% 3.64% 3.69% 3.66% 3.43% 3.19%
(1) Includes fair value discount on acquired loans and amortization of fair value premium on acquired term deposits resulting from the Peoples, Capaha,
SMB-Marshfield, First Commercial, Central Federal, FortuneBank, and Citizens acquisitions.
(2) Reflects combined federal/state marginal income tax rate of 22.4% for fiscal years 2019-2022. For fiscal 2023, an effective rate of 17.2% was assumed,
to account for the impact of approximately $1.8 million in merger-related expenses that are not assumed to be deductible. For fiscal 2024 we have assumed 22.4%.
For the year ended |