false 0000763901 0000763901 2024-01-25 2024-01-25 0000763901 us-gaap:CommonStockMember 2024-01-25 2024-01-25 0000763901 us-gaap:CumulativePreferredStockMember 2024-01-25 2024-01-25
UNITED STATES
SECURITIES AND EXCHANGE COMMISSION
Washington, D.C. 20549
Form 8-K
CURRENT REPORT
Pursuant to Section 13 OR 15(d)
of the Securities Exchange Act of 1934
Date of Report (Date of earliest event reported): January 25, 2024
POPULAR, INC.
(Exact name of registrant as specified in its charter)
|
|
|
|
|
| Puerto Rico |
|
001-34084 |
|
66-0667416 |
| (State or other jurisdiction of incorporation or organization) |
|
(Commission File Number) |
|
(IRS Employer Identification Number) |
|
|
|
| 209 Muñoz Rivera Avenue Hato Rey, Puerto Rico |
|
00918 |
| (Address of principal executive offices) |
|
(Zip code) |
(787) 765-9800
(Registrant’s telephone number, including area code)
NOT APPLICABLE
(Former name, former address and former fiscal year, if changed since last report)
Check the appropriate box below if the Form 8-K filing is intended to simultaneously satisfy the filing obligation of the registrant under any of the following provisions (see General Instruction A.2. below):
| |
☐ |
Written communication pursuant to Rule 425 under the Securities Act (17 CFR 230.425) |
| |
☐ |
Soliciting material pursuant to Rule 14a-12 under the Exchange Act (17 CFR 240.14a-12) |
| |
☐ |
Pre-commencement communication pursuant to Rule 14d-2(b) under the Exchange Act (17 CFR 240.14d-2(b)) |
| |
☐ |
Pre-commencement communication pursuant to Rule 13e-4(c) under the Exchange Act (17 CFR 240.13e-4(c)) |
Securities registered pursuant to Section 12(b) of the Act:
|
|
|
|
|
| Title of each class |
|
Trading Symbol(s) |
|
Name of each exchange on which registered |
| Common Stock ($0.01 par value) |
|
BPOP |
|
The NASDAQ Stock Market |
| 6.125% Cumulative Monthly Income Trust Preferred Securities |
|
BPOPM |
|
The NASDAQ Stock Market |
Indicate by check mark whether the registrant is an emerging growth company as defined in Rule 405 of the Securities Act of 1933 (§230.405 of this chapter) or Rule 12b-2 of the Securities Exchange Act of 1934 (§240.12b-2 of this chapter).
Emerging growth company ☐
If an emerging growth company, indicate by check mark if the registrant has elected not to use the extended transition period for complying with any new or revised financial accounting standards provided pursuant to Section 13(a) of the Exchange Act. ☐
| Item 2.02. |
Results of Operations and Financial Condition. |
On January 25, 2024, Popular, Inc. (the “Corporation”) issued a press release announcing its unaudited financial results for the quarter ended December 31, 2023, a copy of which is attached as Exhibit 99.1 to this Current Report on Form 8-K.
The information furnished pursuant to this Item 2.02 of this Current Report on Form 8-K, including Exhibit 99.1, shall not be deemed “filed” for purposes of the Securities Exchange Act of 1934, as amended, nor shall it be incorporated by reference into any of the Corporation’s filings under the Securities Act of 1933, as amended, unless otherwise expressly stated in such filing.
| Item 7.01. |
Regulation FD Disclosure. |
The Corporation is furnishing information regarding its conference call to discuss its financial results for the quarter ended December 31, 2023. A copy of the presentation to be used by the Corporation on the conference call is attached hereto as Exhibit 99.2.
The information furnished pursuant to this Item 7.01 of this Current Report on Form 8-K, including Exhibit 99.2, shall not be deemed “filed” for purposes of the Securities Exchange Act of 1934, as amended, nor shall it be incorporated by reference into any of the Corporation’s filings under the Securities Act of 1933, as amended, unless otherwise expressly stated in such filing.
| Item 9.01. |
Financial Statements and Exhibits. |
Exhibits 99.1 and 99.2 shall not be deemed to be “filed” for purposes of the Securities Exchange Act of 1934, as amended.
SIGNATURE
Pursuant to the requirements of the Securities Exchange Act of 1934, as amended, the registrant has duly caused this report to be signed on its behalf by the undersigned hereunto duly authorized.
|
|
|
|
|
|
|
| |
|
|
|
POPULAR, INC. (Registrant) |
|
|
|
|
| Date: January 25, 2024 |
|
|
|
By: |
|
/s/ Jorge J. García |
|
|
|
|
|
|
Jorge J. García |
|
|
|
|
|
|
Senior Vice President and Corporate Comptroller |
Exhibit 99.1

Popular, Inc. Announces Fourth Quarter 2023 Financial Results
| |
• |
|
Net income of $94.6 million in Q4 2023, compared to net income of $136.6 million in Q3 2023;
excluding the $45.3 million after-tax impact during the fourth quarter of the FDIC Special Assessment (defined below), adjusted net income was $139.9 million. |
| |
• |
|
Net income of $541.3 million for the year 2023, compared to net income of $1.1 billion for the year
2022. Excluding the effects of the FDIC Special Assessment, the adjusted net income for the year 2023 was $586.6 million, compared to an adjusted net income of $807.8 million for the year 2022, excluding the effects of the partial release
of $68.2 million of the deferred tax asset valuation allowance and the $226.6 million impact of the completed Evertec Transactions and related accounting adjustments, in which the Corporation acquired certain critical channels from
Evertec, Inc. (“Evertec”) and completed the sale of its shares of Evertec. |
| |
• |
|
Net interest income amounted to $534.2 million, flat compared to Q3 2023. |
| |
• |
|
Net interest margin of 3.08% in Q4 2023, compared to 3.07% in Q3 2023; net interest margin on a taxable
equivalent basis of 3.26% in Q4 2023, compared to 3.24% in Q3 2023. |
| |
• |
|
Non-interest income of $168.7 million, an increase of
$9.2 million compared to Q3 2023. |
| |
• |
|
Operating expenses amounted to $531.1 million, including the
before-tax $71.4 million FDIC Special Assessment; an increase of $65.2 million compared to Q3 2023. Excluding the FDIC Special Assessment, operating expenses decreased by $6.2 million.
|
| |
• |
|
Non-performing loans held-in-portfolio (“NPLs”) decreased by $3.9 million from Q3 2023; NPLs to loans ratio at 1.0% vs. 1.1% in Q3 2023; |
| |
• |
|
Net charge-offs (“NCOs”) increased by $24.3 million from Q3 2023; annualized NCOs at 0.66% of
average loans held-in-portfolio vs. 0.39% in Q3 2023; |
| |
• |
|
Allowance for credit losses (“ACL”) to loans held-in-portfolio at 2.08% vs. 2.09% in Q3 2023; and |
| |
• |
|
ACL to NPLs at 204.0% vs. 196.7% in Q3 2023. |
| |
• |
|
Loans ending balances increased by $1.0 billion and by $1.0 billion in average quarterly balances,
from Q3 2023. |
| |
• |
|
Ending deposit balances increased by $280.6 million while average quarterly balances increased by
$285.9 million, from Q3 2023. |
| |
• |
|
Common Equity Tier 1 ratio of 16.30%, Common Equity per Share of $71.03 and Tangible Book Value per Share of
$59.74 at December 31, 2023. |
SAN JUAN, Puerto Rico – (BUSINESS WIRE) – Popular, Inc. (the “Corporation,”
“Popular,” “we,” “us,” “our”) (NASDAQ:BPOP) reported net income of $94.6 million for the quarter ended December 31, 2023, compared to net income of $136.6 million for the quarter ended
September 30, 2023. Excluding the impact during the fourth quarter of the FDIC Special Assessment, adjusted net income was $139.9 million.
Ignacio Alvarez, President and Chief Executive Officer, said: “We delivered solid fourth quarter and year-end results and entered 2024 with strong
momentum. Notwithstanding the interest rate environment and the disruptions in the banking market early in the year, we were able to maintain stable net interest income as we grew loans by approximately $1 billion during the quarter and a total
of $3 billion for the full year.
We continued to experience strong client activity during the year, growing our customer base in
Puerto Rico by 34,000 reflecting the continued strength of the local economy and our diversified product offerings. Excluding the gain from the Evertec transaction in 2022, we grew non-interest income by $11 million. While we saw some credit
normalization in our consumer portfolios, credit quality remained strong. We were also able to manage our operating expenses at the same time we continued to invest in our transformation efforts.
Our CET1 ratio at year-end was 16.3% and our tangible equity increased by 33%, or $14.77 per share. Our strong liquidity and capital
ratios position us well to continue to support responsible growth in 2024.
I would like to express my gratitude and appreciation to our
employees for all their hard work and dedication during the year. While conscious that we are living in a period of great uncertainty, the outlook for the macroenvironment in Puerto Rico remains positive and we look forward to 2024 with
optimism.”
1
Significant Events
FDIC Special Assessment
On
November 16, 2023, the Federal Deposit Insurance Corporation (“FDIC”) approved a final rule that imposes a special assessment (the “FDIC Special Assessment”) to recover the losses to the deposit insurance fund
(“DIF”) resulting from the FDIC’s use, in March 2023, of the systemic risk exception to the least-cost resolution test under the Federal Deposit Insurance Act in connection with the receiverships of several failed banks.
Under the final rule, the assessment base for the special assessment is equal to an insured depository institution’s (“IDI”) estimated
uninsured deposits, as reported in the IDI’s December 31, 2022 Call Report, excluding the first $5 billion in estimated uninsured deposits. For a holding company that has more than one IDI subsidiary, such as Popular, the
$5 billion exclusion is allocated among the company’s IDI subsidiaries in proportion to each IDI’s estimated uninsured deposits. The special assessments would be collected at an annual rate of approximately 13.4 basis points per year
(3.35 basis points per quarter) over eight quarters in 2024 and 2025, with the first assessment period beginning January 1, 2024. In their December 31, 2022 Call Reports, Banco Popular de Puerto Rico (“BPPR”) and Popular Bank
(“PB”) reported estimated uninsured deposits of approximately $28.1 billion, including $16.2 billion in fully collateralized public sector deposits, and $3.5 billion, respectively. The Corporation recorded an expense of
$71.4 million, $45.3 million net of tax, in the fourth quarter of 2023, representing the full amount of the assessment.
Increase in
quarterly common stock dividends
During the fourth quarter of 2023, the Corporation declared a quarterly common stock cash dividend of $0.62
per share, an increase of $0.07, or 13%, compared to the $0.55 per share declared by the Corporation in the third quarter of 2023.
|
|
|
|
|
|
|
|
|
|
|
|
|
|
|
|
|
|
|
|
|
| Earnings Highlights |
|
|
|
|
|
|
|
|
|
|
|
|
|
|
|
|
|
|
| (Unaudited) |
|
Quarters ended |
|
|
Years ended |
|
| (Dollars in thousands, except per share information) |
|
31-Dec-23 |
|
|
30-Sep-23 |
|
|
31-Dec-22 |
|
|
31-Dec-23 |
|
|
31-Dec-22 |
|
| Net interest income |
|
$ |
534,180 |
|
|
$ |
534,020 |
|
|
$ |
559,566 |
|
|
$ |
2,131,524 |
|
|
$ |
2,167,359 |
|
| Provision for credit losses |
|
|
78,663 |
|
|
|
45,117 |
|
|
|
49,531 |
|
|
|
208,609 |
|
|
|
83,030 |
|
|
|
|
|
|
|
|
|
|
|
|
|
|
|
|
|
|
|
|
|
|
| Net interest income after provision for credit losses |
|
|
455,517 |
|
|
|
488,903 |
|
|
|
510,035 |
|
|
|
1,922,915 |
|
|
|
2,084,329 |
|
| Other non-interest income |
|
|
168,743 |
|
|
|
159,549 |
|
|
|
158,465 |
|
|
|
650,724 |
|
|
|
897,062 |
|
| Operating expenses |
|
|
531,145 |
|
|
|
465,984 |
|
|
|
461,708 |
|
|
|
1,898,100 |
|
|
|
1,746,420 |
|
|
|
|
|
|
|
|
|
|
|
|
|
|
|
|
|
|
|
|
|
|
| Income before income tax |
|
|
93,115 |
|
|
|
182,468 |
|
|
|
206,792 |
|
|
|
675,539 |
|
|
|
1,234,971 |
|
| Income tax (benefit) expense |
|
|
(1,479 |
) |
|
|
45,859 |
|
|
|
(50,347 |
) |
|
|
134,197 |
|
|
|
132,330 |
|
|
|
|
|
|
|
|
|
|
|
|
|
|
|
|
|
|
|
|
|
|
| Net income |
|
$ |
94,594 |
|
|
$ |
136,609 |
|
|
$ |
257,139 |
|
|
$ |
541,342 |
|
|
$ |
1,102,641 |
|
|
|
|
|
|
|
|
|
|
|
|
|
|
|
|
|
|
|
|
|
|
| Net income applicable to common stock |
|
$ |
94,241 |
|
|
$ |
136,256 |
|
|
$ |
256,786 |
|
|
$ |
539,930 |
|
|
$ |
1,101,229 |
|
|
|
|
|
|
|
|
|
|
|
|
|
|
|
|
|
|
|
|
|
|
| Net income per common share-basic |
|
$ |
1.31 |
|
|
$ |
1.90 |
|
|
$ |
3.56 |
|
|
$ |
7.53 |
|
|
$ |
14.65 |
|
|
|
|
|
|
|
|
|
|
|
|
|
|
|
|
|
|
|
|
|
|
| Net income per common share-diluted |
|
$ |
1.31 |
|
|
$ |
1.90 |
|
|
$ |
3.56 |
|
|
$ |
7.52 |
|
|
$ |
14.63 |
|
|
|
|
|
|
|
|
|
|
|
|
|
|
|
|
|
|
|
|
|
|
Net interest income on a taxable equivalent basis – Non-GAAP financial
measure
Net interest income, on a taxable equivalent basis, is presented with its different components in Tables D and E for the quarter ended
December 31, 2023 and comparable quarters September 30, 2023 and December 31, 2022, respectively, and Table F for the year ended December 31, 2023 and 2022. Net interest income on a taxable equivalent basis is a non-GAAP financial measure. Management believes that this presentation provides meaningful information since it facilitates the comparison of revenues arising from taxable and
tax-exempt sources.
Non-GAAP financial measures used by the Corporation
may not be comparable to similarly named non-GAAP financial measures used by other companies.
2
Net interest income for the quarter ended December 31, 2023 was $534.2 million, flat when compared
to $534.0 million in the previous quarter. Net interest income on a taxable equivalent basis for the fourth quarter of 2023 was $564.8 million, compared to $563.7 million in the previous quarter, an increase of $1.1 million.
Net interest margin for the fourth quarter of 2023 was 3.08% compared with 3.07% in the prior quarter. On a taxable equivalent basis, net interest margin for
the fourth quarter of 2023 was 3.26%, compared to 3.24% for the prior quarter. The main quarter over quarter variances in net interest income on a taxable equivalent basis were:
| |
• |
|
Higher interest income from loans by $32.4 million resulting from an increase in average loans by
$995 million, reflecting increases in BPPR and PB of $729 million and $266 million, respectively. All major loan categories in BPPR increased, while at PB the increase was mainly in the commercial and construction portfolios. Loan
originations in a higher interest rate environment and the repricing of adjustable-rate loans resulted in a higher yield on loans by 17 basis points. All loan categories resulted in a higher yield quarter over quarter; |
partially offset by:
| |
• |
|
Lower interest income from investment securities, trading and money market investments by $8.7 million
driven mainly by lower volume of U.S. Treasury Securities, partially offset by stable volume of money market investments at a higher yield by seven basis points. The increase in the yield of money market investments is driven by the full quarter
effect of the 25 basis points increase in market rates that occurred at the end of July; and |
| |
• |
|
Higher interest expense on deposits by $25.1 million, mainly from the increase in cost of Puerto Rico
government deposits by 34 basis points, or $10.3 million, and a higher volume and cost of PB interest bearing deposits by $555 million and 34 basis points, respectively, or $12.6 million. |
Net interest income for the BPPR segment amounted to $454.9 million for the fourth quarter of 2023, an increase of $1.0 million when compared to
$453.9 million in net interest income during the third quarter of 2023. Net interest margin for the BPPR segment increased five basis points to 3.19% compared to 3.14% in the third quarter of 2023. The increase in net interest margin reflects a
higher volume of loans by $729 million across all loan categories, except construction loans, partially offset by a lower volume of investment securities, trading and money market investments by $1.6 billion driven by a decrease in
deposits of $1.0 billion and a higher cost of deposits, mainly Puerto Rico government deposits. Earning assets yield improved 14 basis points from 4.74% to 4.88% in Q4 2023. The cost of interest-bearing deposits increased by 16 basis points to
2.41% from 2.25% the previous quarter. The increase in the cost of deposits mainly resulted from the repricing of public funds. Total deposit cost in the fourth quarter of 2023 was 1.79%, compared to 1.68% in the third quarter of 2023, an increase
of 11 basis points.
Net interest income for PB was $85.6 million for the quarter ended December 31, 2023, a decrease of $1.8 million when
compared to $87.4 million during the previous quarter. Net interest margin decreased by 18 basis points in the quarter to 2.72%, compared to 2.90% in the third quarter of 2023. The decrease in net interest margin was mostly driven by a higher
cost of deposits, partially offset by a higher volume of loans and the repricing of adjustable-rate loans in the current interest rate environment. The cost of interest-bearing deposits was 3.66%, compared to 3.31% for the third quarter, or an
increase of 34 basis points, while total deposit cost was 3.17%, compared to 2.84% in the previous quarter.
Non-interest income
Non-interest income amounted to $168.7 million for the fourth quarter of 2023, an increase of $9.2 million
when compared to $159.5 million for the quarter ended September 30, 2023. The variance in non-interest income was driven primarily by:
| |
• |
|
a favorable variance in the fair value adjustment of equity securities by $3.6 million, mainly related to
securities held for deferred benefit plans, which have an offsetting effect in personnel costs; |
| |
• |
|
higher other service fees by $3.3 million due to an increase in contingent insurance commissions that are
typically received during the fourth quarter and higher debit and credit card fees due to higher transactional volumes; and |
| |
• |
|
a favorable variance in the adjustment for indemnity reserve on loans previously sold of $2.5 million.
|
Refer to Table B for further details.
3
Operating expenses
Operating expenses for the fourth quarter of 2023 totaled $531.1 million, including higher FDIC deposit insurance expense by $72.5 million due to the
impact of the FDIC Special Assessment, an increase of $65.2 million when compared to the third quarter of 2023. Excluding the effect of the FDIC Special Assessment, total expenses for the fourth quarter of 2023 were $459.7 million,
compared to $466.0 million in the previous quarter. During the fourth quarter of 2023, the Corporation incurred approximately $4.8 million in costs related to its technological and business process transformation initiative, compared to
$3.8 million in the previous quarter, mainly in professional services and personnel costs. During the year 2023, the Corporation incurred approximately $21.5 million in transformation related costs, compared to $24.6 million incurred
during the second half of the year 2022. The other variances in operating expenses for the quarter were driven primarily by:
| |
• |
|
higher other taxes expense by $6.0 million mainly due to an accrual reversal of $8.2 million during the
third quarter of 2023 related to regulatory examination fees in BPPR; |
| |
• |
|
higher business promotion expense by $4.8 million mainly due to $5.4 million of seasonal projects and
higher donations granted during the quarter; partially offset by lower customer rewards programs expense in our credit card business by $2.0 million; |
| |
• |
|
higher other operating expenses by $3.9 million mainly due to $1.4 million in higher sundry losses and
an unfavorable variance of $1.1 million in net gains/losses recognized on the sale of foreclosed auto units; |
| |
• |
|
higher technology and software expenses by $3.8 million mainly due to higher IT professional fees and
network management expenses due to various ongoing technology projects; and |
| |
• |
|
higher net occupancy expense by $2.2 million mainly due to an increase in buildings’ repairs and
maintenance costs; |
partially offset by:
| |
• |
|
a non-cash goodwill impairment of $23.0 million recorded during the
previous quarter in our U.S. based equipment leasing subsidiary due to lower forecasted cash flows and an increase in the rate used to discount cash flows; and |
| |
• |
|
lower processing and transactional services expense by $8.4 million mainly due to lower credit card
processing expenses by $7.1 million as a result of annual volume growth incentives recognized during the quarter; |
Full-time
equivalent employees were 9,088 as of December 31, 2023, compared to 9,063 as of September 30, 2023.
For a breakdown of operating expenses
by category refer to Table B.
4
Income taxes
For the quarter ended December 31, 2023, the Corporation recorded an income tax benefit of $1.5 million, compared to an income tax expense of
$45.9 million for the previous quarter. The positive variance of $47.4 million is mostly attributed to a lower income before tax of $89.4 million, primarily due to the FDIC Special Assessment; the remaining variance is related to tax
credits, higher exempt income, and other adjustments recorded during this quarter. The effective tax rate (“ETR”) for the 2023 fourth quarter was (1.6)%, compared to 25.1% for the third quarter. Excluding the impact of the FDIC Special
Assessment, the ETR for the fourth quarter was 15.0%, compared to 25.1% for the third quarter.
The Corporation’s ETR for the year 2023 was 19.9%;
excluding the FDIC Special Assessment, the ETR was 21.5%. The ETR of the Corporation is impacted by the composition and source of its taxable income. The Corporation expects its ETR for the year 2024 to be within a range from 19% to 23%.
Credit Quality
During the fourth quarter of 2023,
the Corporation continued to reflect credit quality normalization. Non-performing loans (“NPLs”) and net charge offs (“NCOs”) continued below historical
pre-pandemic averages. Consumer portfolios, however, reflected certain credit quality deterioration, particularly the personal loans and credit cards portfolios, with delinquencies and NCOs near or exceeding pre-pandemic levels. The auto loans portfolio also showed credit normalization, however, metrics remained below pre-pandemic levels. The commercial and mortgage
portfolios continue to operate with historically low levels of NCOs and NPLs. We continue to closely monitor changes in the macroeconomic environment and on borrower performance given higher interest rates and inflationary pressures. However,
management believes that the improvements over recent years in risk management practices and the risk profile of the Corporation’s loan portfolios position Popular to continue to operate successfully under the current environment.
The following presents credit quality results for the fourth quarter of 2023:
| |
• |
|
At December 31, 2023, total NPLs
held-in-portfolio decreased by $3.9 million from September 30, 2023. BPPR’s NPLs decreased by $5.1 million, mostly driven by lower mortgage NPLs by
$12.3 million, in part offset by higher consumer NPLs by $4.9 million. The commercial NPLs remained flat quarter-over-quarter, the result of an $17.9 million relationship inflow, offset by a $5.3 million collateral dependent loan
transferred to OREO, $6.4 million in loans returning to accrual status and $5.1 million in charge-offs. PB’s NPLs remained flat quarter-over-quarter. At December 31, 2023, the ratio of NPLs to total loans held-in-portfolio was 1.0%, compared to 1.1% in the third quarter of 2023. |
| |
• |
|
Inflows of NPLs
held-in-portfolio, excluding consumer loans, increased by $17.7 million quarter-over-quarter. In BPPR, total inflows increased by $15.0 million due to higher
commercial inflows by $19.3 million driven by the abovementioned $17.9 million single relationship, in part offset by lower mortgage inflows by $4.3 million. PB inflows increased by $2.7 million, driven by higher commercial
inflows. |
| |
• |
|
NCOs amounted to $56.9 million, increasing by $24.3 million when compared to the third quarter of 2023.
BPPR’s NCOs increased by $26.3 million quarter-over-quarter, mainly driven by higher commercial and consumer NCOs by $14.4 million and $11.2 million, respectively. The commercial NCO increase was mainly the result of a
$10.8 million recovery from a loan pay-off in the previous quarter, coupled with charge-offs on valuations of collateral dependent loans during the fourth quarter of 2023. The consumer NCO increase was
mainly driven by higher auto loans, personal loans and credit cards NCOs by $5.9 million, $3.1 million and $2.2 million, respectively. PB’s NCOs decreased by $2.0 million quarter-over-quarter, mainly driven by lower
commercial NCOs. During the fourth quarter of 2023, the Corporation’s ratio of annualized NCOs to average loans held-in-portfolio was 0.66%, compared to 0.39% in
the third quarter of 2023. Refer to Table N for further information on NCOs and related ratios. |
| |
• |
|
At December 31, 2023, the allowance for credit losses (“ACL”) increased by $18.3 million from
the third quarter of 2023 to $729.3 million. In BPPR the ACL increased by $15.3 million, primarily driven by a $10.0 million specific reserve for the $17.9 million new NPL mentioned above, loan growth and higher reserves for the
consumer portfolios attributable to changing credit quality. In PB the ACL increased by $2.9 million from the previous quarter, mainly driven by higher reserves for the commercial portfolio due to changes in ratings. |
| |
• |
|
The ACL incorporated updated macroeconomic scenarios for Puerto Rico and the United States. Given that any one
economic outlook is inherently uncertain, the Corporation leverages multiple scenarios to estimate its ACL. The baseline scenario continues to be assigned the highest probability, followed by the pessimistic scenario, and then the optimistic
scenario. |
5
| |
• |
|
The 2023 annualized GDP growth in the baseline scenario improved to 2.0% and 2.4% for Puerto Rico and the United
States, respectively, compared to 1.7% and 2.0% in the previous quarter. The 2023 forecasted average unemployment rate for Puerto Rico remained at 6.1% from previous forecast, while in the United States unemployment levels remained stable at 3.7%,
compared to 3.6% in the previous forecast. |
| |
• |
|
GDP growth is expected to slow down during 2024 for both regions, when compared to 2023, as a result of the
Fed’s monetary policy. The 2024 GDP growth is expected to be 1.21% for Puerto Rico and 1.65% for the United States. The average 2024 unemployment rate is expected to increase to 6.79% in Puerto Rico and 3.95% in the United States.
|
| |
• |
|
The Corporation’s ratio of the ACL to loans
held-in-portfolio was 2.08% in the fourth quarter of 2023, compared to 2.09% in the previous quarter. The ratio of the ACL to NPLs held-in-portfolio stood at 204.0%, compared to 196.7% in the previous quarter. |
| |
• |
|
The provision for credit losses for the loan portfolios for the fourth quarter of 2023 was $75.2 million,
compared to $43.5 million in the previous quarter, reflecting the previously mentioned changes in the allowance for credit losses. The provision for the BPPR segment was $67.2 million, compared to $54.0 million in the previous
quarter, while the provision for PB was $8.0 million, compared to a benefit of $10.5 million in the previous quarter. In the third quarter, the Corporation implemented a new model for the U.S. commercial real estate portfolio. The
implementation of this new model generated a $15.0 million reduction in reserves, which contributed to PB’s net benefit recorded in the third quarter. |
| |
• |
|
The provision for credit losses on our loan and lease portfolios, provision for unfunded loan commitments of
$3.7 million, and release for credit losses on our investment portfolio of $0.2 million for the fourth quarter are aggregated and presented in the provision for credit losses caption in our Consolidated Statement of Operations. For the
fourth quarter, these combined concepts resulted in a provision expense of $78.7 million, compared to $45.1 million in the previous quarter. |
Non-Performing Assets
|
|
|
|
|
|
|
|
|
|
|
|
|
| (Unaudited) |
|
|
|
|
|
|
|
|
|
| (In thousands) |
|
31-Dec-23 |
|
|
30-Sep-23 |
|
|
31-Dec-22 |
|
| Non-performing loans held-in-portfolio |
|
$ |
357,611 |
|
|
$ |
361,523 |
|
|
$ |
439,441 |
|
| Other real estate owned (“OREO”) |
|
|
80,416 |
|
|
|
82,322 |
|
|
|
89,126 |
|
|
|
|
|
|
|
|
|
|
|
|
|
|
| Total non-performing assets |
|
$ |
438,027 |
|
|
$ |
443,845 |
|
|
$ |
528,567 |
|
|
|
|
|
|
|
|
|
|
|
|
|
|
| Net charge-offs (recoveries) for the quarter |
|
$ |
56,947 |
|
|
$ |
32,655 |
|
|
$ |
31,200 |
|
|
|
|
|
|
|
|
|
|
|
|
|
|
| Ratios: |
|
|
|
|
|
|
|
|
|
|
|
|
| Loans
held-in-portfolio |
|
$ |
35,064,971 |
|
|
$ |
34,029,313 |
|
|
$ |
32,077,769 |
|
| Non-performing loans held-in-portfolio to loans held-in-portfolio |
|
|
1.02 |
% |
|
|
1.06 |
% |
|
|
1.37 |
% |
| Allowance for credit losses to loans held-in-portfolio |
|
|
2.08 |
|
|
|
2.09 |
|
|
|
2.25 |
|
| Allowance for credit losses to non-performing loans,
excluding loans held-for-sale |
|
|
203.95 |
|
|
|
196.69 |
|
|
|
163.91 |
|
Refer to Table L for additional information.
6
Provision for Credit Losses (Benefit) - Loan Portfolios
|
|
|
|
|
|
|
|
|
|
|
|
|
|
|
|
|
|
|
|
|
| (Unaudited) |
|
Quarters ended |
|
|
Years ended |
|
| (In thousands) |
|
31-Dec-23 |
|
|
30-Sep-23 |
|
|
31-Dec-22 |
|
|
31-Dec-23 |
|
|
31-Dec-22 |
|
| Provision for credit losses (benefit) - loan portfolios: |
|
|
|
|
|
|
|
|
|
|
|
|
|
|
|
|
|
|
|
|
| BPPR |
|
$ |
67,235 |
|
|
$ |
54,017 |
|
|
$ |
44,383 |
|
|
$ |
194,834 |
|
|
$ |
69,544 |
|
| Popular U.S. |
|
|
7,983 |
|
|
|
(10,503 |
) |
|
|
3,949 |
|
|
|
6,705 |
|
|
|
13,763 |
|
|
|
|
|
|
|
|
|
|
|
|
|
|
|
|
|
|
|
|
|
|
| Total provision for credit losses (benefit) - loan portfolios |
|
$ |
75,218 |
|
|
$ |
43,514 |
|
|
$ |
48,332 |
|
|
$ |
201,539 |
|
|
$ |
83,307 |
|
|
|
|
|
|
|
|
|
|
|
|
|
|
|
|
|
|
|
|
|
|
Credit Quality by Segment
|
|
|
|
|
|
|
|
|
|
|
|
|
| (Unaudited)
(In thousands) |
|
Quarters ended |
|
| BPPR |
|
31-Dec-23 |
|
|
30-Sep-23 |
|
|
31-Dec-22 |
|
| Provision for credit losses - loan portfolios |
|
$ |
67,235 |
|
|
$ |
54,017 |
|
|
$ |
44,383 |
|
| Net charge-offs |
|
|
51,913 |
|
|
|
25,600 |
|
|
|
19,846 |
|
| Total non-performing loans
held-in-portfolio |
|
|
328,718 |
|
|
|
333,825 |
|
|
|
402,009 |
|
| Annualized net charge-offs (recoveries) to average loans held-in-portfolio |
|
|
0.86 |
% |
|
|
0.44 |
% |
|
|
0.35 |
% |
| Allowance / loans
held-in-portfolio |
|
|
2.61 |
% |
|
|
2.63 |
% |
|
|
2.73 |
% |
| Allowance / non-performing loans held-in-portfolio |
|
|
194.65 |
% |
|
|
187.08 |
% |
|
|
153.12 |
% |
|
|
| |
|
Quarters ended |
|
| Popular U.S. |
|
31-Dec-23 |
|
|
30-Sep-23 |
|
|
31-Dec-22 |
|
| Provision for credit losses - loan portfolios |
|
$ |
7,983 |
|
|
$ |
(10,503 |
) |
|
$ |
3,949 |
|
| Net charge-offs |
|
|
5,034 |
|
|
|
7,055 |
|
|
|
11,354 |
|
| Total non-performing loans
held-in-portfolio |
|
|
28,893 |
|
|
|
27,698 |
|
|
|
37,432 |
|
| Annualized net charge-offs (recoveries) to average loans held-in-portfolio |
|
|
0.19 |
% |
|
|
0.28 |
% |
|
|
0.49 |
|
| Allowance / loans
held-in-portfolio |
|
|
0.85 |
% |
|
|
0.84 |
% |
|
|
1.10 |
% |
| Allowance / non-performing loans held-in-portfolio |
|
|
309.70 |
% |
|
|
312.42 |
% |
|
|
279.86 |
% |
Financial Condition Highlights
|
|
|
|
|
|
|
|
|
|
|
|
|
| (Unaudited) |
|
|
|
|
|
|
|
|
|
| (In thousands) |
|
31-Dec-23 |
|
|
30-Sep-23 |
|
|
31-Dec-22 |
|
| Cash and money market investments |
|
$ |
7,419,333 |
|
|
$ |
6,924,772 |
|
|
$ |
6,084,096 |
|
| Investment securities |
|
|
25,148,673 |
|
|
|
25,653,616 |
|
|
|
26,553,317 |
|
| Loans |
|
|
35,064,971 |
|
|
|
34,029,313 |
|
|
|
32,077,769 |
|
| Total assets |
|
|
70,758,155 |
|
|
|
69,736,936 |
|
|
|
67,637,917 |
|
| Deposits |
|
|
63,618,243 |
|
|
|
63,337,600 |
|
|
|
61,227,227 |
|
| Borrowings |
|
|
1,078,332 |
|
|
|
1,097,720 |
|
|
|
1,400,319 |
|
| Total liabilities |
|
|
65,611,202 |
|
|
|
65,279,328 |
|
|
|
63,544,492 |
|
| Stockholders’ equity |
|
|
5,146,953 |
|
|
|
4,457,608 |
|
|
|
4,093,425 |
|
7
Total assets amounted to $70.8 billion at December 31, 2023, an increase of $1.0 billion from
the third quarter of 2023, driven by:
| |
• |
|
an increase in loans
held-in-portfolio of $1.0 billion driven by an increase of $748.4 million at BPPR, mainly in the commercial portfolio as well as in mortgage and consumer
loans, and an increase of $287.3 million at PB mainly from commercial and construction loans; and |
| |
• |
|
a net increase in cash and money market investments of $494.6 million due to higher deposits and repayments
from the investment portfolio; |
partially offset by:
| |
• |
|
a decrease in securities
available-for-sale (“AFS”) of $400.8 million, mainly due to repayments and maturities, offset in part by favorable changes in the fair value of debt
securities; and |
| |
• |
|
a decrease in securities
held-to-maturity (“HTM”) of $107.5 million driven by maturities of U.S. Treasury securities, partially offset by the amortization of $44.2 million of
the discount related to U.S. Treasury securities previously reclassified from the AFS to HTM, which has an offsetting unrealized loss included within other comprehensive income that is also being accreted, resulting in a neutral effect to earnings.
|
Total liabilities increased by $331.9 million from the third quarter of 2023, driven by:
| |
• |
|
an increase of $280.6 million in deposits, mainly in time deposits and savings accounts at PB and demand
deposits and P.R. public sector accounts at BPPR, partially offset by a decrease in savings accounts at BPPR; and |
| |
• |
|
an increase of $70.6 million in other liabilities mainly due to the $71.4 million FDIC Special
Assessment recognized during the fourth quarter. |
Stockholders’ equity increased by $689.3 million from the third quarter of
2023, mainly due to the after-tax impact of the decrease in net unrealized losses in the portfolio of AFS securities of $593.2 million, the net income for the quarter of $94.6 million and the
amortization of unrealized losses from securities previously reclassified to HTM of $35.3 million, net of taxes, partially offset by common and preferred dividends declared during the quarter.
Common Equity Tier 1 ratio (“CET1”), common equity per share and tangible book value per share were 16.30%, $71.03 and $59.74, respectively, at
December 31, 2023, compared to 16.81%, $61.49 and $50.20, respectively, at September 30, 2023. Refer to Table A for capital ratios.
Refer to
Table C for the Statements of Financial Condition.
8
Cautionary Note Regarding Forward-Looking Statements
This press release contains “forward-looking statements” within the meaning of the U.S. Private Securities Litigation Reform Act of 1995, including
without limitation those regarding Popular’s business, financial condition, results of operations, plans, objectives and future performance. These statements are not guarantees of future performance, are based on management’s current
expectations and, by their nature, involve risks, uncertainties, estimates and assumptions. Potential factors, some of which are beyond the Corporation’s control, could cause actual results to differ materially from those expressed in, or
implied by, such forward-looking statements. Risks and uncertainties include, without limitation, the effect of competitive and economic factors, and our reaction to those factors, the adequacy of the allowance for loan losses, delinquency trends,
market risk and the impact of interest rate changes (including on our cost of deposits), our ability to attract deposits and grow our loan portfolio, capital market conditions, capital adequacy and liquidity, the effect of legal and regulatory
proceedings, new regulatory requirements or accounting standards on the Corporation’s financial condition and results of operations, the occurrence of unforeseen or catastrophic events, including extreme weather events, pandemics, man-made
disasters or acts of violence or war, as well as actions taken by governmental authorities in response thereto, and the direct and indirect impact of such events on Popular, our customers, service providers and third parties. Other potential factors
include Popular’s ability to successfully execute its transformation initiative, including, but not limited to, achieving projected earnings, efficiencies and return on tangible common equity and accurately anticipating costs and expenses
associated therewith, imposition of additional or special FDIC assessments, changes to regulatory capital, liquidity and resolution-related requirements applicable to financial institutions in response to recent developments affecting the banking
sector and the impact of bank failures or adverse developments at other banks and related negative media coverage of the banking industry in general on investor and depositor sentiment regarding the stability and liquidity of banks. All statements
contained herein that are not clearly historical in nature, are forward-looking, and the words “anticipate,” “believe,” “continues,” “expect,” “estimate,” “intend,” “project” and
similar expressions, and future or conditional verbs such as “will,” “would,” “should,” “could,” “might,” “can,” “may” or similar expressions, are generally intended to identify
forward-looking statements.
More information on the risks and important factors that could affect the Corporation’s future results and financial
condition is included in our Form 10-K for the year ended December 31, 2022, in our Form 10-Q for the quarters ended March 31, 2023, June 30, 2023, and
September 30, 2023 and in our Form 10-K for the year ended December 31, 2023 to be filed with the Securities and Exchange Commission. Our filings are available on the Corporation’s website
(www.popular.com) and on the Securities and Exchange Commission website (www.sec.gov). The Corporation assumes no obligation to update or revise any forward-looking statements or information which speak as of their respective dates.
About Popular, Inc.
Popular, Inc. (NASDAQ:
BPOP) is the leading financial institution in Puerto Rico, by both assets and deposits, and ranks among the top 50 U.S. bank holding companies by assets. Founded in 1893, Banco Popular de Puerto Rico, Popular’s principal subsidiary, provides
retail, mortgage and commercial banking services in Puerto Rico and the U.S. Virgin Islands. Popular also offers in Puerto Rico auto and equipment leasing and financing, investment banking, broker-dealer and insurance services through
specialized subsidiaries. In the mainland United States, Popular provides retail, mortgage and commercial banking services through its New York-chartered banking subsidiary, Popular Bank, which has branches located in New York, New Jersey and
Florida.
Conference Call
Popular will hold a
conference call to discuss its financial results today, Thursday, January 25, 2024 at 10:00 a.m. Eastern Time. The call will be broadcast live over the Internet and can be accessed through the Investor Relations section of the
Corporation’s website: www.popular.com.
Listeners are recommended to go to the website at least 15 minutes prior to the call to download and install
any necessary audio software. The call may also be accessed through a dial-in telephone number
1-833-470-1428 (Toll Free) or
1-404-975-4839 (Local). The dial-in access code is 803461.
A replay of the webcast will be archived in Popular’s website. A telephone replay will be available one hour after the end of the conference call through
Friday, February 23, 2024. The replay dial in is: 1-866-813-9403 or 1-929-458-6194. The replay passcode is 212082.
An electronic version of
this press release can be found at the Corporation’s website: www.popular.com.
9
Popular, Inc.
Financial Supplement to Fourth Quarter 2023 Earnings Release
Table A - Selected Ratios and Other Information
Table B -
Consolidated Statement of Operations
Table C - Consolidated Statement of Financial Condition
Table D - Analysis of Levels and Yields on a Taxable Equivalent Basis (Non-GAAP) - QUARTER
Table E - Analysis of Levels and Yields on a Taxable Equivalent Basis (Non-GAAP) - QUARTER
Table F - Analysis of Levels and Yields on a Taxable Equivalent Basis (Non-GAAP) - YEAR-TO-DATE
Table G - Mortgage Banking Activities and Other Service Fees
Table H - Loans and Deposits
Table I - Loan Delinquency - BPPR
Operations
Table J - Loan Delinquency - Popular U.S. Operations
Table K - Loan Delinquency - Consolidated
Table L - Non-Performing Assets
Table M - Activity in Non-Performing Loans
Table N - Allowance for Credit Losses, Net Charge-offs and Related Ratios
Table O - Allowance for Credit Losses ‘‘ACL’’ - Loan Portfolios - Consolidated
Table P - Allowance for Credit Losses ‘‘ACL’’ - Loan Portfolios - BPPR Operations
Table Q - Allowance for Credit Losses ‘‘ACL’’ - Loan Portfolios - Popular U.S. Operations
Table R - Reconciliation to GAAP Financial Measures
10
POPULAR, INC.
Financial Supplement to Fourth Quarter 2023 Earnings Release
Table A - Selected Ratios and Other Information
(Unaudited)
|
|
|
|
|
|
|
|
|
|
|
|
|
|
|
|
|
|
|
|
|
| |
|
Quarters ended |
|
|
Years ended |
|
| |
|
31-Dec-23 |
|
|
30-Sep-23 |
|
|
31-Dec-22 |
|
|
31-Dec-23 |
|
|
31-Dec-22 |
|
| Basic EPS |
|
$ |
1.31 |
|
|
$ |
1.90 |
|
|
$ |
3.56 |
|
|
$ |
7.53 |
|
|
$ |
14.65 |
|
| Diluted EPS |
|
$ |
1.31 |
|
|
$ |
1.90 |
|
|
$ |
3.56 |
|
|
$ |
7.52 |
|
|
$ |
14.63 |
|
| Average common shares outstanding |
|
|
71,810,073 |
|
|
|
71,794,934 |
|
|
|
72,101,177 |
|
|
|
71,710,265 |
|
|
|
75,147,263 |
|
| Average common shares outstanding - assuming dilution |
|
|
71,881,020 |
|
|
|
71,818,102 |
|
|
|
72,192,680 |
|
|
|
71,791,692 |
|
|
|
75,274,003 |
|
| Common shares outstanding at end of period |
|
|
72,153,621 |
|
|
|
72,127,595 |
|
|
|
71,853,720 |
|
|
|
72,153,621 |
|
|
|
71,853,720 |
|
| Market value per common share |
|
$ |
82.07 |
|
|
$ |
63.01 |
|
|
$ |
66.32 |
|
|
$ |
82.07 |
|
|
$ |
66.32 |
|
| Market capitalization - (In millions) |
|
$ |
5,922 |
|
|
$ |
4,545 |
|
|
$ |
4,765 |
|
|
$ |
5,922 |
|
|
$ |
4,765 |
|
| Return on average assets |
|
|
0.52 |
% |
|
|
0.75 |
% |
|
|
1.44 |
% |
|
|
0.76 |
% |
|
|
1.51 |
% |
| Return on average common equity |
|
|
5.55 |
% |
|
|
8.17 |
% |
|
|
16.59 |
% |
|
|
8.21 |
% |
|
|
18.39 |
% |
| Net interest margin (non-taxable equivalent
basis) |
|
|
3.08 |
% |
|
|
3.07 |
% |
|
|
3.28 |
% |
|
|
3.13 |
% |
|
|
3.11 |
% |
| Net interest margin (taxable equivalent basis) -non-GAAP |
|
|
3.26 |
% |
|
|
3.24 |
% |
|
|
3.64 |
% |
|
|
3.31 |
% |
|
|
3.46 |
% |
| Common equity per share |
|
$ |
71.03 |
|
|
$ |
61.49 |
|
|
$ |
56.66 |
|
|
$ |
71.03 |
|
|
$ |
56.66 |
|
| Tangible common book value per common share (non-GAAP)
[1] |
|
$ |
59.74 |
|
|
$ |
50.20 |
|
|
$ |
44.97 |
|
|
$ |
59.74 |
|
|
$ |
44.97 |
|
| Tangible common equity to tangible assets (non-GAAP)
[1] |
|
|
6.16 |
% |
|
|
5.25 |
% |
|
|
4.84 |
% |
|
|
6.16 |
% |
|
|
4.84 |
% |
| Return on average tangible common equity [1] |
|
|
6.32 |
% |
|
|
9.36 |
% |
|
|
19.23 |
% |
|
|
9.40 |
% |
|
|
21.13 |
% |
| Tier 1 capital |
|
|
16.36 |
% |
|
|
16.88 |
% |
|
|
16.45 |
% |
|
|
16.36 |
% |
|
|
16.45 |
% |
| Total capital |
|
|
18.13 |
% |
|
|
18.67 |
% |
|
|
18.26 |
% |
|
|
18.13 |
% |
|
|
18.26 |
% |
| Tier 1 leverage |
|
|
8.51 |
% |
|
|
8.41 |
% |
|
|
8.06 |
% |
|
|
8.51 |
% |
|
|
8.06 |
% |
| Common Equity Tier 1 capital |
|
|
16.30 |
% |
|
|
16.81 |
% |
|
|
16.39 |
% |
|
|
16.30 |
% |
|
|
16.39 |
% |
| [1] |
Refer to Table R for reconciliation to GAAP financial measures. |
11
POPULAR, INC.
Financial Supplement to Fourth Quarter 2023 Earnings Release
Table B - Consolidated Statement of Operations
(Unaudited)
|
|
|
|
|
|
|
|
|
|
|
|
|
|
|
|
|
|
|
|
|
|
|
|
|
|
|
|
|
| |
|
Quarters ended |
|
|
Variance |
|
|
Quarter ended |
|
|
Variance |
|
|
Years ended |
|
| |
|
|
|
|
|
|
|
Q4 2023 |
|
|
|
|
|
Q4 2023 |
|
|
|
|
|
|
|
| (In thousands, except per share information) |
|
31-Dec-23 |
|
|
30-Sep-23 |
|
|
vs. Q3 2023 |
|
|
31-Dec-22 |
|
|
vs. Q4 2022 |
|
|
31-Dec-23 |
|
|
31-Dec-22 |
|
| Interest income: |
|
|
|
|
|
|
|
|
|
|
|
|
|
|
|
|
|
|
|
|
|
|
|
|
|
|
|
|
| Loans |
|
$ |
623,438 |
|
|
$ |
596,886 |
|
|
$ |
26,552 |
|
|
$ |
522,042 |
|
|
$ |
101,396 |
|
|
$ |
2,331,654 |
|
|
$ |
1,876,166 |
|
| Money market investments |
|
|
100,840 |
|
|
|
99,286 |
|
|
|
1,554 |
|
|
|
50,908 |
|
|
|
49,932 |
|
|
|
366,625 |
|
|
|
118,080 |
|
| Investment securities |
|
|
143,214 |
|
|
|
148,614 |
|
|
|
(5,400 |
) |
|
|
140,244 |
|
|
|
2,970 |
|
|
|
547,028 |
|
|
|
471,665 |
|
|
|
|
|
|
|
|
|
|
|
|
|
|
|
|
|
|
|
|
|
|
|
|
|
|
|
|
|
|
| Total interest income |
|
|
867,492 |
|
|
|
844,786 |
|
|
|
22,706 |
|
|
|
713,194 |
|
|
|
154,298 |
|
|
|
3,245,307 |
|
|
|
2,465,911 |
|
|
|
|
|
|
|
|
|
|
|
|
|
|
|
|
|
|
|
|
|
|
|
|
|
|
|
|
|
|
| Interest expense: |
|
|
|
|
|
|
|
|
|
|
|
|
|
|
|
|
|
|
|
|
|
|
|
|
|
|
|
|
| Deposits |
|
|
319,200 |
|
|
|
294,121 |
|
|
|
25,079 |
|
|
|
139,338 |
|
|
|
179,862 |
|
|
|
1,050,024 |
|
|
|
252,845 |
|
| Short-term borrowings |
|
|
1,342 |
|
|
|
1,478 |
|
|
|
(136 |
) |
|
|
4,488 |
|
|
|
(3,146 |
) |
|
|
7,329 |
|
|
|
5,737 |
|
| Long-term debt |
|
|
12,770 |
|
|
|
15,167 |
|
|
|
(2,397 |
) |
|
|
9,802 |
|
|
|
2,968 |
|
|
|
56,430 |
|
|
|
39,970 |
|
|
|
|
|
|
|
|
|
|
|
|
|
|
|
|
|
|
|
|
|
|
|
|
|
|
|
|
|
|
| Total interest expense |
|
|
333,312 |
|
|
|
310,766 |
|
|
|
22,546 |
|
|
|
153,628 |
|
|
|
179,684 |
|
|
|
1,113,783 |
|
|
|
298,552 |
|
|
|
|
|
|
|
|
|
|
|
|
|
|
|
|
|
|
|
|
|
|
|
|
|
|
|
|
|
|
| Net interest income |
|
|
534,180 |
|
|
|
534,020 |
|
|
|
160 |
|
|
|
559,566 |
|
|
|
(25,386 |
) |
|
|
2,131,524 |
|
|
|
2,167,359 |
|
| Provision for credit losses |
|
|
78,663 |
|
|
|
45,117 |
|
|
|
33,546 |
|
|
|
49,531 |
|
|
|
29,132 |
|
|
|
208,609 |
|
|
|
83,030 |
|
|
|
|
|
|
|
|
|
|
|
|
|
|
|
|
|
|
|
|
|
|
|
|
|
|
|
|
|
|
| Net interest income after provision for credit losses |
|
|
455,517 |
|
|
|
488,903 |
|
|
|
(33,386 |
) |
|
|
510,035 |
|
|
|
(54,518 |
) |
|
|
1,922,915 |
|
|
|
2,084,329 |
|
|
|
|
|
|
|
|
|
|
|
|
|
|
|
|
|
|
|
|
|
|
|
|
|
|
|
|
|
|
| Service charges on deposit accounts |
|
|
37,699 |
|
|
|
37,318 |
|
|
|
381 |
|
|
|
34,682 |
|
|
|
3,017 |
|
|
|
147,476 |
|
|
|
157,210 |
|
| Other service fees |
|
|
96,692 |
|
|
|
93,407 |
|
|
|
3,285 |
|
|
|
89,022 |
|
|
|
7,670 |
|
|
|
374,440 |
|
|
|
334,009 |
|
| Mortgage banking activities |
|
|
6,388 |
|
|
|
5,393 |
|
|
|
995 |
|
|
|
6,562 |
|
|
|
(174 |
) |
|
|
21,497 |
|
|
|
42,450 |
|
| Net gain (loss), including impairment, on equity securities |
|
|
2,317 |
|
|
|
(1,319 |
) |
|
|
3,636 |
|
|
|
317 |
|
|
|
2,000 |
|
|
|
3,482 |
|
|
|
(7,334 |
) |
| Net gain (loss) on trading account debt securities |
|
|
750 |
|
|
|
219 |
|
|
|
531 |
|
|
|
162 |
|
|
|
588 |
|
|
|
1,382 |
|
|
|
(784 |
) |
| Net loss on sale of loans, including valuation adjustments on loans
held-for-sale |
|
|
(71 |
) |
|
|
(44 |
) |
|
|
(27 |
) |
|
|
— |
|
|
|
(71 |
) |
|
|
(115 |
) |
|
|
— |
|
| Adjustments to indemnity reserves on loans sold |
|
|
2,350 |
|
|
|
(187 |
) |
|
|
2,537 |
|
|
|
(221 |
) |
|
|
2,571 |
|
|
|
2,319 |
|
|
|
919 |
|
| Other operating income |
|
|
22,618 |
|
|
|
24,762 |
|
|
|
(2,144 |
) |
|
|
27,941 |
|
|
|
(5,323 |
) |
|
|
100,243 |
|
|
|
370,592 |
|
|
|
|
|
|
|
|
|
|
|
|
|
|
|
|
|
|
|
|
|
|
|
|
|
|
|
|
|
|
| Total non-interest income |
|
|
168,743 |
|
|
|
159,549 |
|
|
|
9,194 |
|
|
|
158,465 |
|
|
|
10,278 |
|
|
|
650,724 |
|
|
|
897,062 |
|
|
|
|
|
|
|
|
|
|
|
|
|
|
|
|
|
|
|
|
|
|
|
|
|
|
|
|
|
|
| Operating expenses: |
|
|
|
|
|
|
|
|
|
|
|
|
|
|
|
|
|
|
|
|
|
|
|
|
|
|
|
|
| Personnel costs |
|
|
|
|
|
|
|
|
|
|
|
|
|
|
|
|
|
|
|
|
|
|
|
|
|
|
|
|
| Salaries |
|
|
127,809 |
|
|
|
127,832 |
|
|
|
(23 |
) |
|
|
116,503 |
|
|
|
11,306 |
|
|
|
505,935 |
|
|
|
432,910 |
|
| Commissions, incentives and other bonuses |
|
|
26,632 |
|
|
|
27,670 |
|
|
|
(1,038 |
) |
|
|
39,570 |
|
|
|
(12,938 |
) |
|
|
112,657 |
|
|
|
155,889 |
|
| Pension, postretirement and medical insurance |
|
|
17,598 |
|
|
|
16,985 |
|
|
|
613 |
|
|
|
12,452 |
|
|
|
5,146 |
|
|
|
67,469 |
|
|
|
56,085 |
|
| Other personnel costs, including payroll taxes |
|
|
22,626 |
|
|
|
20,665 |
|
|
|
1,961 |
|
|
|
21,612 |
|
|
|
1,014 |
|
|
|
91,984 |
|
|
|
74,880 |
|
|
|
|
|
|
|
|
|
|
|
|
|
|
|
|
|
|
|
|
|
|
|
|
|
|
|
|
|
|
| Total personnel costs |
|
|
194,665 |
|
|
|
193,152 |
|
|
|
1,513 |
|
|
|
190,137 |
|
|
|
4,528 |
|
|
|
778,045 |
|
|
|
719,764 |
|
| Net occupancy expenses |
|
|
30,282 |
|
|
|
28,100 |
|
|
|
2,182 |
|
|
|
27,812 |
|
|
|
2,470 |
|
|
|
111,586 |
|
|
|
106,169 |
|
| Equipment expenses |
|
|
10,179 |
|
|
|
8,905 |
|
|
|
1,274 |
|
|
|
9,828 |
|
|
|
351 |
|
|
|
37,057 |
|
|
|
35,626 |
|
| Other taxes |
|
|
14,636 |
|
|
|
8,590 |
|
|
|
6,046 |
|
|
|
16,142 |
|
|
|
(1,506 |
) |
|
|
55,926 |
|
|
|
63,603 |
|
| Professional fees |
|
|
39,065 |
|
|
|
38,514 |
|
|
|
551 |
|
|
|
49,159 |
|
|
|
(10,094 |
) |
|
|
161,142 |
|
|
|
172,043 |
|
| Technology and software expenses |
|
|
76,772 |
|
|
|
72,930 |
|
|
|
3,842 |
|
|
|
78,264 |
|
|
|
(1,492 |
) |
|
|
290,615 |
|
|
|
291,902 |
|
| Processing and transactional services |
|
|
|
|
|
|
|
|
|
|
|
|
|
|
|
|
|
|
|
|
|
|
|
|
|
|
|
|
| Credit and debit cards |
|
|
6,682 |
|
|
|
13,762 |
|
|
|
(7,080 |
) |
|
|
10,278 |
|
|
|
(3,596 |
) |
|
|
44,578 |
|
|
|
45,455 |
|
| Other processing and transactional services |
|
|
22,779 |
|
|
|
24,137 |
|
|
|
(1,358 |
) |
|
|
22,509 |
|
|
|
270 |
|
|
|
93,492 |
|
|
|
81,690 |
|
|
|
|
|
|
|
|
|
|
|
|
|
|
|
|
|
|
|
|
|
|
|
|
|
|
|
|
|
|
| Total processing and transactional services |
|
|
29,461 |
|
|
|
37,899 |
|
|
|
(8,438 |
) |
|
|
32,787 |
|
|
|
(3,326 |
) |
|
|
138,070 |
|
|
|
127,145 |
|
| Communications |
|
|
4,181 |
|
|
|
4,220 |
|
|
|
(39 |
) |
|
|
3,857 |
|
|
|
324 |
|
|
|
16,664 |
|
|
|
14,885 |
|
| Business promotion |
|
|
|
|
|
|
|
|
|
|
|
|
|
|
|
|
|
|
|
|
|
|
|
|
|
|
|
|
| Rewards and customer loyalty programs |
|
|
14,130 |
|
|
|
15,988 |
|
|
|
(1,858 |
) |
|
|
13,538 |
|
|
|
592 |
|
|
|
59,092 |
|
|
|
51,832 |
|
| Other business promotion |
|
|
13,767 |
|
|
|
7,087 |
|
|
|
6,680 |
|
|
|
14,596 |
|
|
|
(829 |
) |
|
|
35,834 |
|
|
|
37,086 |
|
|
|
|
|
|
|
|
|
|
|
|
|
|
|
|
|
|
|
|
|
|
|
|
|
|
|
|
|
|
| Total business promotion |
|
|
27,897 |
|
|
|
23,075 |
|
|
|
4,822 |
|
|
|
28,134 |
|
|
|
(237 |
) |
|
|
94,926 |
|
|
|
88,918 |
|
| FDIC deposit insurance |
|
|
81,385 |
|
|
|
8,932 |
|
|
|
72,453 |
|
|
|
6,342 |
|
|
|
75,043 |
|
|
|
105,985 |
|
|
|
26,787 |
|
| Other real estate owned (OREO) income |
|
|
(5,178 |
) |
|
|
(5,189 |
) |
|
|
11 |
|
|
|
(9,180 |
) |
|
|
4,002 |
|
|
|
(15,375 |
) |
|
|
(22,143 |
) |
| Other operating expenses |
|
|
|
|
|
|
|
|
|
|
|
|
|
|
|
|
|
|
|
|
|
|
|
|
|
|
|
|
| Operational losses |
|
|
6,921 |
|
|
|
5,504 |
|
|
|
1,417 |
|
|
|
9,018 |
|
|
|
(2,097 |
) |
|
|
23,505 |
|
|
|
32,049 |
|
| All other |
|
|
20,084 |
|
|
|
17,557 |
|
|
|
2,527 |
|
|
|
18,614 |
|
|
|
1,470 |
|
|
|
73,774 |
|
|
|
77,397 |
|
|
|
|
|
|
|
|
|
|
|
|
|
|
|
|
|
|
|
|
|
|
|
|
|
|
|
|
|
|
| Total other operating expenses |
|
|
27,005 |
|
|
|
23,061 |
|
|
|
3,944 |
|
|
|
27,632 |
|
|
|
(627 |
) |
|
|
97,279 |
|
|
|
109,446 |
|
| Amortization of intangibles |
|
|
795 |
|
|
|
795 |
|
|
|
— |
|
|
|
794 |
|
|
|
1 |
|
|
|
3,180 |
|
|
|
3,275 |
|
| Goodwill impairment charge |
|
|
— |
|
|
|
23,000 |
|
|
|
(23,000 |
) |
|
|
— |
|
|
|
— |
|
|
|
23,000 |
|
|
|
9,000 |
|
|
|
|
|
|
|
|
|
|
|
|
|
|
|
|
|
|
|
|
|
|
|
|
|
|
|
|
|
|
| Total operating expenses |
|
|
531,145 |
|
|
|
465,984 |
|
|
|
65,161 |
|
|
|
461,708 |
|
|
|
69,437 |
|
|
|
1,898,100 |
|
|
|
1,746,420 |
|
| Income before income tax |
|
|
93,115 |
|
|
|
182,468 |
|
|
|
(89,353 |
) |
|
|
206,792 |
|
|
|
(113,677 |
) |
|
|
675,539 |
|
|
|
1,234,971 |
|
| Income tax (benefit) expense |
|
|
(1,479 |
) |
|
|
45,859 |
|
|
|
(47,338 |
) |
|
|
(50,347 |
) |
|
|
48,868 |
|
|
|
134,197 |
|
|
|
132,330 |
|
| Net income |
|
$ |
94,594 |
|
|
$ |
136,609 |
|
|
$ |
(42,015 |
) |
|
$ |
257,139 |
|
|
$ |
(162,545 |
) |
|
$ |
541,342 |
|
|
$ |
1,102,641 |
|
|
|
|
|
|
|
|
|
|
|
|
|
|
|
|
|
|
|
|
|
|
|
|
|
|
|
|
|
|
| Net income applicable to common stock |
|
$ |
94,241 |
|
|
$ |
136,256 |
|
|
$ |
(42,015 |
) |
|
$ |
256,786 |
|
|
$ |
(162,545 |
) |
|
$ |
539,930 |
|
|
$ |
1,101,229 |
|
|
|
|
|
|
|
|
|
|
|
|
|
|
|
|
|
|
|
|
|
|
|
|
|
|
|
|
|
|
| Net income per common share - basic |
|
$ |
1.31 |
|
|
$ |
1.90 |
|
|
$ |
(0.59 |
) |
|
$ |
3.56 |
|
|
$ |
(2.25 |
) |
|
$ |
7.53 |
|
|
$ |
14.65 |
|
|
|
|
|
|
|
|
|
|
|
|
|
|
|
|
|
|
|
|
|
|
|
|
|
|
|
|
|
|
| Net income per common
share - diluted |
|
$ |
1.31 |
|
|
$ |
1.90 |
|
|
$ |
(0.59 |
) |
|
$ |
3.56 |
|
|
$ |
(2.25 |
) |
|
$ |
7.52 |
|
|
$ |
14.63 |
|
|
|
|
|
|
|
|
|
|
|
|
|
|
|
|
|
|
|
|
|
|
|
|
|
|
|
|
|
|
| Dividends Declared per Common Share |
|
$ |
0.62 |
|
|
$ |
0.55 |
|
|
$ |
0.07 |
|
|
$ |
0.55 |
|
|
$ |
0.07 |
|
|
$ |
2.27 |
|
|
$ |
2.20 |
|
|
|
|
|
|
|
|
|
|
|
|
|
|
|
|
|
|
|
|
|
|
|
|
|
|
|
|
|
|
12
Popular, Inc.
Financial Supplement to Fourth Quarter 2023 Earnings Release
Table C - Consolidated Statement of Financial Condition
(Unaudited)
|
|
|
|
|
|
|
|
|
|
|
|
|
|
|
|
|
| |
|
|
|
|
|
|
|
|
|
|
Variance |
|
| |
|
|
|
|
|
|
|
|
|
|
Q4 2023 vs. |
|
| (In thousands) |
|
31-Dec-23 |
|
|
30-Sep-23 |
|
|
31-Dec-22 |
|
|
Q3 2023 |
|
| Assets: |
|
|
|
|
|
|
|
|
|
|
|
|
|
|
|
|
| Cash and due from banks |
|
$ |
420,462 |
|
|
$ |
535,335 |
|
|
$ |
469,501 |
|
|
$ |
(114,873 |
) |
| Money market investments |
|
|
6,998,871 |
|
|
|
6,389,437 |
|
|
|
5,614,595 |
|
|
|
609,434 |
|
| Trading account debt securities, at fair value |
|
|
31,568 |
|
|
|
30,988 |
|
|
|
27,723 |
|
|
|
580 |
|
| Debt securities
available-for-sale, at fair value |
|
|
16,729,044 |
|
|
|
17,129,858 |
|
|
|
17,804,374 |
|
|
|
(400,814 |
) |
| Debt securities
held-to-maturity, at amortized cost |
|
|
8,194,335 |
|
|
|
8,302,082 |
|
|
|
8,525,366 |
|
|
|
(107,747 |
) |
| Less: Allowance for credit losses |
|
|
5,780 |
|
|
|
6,057 |
|
|
|
6,911 |
|
|
|
(277 |
) |
|
|
|
|
|
|
|
|
|
|
|
|
|
|
|
|
|
| Total debt securities
held-to-maturity, net |
|
|
8,188,555 |
|
|
|
8,296,025 |
|
|
|
8,518,455 |
|
|
|
(107,470 |
) |
|
|
|
|
|
|
|
|
|
|
|
|
|
|
|
|
|
| Equity securities |
|
|
193,726 |
|
|
|
190,688 |
|
|
|
195,854 |
|
|
|
3,038 |
|
| Loans
held-for-sale, at lower of cost or fair value |
|
|
4,301 |
|
|
|
5,239 |
|
|
|
5,381 |
|
|
|
(938 |
) |
| Loans
held-in-portfolio |
|
|
35,420,879 |
|
|
|
34,369,775 |
|
|
|
32,372,925 |
|
|
|
1,051,104 |
|
| Less: Unearned income |
|
|
355,908 |
|
|
|
340,462 |
|
|
|
295,156 |
|
|
|
15,446 |
|
| Allowance for credit losses |
|
|
729,341 |
|
|
|
711,068 |
|
|
|
720,302 |
|
|
|
18,273 |
|
|
|
|
|
|
|
|
|
|
|
|
|
|
|
|
|
|
| Total loans
held-in-portfolio, net |
|
|
34,335,630 |
|
|
|
33,318,245 |
|
|
|
31,357,467 |
|
|
|
1,017,385 |
|
|
|
|
|
|
|
|
|
|
|
|
|
|
|
|
|
|
| Premises and equipment, net |
|
|
565,284 |
|
|
|
534,384 |
|
|
|
498,711 |
|
|
|
30,900 |
|
| Other real estate |
|
|
80,416 |
|
|
|
82,322 |
|
|
|
89,126 |
|
|
|
(1,906 |
) |
| Accrued income receivable |
|
|
263,433 |
|
|
|
257,833 |
|
|
|
240,195 |
|
|
|
5,600 |
|
| Mortgage servicing rights, at fair value |
|
|
118,109 |
|
|
|
119,030 |
|
|
|
128,350 |
|
|
|
(921 |
) |
| Other assets |
|
|
2,014,564 |
|
|
|
2,032,565 |
|
|
|
1,847,813 |
|
|
|
(18,001 |
) |
| Goodwill |
|
|
804,428 |
|
|
|
804,428 |
|
|
|
827,428 |
|
|
|
— |
|
| Other intangible assets |
|
|
9,764 |
|
|
|
10,559 |
|
|
|
12,944 |
|
|
|
(795 |
) |
|
|
|
|
|
|
|
|
|
|
|
|
|
|
|
|
|
| Total assets |
|
$ |
70,758,155 |
|
|
$ |
69,736,936 |
|
|
$ |
67,637,917 |
|
|
$ |
1,021,219 |
|
|
|
|
|
|
|
|
|
|
|
|
|
|
|
|
|
|
| Liabilities and Stockholders’ Equity: |
|
|
|
|
|
|
|
|
|
|
|
|
|
|
|
|
| Liabilities: |
|
|
|
|
|
|
|
|
|
|
|
|
|
|
|
|
| Deposits: |
|
|
|
|
|
|
|
|
|
|
|
|
|
|
|
|
| Non-interest bearing |
|
$ |
15,419,624 |
|
|
$ |
15,201,374 |
|
|
$ |
15,960,557 |
|
|
$ |
218,250 |
|
| Interest bearing |
|
|
48,198,619 |
|
|
|
48,136,226 |
|
|
|
45,266,670 |
|
|
|
62,393 |
|
|
|
|
|
|
|
|
|
|
|
|
|
|
|
|
|
|
| Total deposits |
|
|
63,618,243 |
|
|
|
63,337,600 |
|
|
|
61,227,227 |
|
|
|
280,643 |
|
|
|
|
|
|
|
|
|
|
|
|
|
|
|
|
|
|
| Assets sold under agreements to repurchase |
|
|
91,384 |
|
|
|
93,071 |
|
|
|
148,609 |
|
|
|
(1,687 |
) |
| Other short-term borrowings |
|
|
— |
|
|
|
— |
|
|
|
365,000 |
|
|
|
— |
|
| Notes payable |
|
|
986,948 |
|
|
|
1,004,649 |
|
|
|
886,710 |
|
|
|
(17,701 |
) |
| Other liabilities |
|
|
914,627 |
|
|
|
844,008 |
|
|
|
916,946 |
|
|
|
70,619 |
|
| Total liabilities |
|
|
65,611,202 |
|
|
|
65,279,328 |
|
|
|
63,544,492 |
|
|
|
331,874 |
|
| Stockholders’ equity: |
|
|
|
|
|
|
|
|
|
|
|
|
|
|
|
|
| Preferred stock |
|
|
22,143 |
|
|
|
22,143 |
|
|
|
22,143 |
|
|
|
— |
|
| Common stock |
|
|
1,048 |
|
|
|
1,048 |
|
|
|
1,047 |
|
|
|
— |
|
| Surplus |
|
|
4,843,399 |
|
|
|
4,797,364 |
|
|
|
4,790,993 |
|
|
|
46,035 |
|
| Retained earnings |
|
|
4,194,851 |
|
|
|
4,189,865 |
|
|
|
3,834,348 |
|
|
|
4,986 |
|
| Treasury stock |
|
|
(2,018,957 |
) |
|
|
(2,018,870 |
) |
|
|
(2,030,178 |
) |
|
|
(87 |
) |
| Accumulated other comprehensive loss, net of tax |
|
|
(1,895,531 |
) |
|
|
(2,533,942 |
) |
|
|
(2,524,928 |
) |
|
|
638,411 |
|
|
|
|
|
|
|
|
|
|
|
|
|
|
|
|
|
|
| Total stockholders’ equity |
|
|
5,146,953 |
|
|
|
4,457,608 |
|
|
|
4,093,425 |
|
|
|
689,345 |
|
|
|
|
|
|
|
|
|
|
|
|
|
|
|
|
|
|
| Total liabilities and stockholders’ equity |
|
$ |
70,758,155 |
|
|
$ |
69,736,936 |
|
|
$ |
67,637,917 |
|
|
$ |
1,021,219 |
|
|
|
|
|
|
|
|
|
|
|
|
|
|
|
|
|
|
13
Popular, Inc.
Financial Supplement to Fourth Quarter 2023 Earnings Release
Table D - Analysis of Levels and Yields on a Taxable Equivalent Basis (Non-GAAP)
For the quarters ended December 31, 2023 and September 30, 2023
(Unaudited)
|
|
|
|
|
|
|
|
|
|
|
|
|
|
|
|
|
|
|
|
|
|
|
|
|
|
|
|
|
|
|
|
|
|
|
|
|
|
|
|
|
|
|
|
|
| |
|
|
|
|
|
|
|
|
|
|
|
|
|
|
|
|
|
|
|
|
|
|
Variance |
|
| Average Volume |
|
|
Average Yields / Costs |
|
|
|
|
Interest |
|
|
Attributable to |
|
| 31-Dec-23 |
|
|
30-Sep-23 |
|
|
Variance |
|
|
31-Dec-23 |
|
|
30-Sep-23 |
|
|
Variance |
|
|
|
|
31-Dec-23 |
|
|
30-Sep-23 |
|
|
Variance |
|
|
Rate |
|
|
Volume |
|
| (In millions) |
|
|
|
|
|
|
|
|
|
|
|
|
|
(In thousands) |
|
| $ |
7,307 |
|
|
$ |
7,292 |
|
|
$ |
15 |
|
|
|
5.47 |
% |
|
|
5.40 |
% |
|
|
0.07 |
% |
|
Money market investments |
|
$ |
100,840 |
|
|
$ |
99,285 |
|
|
$ |
1,555 |
|
|
$ |
1,352 |
|
|
$ |
203 |
|
| |
27,099 |
|
|
|
28,396 |
|
|
|
(1,297 |
) |
|
|
2.28 |
|
|
|
2.31 |
|
|
|
(0.03 |
) |
|
Investment securities [1] |
|
|
155,118 |
|
|
|
165,319 |
|
|
|
(10,201 |
) |
|
|
(2,704 |
) |
|
|
(7,497 |
) |
| |
31 |
|
|
|
34 |
|
|
|
(3 |
) |
|
|
3.72 |
|
|
|
4.43 |
|
|
|
(0.71 |
) |
|
Trading securities |
|
|
293 |
|
|
|
375 |
|
|
|
(82 |
) |
|
|
(58 |
) |
|
|
(24 |
) |
| |
|
|
|
|
|
|
|
|
|
|
|
|
|
|
|
|
|
|
|
|
|
|
|
|
|
|
|
|
|
|
|
|
|
|
|
|
|
|
|
|
|
|
|
|
| |
34,437 |
|
|
|
35,722 |
|
|
|
(1,285 |
) |
|
|
2.96 |
|
|
|
2.95 |
|
|
|
0.01 |
|
|
Total money market, investment and trading securities |
|
|
256,251 |
|
|
|
264,979 |
|
|
|
(8,728 |
) |
|
|
(1,410 |
) |
|
|
(7,318 |
) |
| |
|
|
|
|
|
|
|
|
|
|
|
|
|
|
|
|
|
|
|
|
|
|
|
|
|
|
|
|
|
|
|
|
|
|
|
|
|
|
|
|
|
|
|
|
|
|
|
|
|
|
|
|
|
|
|
|
|
|
|
|
|
|
|
|
|
|
|
|
Loans: |
|
|
|
|
|
|
|
|
|
|
|
|
|
|
|
|
|
|
|
|
| |
17,251 |
|
|
|
16,611 |
|
|
|
640 |
|
|
|
6.71 |
|
|
|
6.64 |
|
|
|
0.07 |
|
|
Commercial |
|
|
291,791 |
|
|
|
277,977 |
|
|
|
13,814 |
|
|
|
2,952 |
|
|
|
10,862 |
|
| |
927 |
|
|
|
865 |
|
|
|
62 |
|
|
|
9.04 |
|
|
|
8.99 |
|
|
|
0.05 |
|
|
Construction |
|
|
21,131 |
|
|
|
19,580 |
|
|
|
1,551 |
|
|
|
121 |
|
|
|
1,430 |
|
| |
1,707 |
|
|
|
1,669 |
|
|
|
38 |
|
|
|
6.60 |
|
|
|
6.50 |
|
|
|
0.10 |
|
|
Leasing |
|
|
28,174 |
|
|
|
27,142 |
|
|
|
1,032 |
|
|
|
408 |
|
|
|
624 |
|
| |
7,626 |
|
|
|
7,504 |
|
|
|
122 |
|
|
|
5.83 |
|
|
|
5.42 |
|
|
|
0.41 |
|
|
Mortgage |
|
|
111,215 |
|
|
|
101,700 |
|
|
|
9,515 |
|
|
|
7,844 |
|
|
|
1,671 |
|
| |
3,215 |
|
|
|
3,147 |
|
|
|
68 |
|
|
|
13.43 |
|
|
|
13.39 |
|
|
|
0.04 |
|
|
Consumer |
|
|
108,859 |
|
|
|
105,042 |
|
|
|
3,817 |
|
|
|
1,368 |
|
|
|
2,449 |
|
| |
3,722 |
|
|
|
3,657 |
|
|
|
65 |
|
|
|
8.61 |
|
|
|
8.47 |
|
|
|
0.14 |
|
|
Auto |
|
|
80,731 |
|
|
|
78,055 |
|
|
|
2,676 |
|
|
|
1,272 |
|
|
|
1,404 |
|
| |
|
|
|
|
|
|
|
|
|
|
|
|
|
|
|
|
|
|
|
|
|
|
|
|
|
|
|
|
|
|
|
|
|
|
|
|
|
|
|
|
|
|
|
|
| |
34,448 |
|
|
|
33,453 |
|
|
|
995 |
|
|
|
7.41 |
|
|
|
7.24 |
|
|
|
0.17 |
|
|
Total loans |
|
|
641,901 |
|
|
|
609,496 |
|
|
|
32,405 |
|
|
|
13,965 |
|
|
|
18,440 |
|
| |
|
|
|
|
|
|
|
|
|
|
|
|
|
|
|
|
|
|
|
|
|
|
|
|
|
|
|
|
|
|
|
|
|
|
|
|
|
|
|
|
|
|
|
|
| $ |
68,885 |
|
|
$ |
69,175 |
|
|
$ |
(290 |
) |
|
|
5.18 |
% |
|
|
5.02 |
% |
|
|
0.16 |
% |
|
Total earning assets |
|
$ |
898,152 |
|
|
$ |
874,475 |
|
|
$ |
23,677 |
|
|
$ |
12,555 |
|
|
$ |
11,122 |
|
| |
|
|
|
|
|
|
|
|
|
|
|
|
|
|
|
|
|
|
|
|
|
|
|
|
|
|
|
|
|
|
|
|
|
|
|
|
|
|
|
|
|
|
|
|
|
|
|
|
|
|
|
|
|
|
|
|
|
|
|
|
|
|
|
|
|
|
|
|
Interest bearing deposits: |
|
|
|
|
|
|
|
|
|
|
|
|
|
|
|
|
|
|
|
|
| $ |
25,027 |
|
|
$ |
25,652 |
|
|
$ |
(625 |
) |
|
|
3.60 |
% |
|
|
3.31 |
% |
|
|
0.29 |
% |
|
NOW and money market [2] |
|
$ |
227,079 |
|
|
$ |
213,957 |
|
|
$ |
13,122 |
|
|
$ |
18,199 |
|
|
$ |
(5,077 |
) |
| |
14,934 |
|
|
|
14,875 |
|
|
|
59 |
|
|
|
0.85 |
|
|
|
0.73 |
|
|
|
0.12 |
|
|
Savings |
|
|
32,073 |
|
|
|
27,373 |
|
|
|
4,700 |
|
|
|
3,852 |
|
|
|
848 |
|
| |
8,288 |
|
|
|
7,986 |
|
|
|
302 |
|
|
|
2.87 |
|
|
|
2.62 |
|
|
|
0.25 |
|
|
Time deposits |
|
|
60,048 |
|
|
|
52,791 |
|
|
|
7,257 |
|
|
|
4,676 |
|
|
|
2,581 |
|
| |
|
|
|
|
|
|
|
|
|
|
|
|
|
|
|
|
|
|
|
|
|
|
|
|
|
|
|
|
|
|
|
|
|
|
|
|
|
|
|
|
|
|
|
|
| |
48,249 |
|
|
|
48,513 |
|
|
|
(264 |
) |
|
|
2.62 |
|
|
|
2.41 |
|
|
|
0.21 |
|
|
Total interest bearing deposits |
|
|
319,200 |
|
|
|
294,121 |
|
|
|
25,079 |
|
|
|
26,727 |
|
|
|
(1,648 |
) |
| |
|
|
|
|
|
|
|
|
|
|
|
|
|
|
|
|
|
|
|
|
|
|
|
|
|
|
|
|
|
|
|
|
|
|
|
|
|
|
|
|
|
|
|
|
| |
15,017 |
|
|
|
15,038 |
|
|
|
(21 |
) |
|
|
|
|
|
|
|
|
|
|
|
|
|
Non-interest bearing demand deposits |
|
|
|
|
|
|
|
|
|
|
|
|
|
|
|
|
|
|
|
|
| |
|
|
|
|
|
|
|
|
|
|
|
|
|
|
|
|
|
|
|
|
|
|
|
|
|
|
|
|
|
|
|
|
|
|
|
|
|
|
|
|
|
|
|
|
| |
63,266 |
|
|
|
63,551 |
|
|
|
(285 |
) |
|
|
2.00 |
|
|
|
1.84 |
|
|
|
0.16 |
|
|
Total deposits |
|
|
319,200 |
|
|
|
294,121 |
|
|
|
25,079 |
|
|
|
26,727 |
|
|
|
(1,648 |
) |
| |
|
|
|
|
|
|
|
|
|
|
|
|
|
|
|
|
|
|
|
|
|
|
|
|
|
|
|
|
|
|
|
|
|
|
|
|
|
|
|
|
|
|
|
|
| |
94 |
|
|
|
108 |
|
|
|
(14 |
) |
|
|
5.64 |
|
|
|
5.45 |
|
|
|
0.19 |
|
|
Short-term borrowings |
|
|
1,342 |
|
|
|
1,478 |
|
|
|
(136 |
) |
|
|
51 |
|
|
|
(187 |
) |
| |
1,018 |
|
|
|
1,172 |
|
|
|
(154 |
) |
|
|
5.04 |
|
|
|
5.20 |
|
|
|
(0.16 |
) |
|
Other medium and long-term debt |
|
|
12,770 |
|
|
|
15,167 |
|
|
|
(2,397 |
) |
|
|
346 |
|
|
|
(2,743 |
) |
| |
|
|
|
|
|
|
|
|
|
|
|
|
|
|
|
|
|
|
|
|
|
|
|
|
|
|
|
|
|
|
|
|
|
|
|
|
|
|
|
|
|
|
|
|
| |
49,361 |
|
|
|
49,793 |
|
|
|
(432 |
) |
|
|
2.68 |
|
|
|
2.48 |
|
|
|
0.20 |
|
|
Total interest bearing liabilities (excluding demand deposits) |
|
|
333,312 |
|
|
|
310,766 |
|
|
|
22,546 |
|
|
|
27,124 |
|
|
|
(4,578 |
) |
| |
|
|
|
|
|
|
|
|
|
|
|
|
|
|
|
|
|
|
|
|
|
|
|
|
|
|
|
|
|
|
|
|
|
|
|
|
|
|
|
|
|
|
|
|
| |
4,507 |
|
|
|
4,344 |
|
|
|
163 |
|
|
|
|
|
|
|
|
|
|
|
|
|
|
Other sources of funds |
|
|
|
|
|
|
|
|
|
|
|
|
|
|
|
|
|
|
|
|
| |
|
|
|
|
|
|
|
|
|
|
|
|
|
|
|
|
|
|
|
|
|
|
|
|
|
|
|
|
|
|
|
|
|
|
|
|
|
|
|
|
|
|
|
|
| $ |
68,885 |
|
|
$ |
69,175 |
|
|
$ |
(290 |
) |
|
|
1.92 |
% |
|
|
1.78 |
% |
|
|
0.14 |
% |
|
Total source of funds |
|
|
333,312 |
|
|
|
310,766 |
|
|
|
22,546 |
|
|
|
27,124 |
|
|
|
(4,578 |
) |
| |
|
|
|
|
|
|
|
|
|
|
|
|
|
|
|
|
|
|
|
|
|
|
|
|
|
|
|
|
|
|
|
|
|
|
|
|
|
|
|
|
|
|
|
|
|
|
|
|
|
|
|
|
|
|
|
|
|
3.26 |
% |
|
|
3.24 |
% |
|
|
0.02 |
% |
|
Net interest margin/income on a taxable equivalent basis
(Non-GAAP) |
|
|
564,840 |
|
|
|
563,709 |
|
|
|
1,131 |
|
|
$ |
(14,569 |
) |
|
$ |
15,700 |
|
|
|
|
|
|
|
|
|
|
|
|
|
|
|
|
|
|
|
|
|
|
|
|
|
|
|
|
|
|
|
|
|
|
|
|
|
|
|
|
|
|
|
|
|
|
|
|
|
|
|
|
|
|
|
|
|
|
|
2.50 |
% |
|
|
2.54 |
% |
|
|
(0.04 |
) % |
|
Net interest spread |
|
|
|
|
|
|
|
|
|
|
|
|
|
|
|
|
|
|
|
|
|
|
|
|
|
|
|
|
|
|
|
|
|
|
|
|
|
|
|
|
|
|
|
|
|
|
|
|
|
|
|
|
|
|
|
|
|
|
|
|
|
|
|
|
|
|
|
|
|
|
|
|
|
|
|
|
|
|
|
|
|
|
|
|
|
|
|
|
|
Taxable equivalent adjustment |
|
|
30,660 |
|
|
|
29,689 |
|
|
|
971 |
|
|
|
|
|
|
|
|
|
|
|
|
|
|
|
|
|
|
|
|
|
|
|
|
|
|
|
|
|
|
|
|
|
|
|
|
|
|
|
|
|
|
|
|
|
|
|
|
|
|
|
|
|
|
|
|
|
|
|
|
|
|
|
|
|
|
|
3.08 |
% |
|
|
3.07 |
% |
|
|
0.01 |
% |
|
Net interest margin/ income non-taxable equivalent basis
(GAAP) |
|
$ |
534,180 |
|
|
$ |
534,020 |
|
|
$ |
160 |
|
|
|
|
|
|
|
|
|
|
|
|
|
|
|
|
|
|
|
|
|
|
|
|
|
|
|
|
|
|
|
|
|
|
|
|
|
|
|
|
|
|
|
|
|
|
|
|
|
|
|
|
|
|
Note: The changes that are not due solely to volume or rate are allocated to volume and rate based on the proportion of the
change in each category.
| [1] |
Average balances exclude unrealized gains or losses on debt securities available-for-sale and the unrealized loss related to certain securities transferred from available-for-sale to held-to-maturity. |
| [2] |
Includes interest bearing demand deposits corresponding to certain government entities in Puerto Rico.
|
14
Popular, Inc.
Financial Supplement to Fourth Quarter 2023 Earnings Release
Table E - Analysis of Levels and Yields on a Taxable Equivalent Basis (Non-GAAP)
For the quarters ended December 31, 2023 and December 31, 2022
(Unaudited)
|
|
|
|
|
|
|
|
|
|
|
|
|
|
|
|
|
|
|
|
|
|
|
|
|
|
|
|
|
|
|
|
|
|
|
|
|
|
|
|
|
|
|
|
|
| |
|
|
|
|
|
|
|
|
|
|
|
|
|
|
|
|
|
|
|
|
|
|
Variance |
|
| Average Volume |
|
|
Average Yields / Costs |
|
|
|
|
Interest |
|
|
Attributable to |
|
| 31-Dec-23 |
|
|
31-Dec-22 |
|
|
Variance |
|
|
31-Dec-23 |
|
|
31-Dec-22 |
|
|
Variance |
|
|
|
|
31-Dec-23 |
|
|
31-Dec-22 |
|
|
Variance |
|
|
Rate |
|
|
Volume |
|
| (In millions) |
|
|
|
|
|
|
|
|
|
|
|
|
|
(In thousands) |
|
| $ |
7,307 |
|
|
$ |
5,262 |
|
|
$ |
2,045 |
|
|
|
5.47 |
% |
|
|
3.84 |
% |
|
|
1.63 |
% |
|
Money market investments |
|
$ |
100,840 |
|
|
$ |
50,907 |
|
|
$ |
49,933 |
|
|
$ |
26,116 |
|
|
$ |
23,817 |
|
| |
27,099 |
|
|
|
30,843 |
|
|
|
(3,744 |
) |
|
|
2.28 |
|
|
|
2.44 |
|
|
|
(0.16 |
) |
|
Investment securities [1] |
|
|
155,118 |
|
|
|
189,190 |
|
|
|
(34,072 |
) |
|
|
(11,762 |
) |
|
|
(22,310 |
) |
| |
31 |
|
|
|
30 |
|
|
|
1 |
|
|
|
3.72 |
|
|
|
4.28 |
|
|
|
(0.56 |
) |
|
Trading securities |
|
|
293 |
|
|
|
325 |
|
|
|
(32 |
) |
|
|
(44 |
) |
|
|
12 |
|
| |
|
|
|
|
|
|
|
|
|
|
|
|
|
|
|
|
|
|
|
|
|
|
|
|
|
|
|
|
|
|
|
|
|
|
|
|
|
|
|
|
|
|
|
|
| |
34,437 |
|
|
|
36,135 |
|
|
|
(1,698 |
) |
|
|
2.96 |
|
|
|
2.65 |
|
|
|
0.31 |
|
|
Total money market, investment and trading securities |
|
|
256,251 |
|
|
|
240,422 |
|
|
|
15,829 |
|
|
|
14,310 |
|
|
|
1,519 |
|
| |
|
|
|
|
|
|
|
|
|
|
|
|
|
|
|
|
|
|
|
|
|
|
|
|
|
|
|
|
|
|
|
|
|
|
|
|
|
|
|
|
|
|
|
|
|
|
|
|
|
|
|
|
|
|
|
|
|
|
|
|
|
|
|
|
|
|
|
|
Loans: |
|
|
|
|
|
|
|
|
|
|
|
|
|
|
|
|
|
|
|
|
| |
17,251 |
|
|
|
15,503 |
|
|
|
1,748 |
|
|
|
6.71 |
|
|
|
6.01 |
|
|
|
0.70 |
|
|
Commercial |
|
|
291,791 |
|
|
|
234,707 |
|
|
|
57,084 |
|
|
|
29,111 |
|
|
|
27,973 |
|
| |
927 |
|
|
|
769 |
|
|
|
158 |
|
|
|
9.04 |
|
|
|
7.54 |
|
|
|
1.50 |
|
|
Construction |
|
|
21,131 |
|
|
|
14,615 |
|
|
|
6,516 |
|
|
|
3,195 |
|
|
|
3,321 |
|
| |
1,707 |
|
|
|
1,557 |
|
|
|
150 |
|
|
|
6.60 |
|
|
|
5.92 |
|
|
|
0.68 |
|
|
Leasing |
|
|
28,174 |
|
|
|
23,049 |
|
|
|
5,125 |
|
|
|
2,777 |
|
|
|
2,348 |
|
| |
7,626 |
|
|
|
7,346 |
|
|
|
280 |
|
|
|
5.83 |
|
|
|
5.38 |
|
|
|
0.45 |
|
|
Mortgage |
|
|
111,215 |
|
|
|
98,880 |
|
|
|
12,335 |
|
|
|
8,475 |
|
|
|
3,860 |
|
| |
3,215 |
|
|
|
2,961 |
|
|
|
254 |
|
|
|
13.43 |
|
|
|
12.26 |
|
|
|
1.17 |
|
|
Consumer |
|
|
108,859 |
|
|
|
91,518 |
|
|
|
17,341 |
|
|
|
8,666 |
|
|
|
8,675 |
|
| |
3,722 |
|
|
|
3,576 |
|
|
|
146 |
|
|
|
8.61 |
|
|
|
7.98 |
|
|
|
0.63 |
|
|
Auto |
|
|
80,731 |
|
|
|
71,910 |
|
|
|
8,821 |
|
|
|
5,800 |
|
|
|
3,021 |
|
| |
|
|
|
|
|
|
|
|
|
|
|
|
|
|
|
|
|
|
|
|
|
|
|
|
|
|
|
|
|
|
|
|
|
|
|
|
|
|
|
|
|
|
|
|
| |
34,448 |
|
|
|
31,712 |
|
|
|
2,736 |
|
|
|
7.41 |
|
|
|
6.70 |
|
|
|
0.71 |
|
|
Total loans |
|
|
641,901 |
|
|
|
534,679 |
|
|
|
107,222 |
|
|
|
58,024 |
|
|
|
49,198 |
|
| |
|
|
|
|
|
|
|
|
|
|
|
|
|
|
|
|
|
|
|
|
|
|
|
|
|
|
|
|
|
|
|
|
|
|
|
|
|
|
|
|
|
|
|
|
| $ |
68,885 |
|
|
$ |
67,847 |
|
|
$ |
1,038 |
|
|
|
5.18 |
% |
|
|
4.54 |
% |
|
|
0.64 |
% |
|
Total earning assets |
|
$ |
898,152 |
|
|
$ |
775,101 |
|
|
$ |
123,051 |
|
|
$ |
72,334 |
|
|
$ |
50,717 |
|
| |
|
|
|
|
|
|
|
|
|
|
|
|
|
|
|
|
|
|
|
|
|
|
|
|
|
|
|
|
|
|
|
|
|
|
|
|
|
|
|
|
|
|
|
|
|
|
|
|
|
|
|
|
|
|
|
|
|
|
|
|
|
|
|
|
|
|
|
|
Interest bearing deposits: |
|
|
|
|
|
|
|
|
|
|
|
|
|
|
|
|
|
|
|
|
| $ |
25,027 |
|
|
$ |
24,399 |
|
|
$ |
628 |
|
|
|
3.60 |
% |
|
|
1.73 |
% |
|
|
1.87 |
% |
|
NOW and money market [2] |
|
$ |
227,079 |
|
|
$ |
106,591 |
|
|
$ |
120,488 |
|
|
$ |
112,821 |
|
|
$ |
7,667 |
|
| |
14,934 |
|
|
|
15,248 |
|
|
|
(314 |
) |
|
|
0.85 |
|
|
|
0.29 |
|
|
|
0.56 |
|
|
Savings |
|
|
32,073 |
|
|
|
10,971 |
|
|
|
21,102 |
|
|
|
20,942 |
|
|
|
160 |
|
| |
8,288 |
|
|
|
6,675 |
|
|
|
1,613 |
|
|
|
2.87 |
|
|
|
1.29 |
|
|
|
1.58 |
|
|
Time deposits |
|
|
60,048 |
|
|
|
21,776 |
|
|
|
38,272 |
|
|
|
28,320 |
|
|
|
9,952 |
|
| |
|
|
|
|
|
|
|
|
|
|
|
|
|
|
|
|
|
|
|
|
|
|
|
|
|
|
|
|
|
|
|
|
|
|
|
|
|
|
|
|
|
|
|
|
| |
48,249 |
|
|
|
46,322 |
|
|
|
1,927 |
|
|
|
2.62 |
|
|
|
1.19 |
|
|
|
1.43 |
|
|
Total interest bearing deposits |
|
|
319,200 |
|
|
|
139,338 |
|
|
|
179,862 |
|
|
|
162,083 |
|
|
|
17,779 |
|
| |
|
|
|
|
|
|
|
|
|
|
|
|
|
|
|
|
|
|
|
|
|
|
|
|
|
|
|
|
|
|
|
|
|
|
|
|
|
|
|
|
|
|
|
|
| |
15,017 |
|
|
|
16,110 |
|
|
|
(1,093 |
) |
|
|
|
|
|
|
|
|
|
|
|
|
|
Non-interest bearing demand deposits |
|
|
|
|
|
|
|
|
|
|
|
|
|
|
|
|
|
|
|
|
| |
|
|
|
|
|
|
|
|
|
|
|
|
|
|
|
|
|
|
|
|
|
|
|
|
|
|
|
|
|
|
|
|
|
|
|
|
|
|
|
|
|
|
|
|
| |
63,266 |
|
|
|
62,432 |
|
|
|
834 |
|
|
|
2.00 |
|
|
|
0.89 |
|
|
|
1.11 |
|
|
Total deposits |
|
|
319,200 |
|
|
|
139,338 |
|
|
|
179,862 |
|
|
|
162,083 |
|
|
|
17,779 |
|
| |
|
|
|
|
|
|
|
|
|
|
|
|
|
|
|
|
|
|
|
|
|
|
|
|
|
|
|
|
|
|
|
|
|
|
|
|
|
|
|
|
|
|
|
|
| |
94 |
|
|
|
450 |
|
|
|
(356 |
) |
|
|
5.64 |
|
|
|
3.96 |
|
|
|
1.68 |
|
|
Short-term borrowings |
|
|
1,342 |
|
|
|
4,488 |
|
|
|
(3,146 |
) |
|
|
1,404 |
|
|
|
(4,550 |
) |
| |
1,018 |
|
|
|
913 |
|
|
|
105 |
|
|
|
5.04 |
|
|
|
4.30 |
|
|
|
0.74 |
|
|
Other medium and long-term debt |
|
|
12,770 |
|
|
|
9,802 |
|
|
|
2,968 |
|
|
|
1,293 |
|
|
|
1,675 |
|
| |
|
|
|
|
|
|
|
|
|
|
|
|
|
|
|
|
|
|
|
|
|
|
|
|
|
|
|
|
|
|
|
|
|
|
|
|
|
|
|
|
|
|
|
|
| |
49,361 |
|
|
|
47,685 |
|
|
|
1,676 |
|
|
|
2.68 |
|
|
|
1.28 |
|
|
|
1.40 |
|
|
Total interest bearing liabilities (excluding demand deposits) |
|
|
333,312 |
|
|
|
153,628 |
|
|
|
179,684 |
|
|
|
164,780 |
|
|
|
14,904 |
|
| |
|
|
|
|
|
|
|
|
|
|
|
|
|
|
|
|
|
|
|
|
|
|
|
|
|
|
|
|
|
|
|
|
|
|
|
|
|
|
|
|
|
|
|
|
| |
4,507 |
|
|
|
4,052 |
|
|
|
455 |
|
|
|
|
|
|
|
|
|
|
|
|
|
|
Other sources of funds |
|
|
|
|
|
|
|
|
|
|
|
|
|
|
|
|
|
|
|
|
| |
|
|
|
|
|
|
|
|
|
|
|
|
|
|
|
|
|
|
|
|
|
|
|
|
|
|
|
|
|
|
|
|
|
|
|
|
|
|
|
|
|
|
|
|
| $ |
68,885 |
|
|
$ |
67,847 |
|
|
$ |
1,038 |
|
|
|
1.92 |
% |
|
|
0.90 |
% |
|
|
1.02 |
% |
|
Total source of funds |
|
|
333,312 |
|
|
|
153,628 |
|
|
|
179,684 |
|
|
|
164,780 |
|
|
|
14,904 |
|
| |
|
|
|
|
|
|
|
|
|
|
|
|
|
|
|
|
|
|
|
|
|
|
|
|
|
|
|
|
|
|
|
|
|
|
|
|
|
|
|
|
|
|
|
|
|
|
|
|
|
|
|
|
|
|
|
|
|
3.26 |
% |
|
|
3.64 |
% |
|
|
(0.38 |
)% |
|
Net interest margin/income on a taxable equivalent basis
(Non-GAAP) |
|
|
564,840 |
|
|
|
621,473 |
|
|
|
(56,633 |
) |
|
$ |
(92,446 |
) |
|
$ |
35,813 |
|
|
|
|
|
|
|
|
|
|
|
|
|
|
|
|
|
|
|
|
|
|
|
|
|
|
|
|
|
|
|
|
|
|
|
|
|
|
|
|
|
|
|
|
|
|
|
|
|
|
|
|
|
|
|
|
|
|
|
2.50 |
% |
|
|
3.26 |
% |
|
|
(0.76 |
)% |
|
Net interest spread |
|
|
|
|
|
|
|
|
|
|
|
|
|
|
|
|
|
|
|
|
|
|
|
|
|
|
|
|
|
|
|
|
|
|
|
|
|
|
|
|
|
|
|
|
|
|
|
|
|
|
|
|
|
|
|
|
|
|
|
|
|
|
|
|
|
|
|
|
|
|
|
|
|
|
|
|
|
|
|
|
|
|
|
|
|
|
|
|
|
Taxable equivalent adjustment |
|
|
30,660 |
|
|
|
61,907 |
|
|
|
(31,247 |
) |
|
|
|
|
|
|
|
|
|
|
|
|
|
|
|
|
|
|
|
|
|
|
|
|
|
|
|
|
|
|
|
|
|
|
|
|
|
|
|
|
|
|
|
|
|
|
|
|
|
|
|
|
|
|
|
|
|
|
|
|
|
|
|
|
|
|
3.08 |
% |
|
|
3.28 |
% |
|
|
(0.20 |
)% |
|
Net interest margin/ income non-taxable equivalent basis
(GAAP) |
|
$ |
534,180 |
|
|
$ |
559,566 |
|
|
$ |
(25,386 |
) |
|
|
|
|
|
|
|
|
|
|
|
|
|
|
|
|
|
|
|
|
|
|
|
|
|
|
|
|
|
|
|
|
|
|
|
|
|
|
|
|
|
|
|
|
|
|
|
|
|
|
|
|
|
Note: The changes that are not due solely to volume or rate are allocated to volume and rate based on the proportion of the
change in each category.
| [1] |
Average balances exclude unrealized gains or losses on debt securities available-for-sale and the unrealized loss related to certain securities transferred from available-for-sale to held-to-maturity. |
| [2] |
Includes interest bearing demand deposits corresponding to certain government entities in Puerto Rico.
|
15
Popular, Inc.
Financial Supplement to Fourth Quarter 2023 Earnings Release
Table F - Analysis of Levels and Yields on a Taxable Equivalent Basis (Non-GAAP) - YEAR-TO-DATE
(Unaudited)
|
|
|
|
|
|
|
|
|
|
|
|
|
|
|
|
|
|
|
|
|
|
|
|
|
|
|
|
|
|
|
|
|
|
|
|
|
|
|
|
|
|
|
|
|
| |
|
|
|
|
|
|
|
|
|
|
|
|
|
|
|
|
|
|
|
|
|
|
Variance |
|
| Average Volume |
|
|
Average Yields / Costs |
|
|
|
|
Interest |
|
|
Attributable to |
|
| 31-Dec-23 |
|
|
31-Dec-22 |
|
|
Variance |
|
|
31-Dec-23 |
|
|
31-Dec-22 |
|
|
Variance |
|
|
|
|
31-Dec-23 |
|
|
31-Dec-22 |
|
|
Variance |
|
|
Rate |
|
|
Volume |
|
| (In millions) |
|
|
|
|
|
|
|
|
|
|
|
|
|
(In thousands) |
|
| $ |
7,052 |
|
|
$ |
9,531 |
|
|
$ |
(2,479 |
) |
|
|
5.20 |
% |
|
|
1.24 |
% |
|
|
3.96 |
% |
|
Money market investments |
|
$ |
366,625 |
|
|
$ |
118,079 |
|
|
$ |
248,546 |
|
|
$ |
286,646 |
|
|
$ |
(38,100 |
) |
| |
27,926 |
|
|
|
29,743 |
|
|
|
(1,817 |
) |
|
|
2.20 |
|
|
|
2.23 |
|
|
|
(0.03 |
) |
|
Investment securities [1] |
|
|
615,758 |
|
|
|
664,278 |
|
|
|
(48,520 |
) |
|
|
(8,273 |
) |
|
|
(40,247 |
) |
| |
32 |
|
|
|
51 |
|
|
|
(19 |
) |
|
|
4.32 |
|
|
|
5.94 |
|
|
|
(1.62 |
) |
|
Trading securities |
|
|
1,376 |
|
|
|
3,049 |
|
|
|
(1,673 |
) |
|
|
(700 |
) |
|
|
(973 |
) |
| |
|
|
|
|
|
|
|
|
|
|
|
|
|
|
|
|
|
|
|
|
|
|
|
|
|
|
|
|
|
|
|
|
|
|
|
|
|
|
|
|
|
|
|
|
| |
35,010 |
|
|
|
39,325 |
|
|
|
(4,315 |
) |
|
|
2.81 |
|
|
|
2.00 |
|
|
|
0.81 |
|
|
Total money market, investment and trading securities |
|
|
983,759 |
|
|
|
785,406 |
|
|
|
198,353 |
|
|
|
277,673 |
|
|
|
(79,320 |
) |
| |
|
|
|
|
|
|
|
|
|
|
|
|
|
|
|
|
|
|
|
|
|
|
|
|
|
|
|
|
|
|
|
|
|
|
|
|
|
|
|
|
|
|
|
|
|
|
|
|
|
|
|
|
|
|
|
|
|
|
|
|
|
|
|
|
|
|
|
|
Loans: |
|
|
|
|
|
|
|
|
|
|
|
|
|
|
|
|
|
|
|
|
| |
16,469 |
|
|
|
14,562 |
|
|
|
1,907 |
|
|
|
6.55 |
|
|
|
5.46 |
|
|
|
1.09 |
|
|
Commercial |
|
|
1,079,171 |
|
|
|
795,115 |
|
|
|
284,056 |
|
|
|
171,681 |
|
|
|
112,375 |
|
| |
816 |
|
|
|
778 |
|
|
|
38 |
|
|
|
8.86 |
|
|
|
6.29 |
|
|
|
2.57 |
|
|
Construction |
|
|
72,309 |
|
|
|
48,920 |
|
|
|
23,389 |
|
|
|
20,927 |
|
|
|
2,462 |
|
| |
1,650 |
|
|
|
1,475 |
|
|
|
175 |
|
|
|
6.38 |
|
|
|
5.92 |
|
|
|
0.46 |
|
|
Leasing |
|
|
105,309 |
|
|
|
87,274 |
|
|
|
18,035 |
|
|
|
7,203 |
|
|
|
10,832 |
|
| |
7,482 |
|
|
|
7,322 |
|
|
|
160 |
|
|
|
5.55 |
|
|
|
5.34 |
|
|
|
0.21 |
|
|
Mortgage |
|
|
414,992 |
|
|
|
391,133 |
|
|
|
23,859 |
|
|
|
15,212 |
|
|
|
8,647 |
|
| |
3,115 |
|
|
|
2,743 |
|
|
|
372 |
|
|
|
13.19 |
|
|
|
11.66 |
|
|
|
1.53 |
|
|
Consumer |
|
|
410,910 |
|
|
|
319,920 |
|
|
|
90,990 |
|
|
|
43,806 |
|
|
|
47,184 |
|
| |
3,633 |
|
|
|
3,525 |
|
|
|
108 |
|
|
|
8.39 |
|
|
|
8.02 |
|
|
|
0.37 |
|
|
Auto |
|
|
304,660 |
|
|
|
282,533 |
|
|
|
22,127 |
|
|
|
13,257 |
|
|
|
8,870 |
|
| |
|
|
|
|
|
|
|
|
|
|
|
|
|
|
|
|
|
|
|
|
|
|
|
|
|
|
|
|
|
|
|
|
|
|
|
|
|
|
|
|
|
|
|
|
| |
33,165 |
|
|
|
30,405 |
|
|
|
2,760 |
|
|
|
7.20 |
|
|
|
6.33 |
|
|
|
0.87 |
|
|
Total loans |
|
|
2,387,351 |
|
|
|
1,924,895 |
|
|
|
462,456 |
|
|
|
272,086 |
|
|
|
190,370 |
|
| |
|
|
|
|
|
|
|
|
|
|
|
|
|
|
|
|
|
|
|
|
|
|
|
|
|
|
|
|
|
|
|
|
|
|
|
|
|
|
|
|
|
|
|
|
| $ |
68,175 |
|
|
$ |
69,730 |
|
|
$ |
(1,555 |
) |
|
|
4.94 |
% |
|
|
3.89 |
% |
|
|
1.05 |
% |
|
Total earning assets |
|
$ |
3,371,110 |
|
|
$ |
2,710,301 |
|
|
$ |
660,809 |
|
|
$ |
549,759 |
|
|
$ |
111,050 |
|
| |
|
|
|
|
|
|
|
|
|
|
|
|
|
|
|
|
|
|
|
|
|
|
|
|
|
|
|
|
|
|
|
|
|
|
|
|
|
|
|
|
|
|
|
|
|
|
|
|
|
|
|
|
|
|
|
|
|
|
|
|
|
|
|
|
|
|
|
|
Interest bearing deposits: |
|
|
|
|
|
|
|
|
|
|
|
|
|
|
|
|
|
|
|
|
| $ |
24,563 |
|
|
$ |
25,884 |
|
|
$ |
(1,321 |
) |
|
|
3.10 |
% |
|
|
0.61 |
% |
|
|
2.49 |
% |
|
NOW and money market [2] |
|
$ |
761,647 |
|
|
$ |
158,664 |
|
|
$ |
602,983 |
|
|
$ |
612,470 |
|
|
$ |
(9,487 |
) |
| |
14,900 |
|
|
|
15,886 |
|
|
|
(986 |
) |
|
|
0.68 |
|
|
|
0.20 |
|
|
|
0.48 |
|
|
Savings |
|
|
101,334 |
|
|
|
32,400 |
|
|
|
68,934 |
|
|
|
74,110 |
|
|
|
(5,176 |
) |
| |
7,776 |
|
|
|
6,853 |
|
|
|
923 |
|
|
|
2.41 |
|
|
|
0.90 |
|
|
|
1.51 |
|
|
Time deposits |
|
|
187,043 |
|
|
|
61,781 |
|
|
|
125,262 |
|
|
|
100,043 |
|
|
|
25,219 |
|
| |
|
|
|
|
|
|
|
|
|
|
|
|
|
|
|
|
|
|
|
|
|
|
|
|
|
|
|
|
|
|
|
|
|
|
|
|
|
|
|
|
|
|
|
|
| |
47,239 |
|
|
|
48,623 |
|
|
|
(1,384 |
) |
|
|
2.22 |
|
|
|
0.52 |
|
|
|
1.70 |
|
|
Total interest bearing deposits |
|
|
1,050,024 |
|
|
|
252,845 |
|
|
|
797,179 |
|
|
|
786,623 |
|
|
|
10,556 |
|
| |
|
|
|
|
|
|
|
|
|
|
|
|
|
|
|
|
|
|
|
|
|
|
|
|
|
|
|
|
|
|
|
|
|
|
|
|
|
|
|
|
|
|
|
|
| |
15,307 |
|
|
|
16,094 |
|
|
|
(787 |
) |
|
|
|
|
|
|
|
|
|
|
|
|
|
Non-interest bearing demand deposits |
|
|
|
|
|
|
|
|
|
|
|
|
|
|
|
|
|
|
|
|
| |
|
|
|
|
|
|
|
|
|
|
|
|
|
|
|
|
|
|
|
|
|
|
|
|
|
|
|
|
|
|
|
|
|
|
|
|
|
|
|
|
|
|
|
|
| |
62,546 |
|
|
|
64,717 |
|
|
|
(2,171 |
) |
|
|
1.68 |
|
|
|
0.39 |
|
|
|
1.29 |
|
|
Total deposits |
|
|
1,050,024 |
|
|
|
252,845 |
|
|
|
797,179 |
|
|
|
786,623 |
|
|
|
10,556 |
|
| |
|
|
|
|
|
|
|
|
|
|
|
|
|
|
|
|
|
|
|
|
|
|
|
|
|
|
|
|
|
|
|
|
|
|
|
|
|
|
|
|
|
|
|
|
| |
143 |
|
|
|
206 |
|
|
|
(63 |
) |
|
|
5.12 |
|
|
|
2.78 |
|
|
|
2.34 |
|
|
Short-term borrowings |
|
|
7,329 |
|
|
|
5,737 |
|
|
|
1,592 |
|
|
|
4,506 |
|
|
|
(2,914 |
) |
| |
1,109 |
|
|
|
939 |
|
|
|
170 |
|
|
|
5.09 |
|
|
|
4.26 |
|
|
|
0.83 |
|
|
Other medium and long-term debt |
|
|
56,430 |
|
|
|
39,970 |
|
|
|
16,460 |
|
|
|
9,458 |
|
|
|
7,002 |
|
| |
|
|
|
|
|
|
|
|
|
|
|
|
|
|
|
|
|
|
|
|
|
|
|
|
|
|
|
|
|
|
|
|
|
|
|
|
|
|
|
|
|
|
|
|
| |
48,491 |
|
|
|
49,768 |
|
|
|
(1,277 |
) |
|
|
2.30 |
|
|
|
0.60 |
|
|
|
1.70 |
|
|
Total interest bearing liabilities (excluding demand deposits) |
|
|
1,113,783 |
|
|
|
298,552 |
|
|
|
815,231 |
|
|
|
800,587 |
|
|
|
14,644 |
|
| |
|
|
|
|
|
|
|
|
|
|
|
|
|
|
|
|
|
|
|
|
|
|
|
|
|
|
|
|
|
|
|
|
|
|
|
|
|
|
|
|
|
|
|
|
| |
4,377 |
|
|
|
3,868 |
|
|
|
509 |
|
|
|
|
|
|
|
|
|
|
|
|
|
|
Other sources of funds |
|
|
|
|
|
|
|
|
|
|
|
|
|
|
|
|
|
|
|
|
| |
|
|
|
|
|
|
|
|
|
|
|
|
|
|
|
|
|
|
|
|
|
|
|
|
|
|
|
|
|
|
|
|
|
|
|
|
|
|
|
|
|
|
|
|
| $ |
68,175 |
|
|
$ |
69,730 |
|
|
$ |
(1,555 |
) |
|
|
1.63 |
% |
|
|
0.43 |
% |
|
|
1.20 |
% |
|
Total source of funds |
|
|
1,113,783 |
|
|
|
298,552 |
|
|
|
815,231 |
|
|
|
800,587 |
|
|
|
14,644 |
|
| |
|
|
|
|
|
|
|
|
|
|
|
|
|
|
|
|
|
|
|
|
|
|
|
|
|
|
|
|
|
|
|
|
|
|
|
|
|
|
|
|
|
|
|
|
|
|
|
|
|
|
|
|
|
|
|
|
|
3.31 |
% |
|
|
3.46 |
% |
|
|
(0.15 |
) % |
|
Net interest margin/ income on a taxable equivalent basis
(Non-GAAP) |
|
|
2,257,327 |
|
|
|
2,411,749 |
|
|
|
(154,422 |
) |
|
$ |
(250,828 |
) |
|
$ |
96,406 |
|
|
|
|
|
|
|
|
|
|
|
|
|
|
|
|
|
|
|
|
|
|
|
|
|
|
|
|
|
|
|
|
|
|
|
|
|
|
|
|
|
|
|
|
|
|
|
|
|
|
|
|
|
|
|
|
|
|
|
2.64 |
% |
|
|
3.29 |
% |
|
|
(0.65 |
) % |
|
Net interest spread |
|
|
|
|
|
|
|
|
|
|
|
|
|
|
|
|
|
|
|
|
|
|
|
|
|
|
|
|
|
|
|
|
|
|
|
|
|
|
|
|
|
|
|
|
|
|
|
|
|
|
|
|
|
|
|
|
|
|
|
|
|
|
|
|
|
|
|
|
|
|
|
|
|
|
|
|
|
|
|
|
|
|
|
|
|
|
|
|
|
Taxable equivalent adjustment |
|
|
125,803 |
|
|
|
244,390 |
|
|
|
(118,587 |
) |
|
|
|
|
|
|
|
|
|
|
|
|
|
|
|
|
|
|
|
|
|
|
|
|
|
|
|
|
|
|
|
|
|
|
|
|
|
|
|
|
|
|
|
|
|
|
|
|
|
|
|
|
|
|
|
|
|
|
|
|
|
|
|
|
|
|
3.13 |
% |
|
|
3.11 |
% |
|
|
0.02 |
% |
|
Net interest margin/ income non-taxable equivalent basis
(GAAP) |
|
$ |
2,131,524 |
|
|
$ |
2,167,359 |
|
|
$ |
(35,835 |
) |
|
|
|
|
|
|
|
|
|
|
|
|
|
|
|
|
|
|
|
|
|
|
|
|
|
|
|
|
|
|
|
|
|
|
|
|
|
|
|
|
|
|
|
|
|
|
|
|
|
|
|
|
|
Note: The changes that are not due solely to volume or rate are allocated to volume and rate based on the proportion of the
change in each category.
| [1] |
Average balances exclude unrealized gains or losses on debt securities available-for-sale and the unrealized loss related to certain securities transferred from available-for-sale to held-to-maturity. |
| [2] |
Includes interest bearing demand deposits corresponding to certain government entities in Puerto Rico.
|
16
Popular, Inc.
Financial Supplement to Fourth Quarter 2023 Earnings Release
Table G - Mortgage Banking Activities and Other Service Fees
(Unaudited)
Mortgage Banking Activities
|
|
|
|
|
|
|
|
|
|
|
|
|
|
|
|
|
|
|
|
|
|
|
|
|
|
|
|
|
|
|
|
|
| |
|
Quarters ended |
|
|
Variance |
|
|
Years ended |
|
|
Variance |
|
| (In thousands) |
|
31-Dec-23 |
|
|
30-Sep-23 |
|
|
31-Dec-22 |
|
|
Q4 2023
vs.Q3 2023 |
|
|
Q4 2023
vs.Q4 2022 |
|
|
31-Dec-23 |
|
|
31-Dec-22 |
|
|
2023 vs.
2022 |
|
| Mortgage servicing fees, net of fair value adjustments: |
|
|
|
|
|
|
|
|
|
|
|
|
|
|
|
|
|
|
|
|
|
|
|
|
|
|
|
|
|
|
|
|
| Mortgage servicing fees |
|
$ |
7,898 |
|
|
$ |
8,025 |
|
|
$ |
8,852 |
|
|
$ |
(127 |
) |
|
$ |
(954 |
) |
|
$ |
32,981 |
|
|
$ |
36,487 |
|
|
$ |
(3,506 |
) |
| Mortgage servicing rights fair value adjustments |
|
|
(1,204 |
) |
|
|
(2,793 |
) |
|
|
(2,610 |
) |
|
|
1,589 |
|
|
|
1,406 |
|
|
|
(11,589 |
) |
|
|
236 |
|
|
|
(11,825 |
) |
|
|
|
|
|
|
|
|
|
|
|
|
|
|
|
|
|
|
|
|
|
|
|
|
|
|
|
|
|
|
|
|
|
| Total mortgage servicing fees, net of fair value adjustments |
|
|
6,694 |
|
|
|
5,232 |
|
|
|
6,242 |
|
|
|
1,462 |
|
|
|
452 |
|
|
|
21,392 |
|
|
|
36,723 |
|
|
|
(15,331 |
) |
|
|
|
|
|
|
|
|
|
|
|
|
|
|
|
|
|
|
|
|
|
|
|
|
|
|
|
|
|
|
|
|
|
| Net gain (loss) on sale of loans, including valuation on loans held-for-sale |
|
|
45 |
|
|
|
(335 |
) |
|
|
123 |
|
|
|
380 |
|
|
|
(78 |
) |
|
|
(88 |
) |
|
|
(251 |
) |
|
|
163 |
|
|
|
|
|
|
|
|
|
|
|
|
|
|
|
|
|
|
|
|
|
|
|
|
|
|
|
|
|
|
|
|
|
|
| Trading account (loss) profit: |
|
|
|
|
|
|
|
|
|
|
|
|
|
|
|
|
|
|
|
|
|
|
|
|
|
|
|
|
|
|
|
|
| Unrealized (loss) gains on outstanding derivative positions |
|
|
(298 |
) |
|
|
45 |
|
|
|
— |
|
|
|
(343 |
) |
|
|
(298 |
) |
|
|
(138 |
) |
|
|
— |
|
|
|
(138 |
) |
| Realized (losses) gains on closed derivative positions |
|
|
(47 |
) |
|
|
494 |
|
|
|
310 |
|
|
|
(541 |
) |
|
|
(357 |
) |
|
|
614 |
|
|
|
6,635 |
|
|
|
(6,021 |
) |
|
|
|
|
|
|
|
|
|
|
|
|
|
|
|
|
|
|
|
|
|
|
|
|
|
|
|
|
|
|
|
|
|
| Total trading account (loss) profit |
|
|
(345 |
) |
|
|
539 |
|
|
|
310 |
|
|
|
(884 |
) |
|
|
(655 |
) |
|
|
476 |
|
|
|
6,635 |
|
|
|
(6,159 |
) |
|
|
|
|
|
|
|
|
|
|
|
|
|
|
|
|
|
|
|
|
|
|
|
|
|
|
|
|
|
|
|
|
|
| Losses on repurchased loans, including interest advances |
|
|
(6 |
) |
|
|
(43 |
) |
|
|
(113 |
) |
|
|
37 |
|
|
|
107 |
|
|
|
(283 |
) |
|
|
(657 |
) |
|
|
374 |
|
|
|
|
|
|
|
|
|
|
|
|
|
|
|
|
|
|
|
|
|
|
|
|
|
|
|
|
|
|
|
|
|
|
| Total mortgage banking activities |
|
$ |
6,388 |
|
|
$ |
5,393 |
|
|
$ |
6,562 |
|
|
$ |
995 |
|
|
$ |
(174 |
) |
|
$ |
21,497 |
|
|
$ |
42,450 |
|
|
$ |
(20,953 |
) |
|
|
|
|
|
|
|
|
|
|
|
|
|
|
|
|
|
|
|
|
|
|
|
|
|
|
|
|
|
|
|
|
|
|
|
|
|
|
|
|
|
|
| Other Service Fees |
|
|
|
|
|
|
|
|
|
|
|
|
|
|
|
|
|
|
|
|
|
|
|
|
|
|
|
|
|
|
|
|
|
|
|
|
|
| |
|
Quarters ended |
|
|
Variance |
|
|
Years ended |
|
|
Variance |
|
| (In thousands) |
|
31-Dec-23 |
|
|
30-Sep-23 |
|
|
31-Dec-22 |
|
|
Q4 2023
vs.Q3 2023 |
|
|
Q4 2023
vs.Q4 2022 |
|
|
31-Dec-23 |
|
|
31-Dec-22 |
|
|
2023 vs.
2022 |
|
| Other service fees: |
|
|
|
|
|
|
|
|
|
|
|
|
|
|
|
|
|
|
|
|
|
|
|
|
|
|
|
|
|
|
|
|
| Debit card fees |
|
$ |
13,944 |
|
|
$ |
13,577 |
|
|
$ |
13,379 |
|
|
$ |
367 |
|
|
$ |
565 |
|
|
$ |
54,287 |
|
|
$ |
50,173 |
|
|
$ |
4,114 |
|
| Insurance fees |
|
|
16,739 |
|
|
|
14,983 |
|
|
|
14,587 |
|
|
|
1,756 |
|
|
|
2,152 |
|
|
|
60,220 |
|
|
|
56,457 |
|
|
|
3,763 |
|
| Credit card fees |
|
|
41,439 |
|
|
|
40,804 |
|
|
|
39,777 |
|
|
|
635 |
|
|
|
1,662 |
|
|
|
165,385 |
|
|
|
149,403 |
|
|
|
15,982 |
|
| Sale and administration of investment products |
|
|
6,862 |
|
|
|
6,820 |
|
|
|
5,793 |
|
|
|
42 |
|
|
|
1,069 |
|
|
|
26,316 |
|
|
|
23,553 |
|
|
|
2,763 |
|
| Trust fees |
|
|
6,716 |
|
|
|
6,381 |
|
|
|
5,223 |
|
|
|
335 |
|
|
|
1,493 |
|
|
|
25,472 |
|
|
|
22,799 |
|
|
|
2,673 |
|
| Other fees |
|
|
10,992 |
|
|
|
10,842 |
|
|
|
10,263 |
|
|
|
150 |
|
|
|
729 |
|
|
|
42,760 |
|
|
|
31,624 |
|
|
|
11,136 |
|
|
|
|
|
|
|
|
|
|
|
|
|
|
|
|
|
|
|
|
|
|
|
|
|
|
|
|
|
|
|
|
|
|
| Total other service fees |
|
$ |
96,692 |
|
|
$ |
93,407 |
|
|
$ |
89,022 |
|
|
$ |
3,285 |
|
|
$ |
7,670 |
|
|
$ |
374,440 |
|
|
$ |
334,009 |
|
|
$ |
40,431 |
|
|
|
|
|
|
|
|
|
|
|
|
|
|
|
|
|
|
|
|
|
|
|
|
|
|
|
|
|
|
|
|
|
|
17
Popular, Inc.
Financial Supplement to Fourth Quarter 2023 Earnings Release
Table H - Loans and Deposits
(Unaudited)
Loans - Ending Balances
|
|
|
|
|
|
|
|
|
|
|
|
|
|
|
|
|
|
|
|
|
| |
|
|
|
|
|
|
|
|
|
|
Variance |
|
| (In thousands) |
|
31-Dec-23 |
|
|
30-Sep-23 |
|
|
31-Dec-22 |
|
|
Q4 2023 vs.Q3
2023 |
|
|
Q4 2023 vs.Q4
2022 |
|
| Loans
held-in-portfolio: |
|
|
|
|
|
|
|
|
|
|
|
|
|
|
|
|
|
| Commercial |
|
|
|
|
|
|
|
|
|
|
|
|
|
|
|
|
|
|
|
|
| Commercial multi-family |
|
$ |
2,415,620 |
|
|
$ |
2,328,433 |
|
|
$ |
2,321,713 |
|
|
|
87,187 |
|
|
|
93,907 |
|
| Commercial real estate non-owner occupied |
|
|
5,087,421 |
|
|
|
5,035,130 |
|
|
|
4,499,670 |
|
|
|
52,291 |
|
|
|
587,751 |
|
| Commercial real estate owner occupied |
|
|
3,080,635 |
|
|
|
3,044,905 |
|
|
|
3,078,549 |
|
|
|
35,730 |
|
|
|
2,086 |
|
| Commercial and industrial |
|
|
7,126,121 |
|
|
|
6,527,082 |
|
|
|
5,839,200 |
|
|
|
599,039 |
|
|
|
1,286,921 |
|
| Total Commercial |
|
|
17,709,797 |
|
|
|
16,935,550 |
|
|
|
15,739,132 |
|
|
|
774,247 |
|
|
|
1,970,665 |
|
| Construction |
|
|
959,280 |
|
|
|
922,112 |
|
|
|
757,984 |
|
|
|
37,168 |
|
|
|
201,296 |
|
| Leasing |
|
|
1,731,809 |
|
|
|
1,698,114 |
|
|
|
1,585,739 |
|
|
|
33,695 |
|
|
|
146,070 |
|
| Mortgage |
|
|
7,695,917 |
|
|
|
7,585,111 |
|
|
|
7,397,471 |
|
|
|
110,806 |
|
|
|
298,446 |
|
| Consumer |
|
|
|
|
|
|
|
|
|
|
|
|
|
|
|
|
|
|
|
|
| Credit cards |
|
|
1,135,747 |
|
|
|
1,077,428 |
|
|
|
1,041,870 |
|
|
|
58,319 |
|
|
|
93,877 |
|
| Home equity lines of credit |
|
|
65,953 |
|
|
|
67,499 |
|
|
|
71,916 |
|
|
|
(1,546 |
) |
|
|
(5,963 |
) |
| Personal |
|
|
1,945,247 |
|
|
|
1,952,168 |
|
|
|
1,823,579 |
|
|
|
(6,921 |
) |
|
|
121,668 |
|
| Auto |
|
|
3,660,780 |
|
|
|
3,633,196 |
|
|
|
3,512,530 |
|
|
|
27,584 |
|
|
|
148,250 |
|
| Other |
|
|
160,441 |
|
|
|
158,135 |
|
|
|
147,548 |
|
|
|
2,306 |
|
|
|
12,893 |
|
| Total Consumer |
|
|
6,968,168 |
|
|
|
6,888,426 |
|
|
|
6,597,443 |
|
|
|
79,742 |
|
|
|
370,725 |
|
|
|
|
|
|
|
|
|
|
|
|
|
|
|
|
|
|
|
|
|
|
| Total loans
held-in-portfolio |
|
$ |
35,064,971 |
|
|
$ |
34,029,313 |
|
|
$ |
32,077,769 |
|
|
$ |
1,035,658 |
|
|
$ |
2,987,202 |
|
| Loans
held-for-sale: |
|
|
|
|
|
|
|
|
|
|
|
|
|
|
|
|
|
|
|
|
| Mortgage |
|
$ |
4,301 |
|
|
$ |
5,239 |
|
|
$ |
5,381 |
|
|
$ |
(938 |
) |
|
$ |
(1,080 |
) |
|
|
|
|
|
|
|
|
|
|
|
|
|
|
|
|
|
|
|
|
|
| Total loans
held-for-sale |
|
$ |
4,301 |
|
|
$ |
5,239 |
|
|
$ |
5,381 |
|
|
$ |
(938 |
) |
|
$ |
(1,080 |
) |
|
|
|
|
|
|
|
|
|
|
|
|
|
|
|
|
|
|
|
|
|
| Total loans |
|
$ |
35,069,272 |
|
|
$ |
34,034,552 |
|
|
$ |
32,083,150 |
|
|
$ |
1,034,720 |
|
|
$ |
2,986,122 |
|
|
|
|
|
|
|
|
|
|
|
|
|
|
|
|
|
|
|
|
|
|
Deposits - Ending Balances
|
|
|
|
|
|
|
|
|
|
|
|
|
|
|
|
|
|
|
|
|
| |
|
|
|
|
|
|
|
|
|
|
Variance |
|
| (In thousands) |
|
31-Dec-23 |
|
|
30-Sep-23 |
|
|
31-Dec-22 |
|
|
Q4 2023 vs. Q3
2023 |
|
|
Q4 2023 vs.Q4
2022 |
|
| Demand deposits [1] |
|
$ |
27,579,054 |
|
|
$ |
27,942,782 |
|
|
$ |
26,382,605 |
|
|
$ |
(363,728 |
) |
|
$ |
1,196,449 |
|
| Savings, NOW and money market deposits
(non-brokered) |
|
|
26,817,844 |
|
|
|
26,452,382 |
|
|
|
27,265,156 |
|
|
|
365,462 |
|
|
|
(447,312 |
) |
| Savings, NOW and money market deposits (brokered) |
|
|
719,453 |
|
|
|
734,479 |
|
|
|
798,064 |
|
|
|
(15,026 |
) |
|
|
(78,611 |
) |
| Time deposits (non-brokered) |
|
|
7,546,138 |
|
|
|
7,264,156 |
|
|
|
6,442,886 |
|
|
|
281,982 |
|
|
|
1,103,252 |
|
| Time deposits (brokered CDs) |
|
|
955,754 |
|
|
|
943,801 |
|
|
|
338,516 |
|
|
|
11,953 |
|
|
|
617,238 |
|
|
|
|
|
|
|
|
|
|
|
|
|
|
|
|
|
|
|
|
|
|
| Total deposits |
|
$ |
63,618,243 |
|
|
$ |
63,337,600 |
|
|
$ |
61,227,227 |
|
|
$ |
280,643 |
|
|
$ |
2,391,016 |
|
|
|
|
|
|
|
|
|
|
|
|
|
|
|
|
|
|
|
|
|
|
| [1] |
Includes interest and non-interest bearing demand deposits.
|
18
Popular, Inc.
Financial Supplement to Fourth Quarter 2023 Earnings Release
Table I - Loan Delinquency -BPPR Operations
(Unaudited)
|
|
|
|
|
|
|
|
|
|
|
|
|
|
|
|
|
|
|
|
|
|
|
|
|
|
|
|
|
|
|
|
|
| 31-Dec-23 |
|
| BPPR |
|
| |
|
Past due |
|
|
|
|
|
|
|
|
Past due 90 days or more |
|
| |
|
30-59 |
|
|
60-89 |
|
|
90 days |
|
|
Total |
|
|
|
|
|
|
|
|
Non-accrual |
|
|
Accruing |
|
| (In thousands) |
|
days |
|
|
days |
|
|
or more |
|
|
past due |
|
|
Current |
|
|
Loans HIP |
|
|
loans |
|
|
loans |
|
| Commercial multi-family |
|
$ |
524 |
|
|
$ |
— |
|
|
$ |
1,991 |
|
|
$ |
2,515 |
|
|
$ |
289,427 |
|
|
$ |
291,942 |
|
|
$ |
1,991 |
|
|
$ |
— |
|
| Commercial real estate: |
|
|
|
|
|
|
|
|
|
|
|
|
|
|
|
|
|
|
|
|
|
|
|
|
|
|
|
|
|
|
|
|
| Non-owner occupied |
|
|
5,510 |
|
|
|
77 |
|
|
|
8,745 |
|
|
|
14,332 |
|
|
|
2,990,922 |
|
|
|
3,005,254 |
|
|
|
8,745 |
|
|
|
— |
|
| Owner occupied |
|
|
2,726 |
|
|
|
249 |
|
|
|
29,430 |
|
|
|
32,405 |
|
|
|
1,365,978 |
|
|
|
1,398,383 |
|
|
|
29,430 |
|
|
|
— |
|
| Commercial and industrial |
|
|
6,998 |
|
|
|
3,352 |
|
|
|
36,210 |
|
|
|
46,560 |
|
|
|
4,749,666 |
|
|
|
4,796,226 |
|
|
|
32,826 |
|
|
|
3,384 |
|
| Construction |
|
|
— |
|
|
|
— |
|
|
|
6,378 |
|
|
|
6,378 |
|
|
|
163,479 |
|
|
|
169,857 |
|
|
|
6,378 |
|
|
|
— |
|
| Mortgage |
|
|
260,897 |
|
|
|
114,282 |
|
|
|
416,528 |
|
|
|
791,707 |
|
|
|
5,600,117 |
|
|
|
6,391,824 |
|
|
|
175,106 |
|
|
|
241,422 |
|
| Leasing |
|
|
20,140 |
|
|
|
6,719 |
|
|
|
8,632 |
|
|
|
35,491 |
|
|
|
1,696,318 |
|
|
|
1,731,809 |
|
|
|
8,632 |
|
|
|
— |
|
| Consumer: |
|
|
|
|
|
|
|
|
|
|
|
|
|
|
|
|
|
|
|
|
|
|
|
|
|
|
|
|
|
|
|
|
| Credit cards |
|
|
13,243 |
|
|
|
9,912 |
|
|
|
23,281 |
|
|
|
46,436 |
|
|
|
1,089,292 |
|
|
|
1,135,728 |
|
|
|
— |
|
|
|
23,281 |
|
| Home equity lines of credit |
|
|
230 |
|
|
|
— |
|
|
|
26 |
|
|
|
256 |
|
|
|
2,392 |
|
|
|
2,648 |
|
|
|
— |
|
|
|
26 |
|
| Personal |
|
|
19,065 |
|
|
|
14,611 |
|
|
|
19,031 |
|
|
|
52,707 |
|
|
|
1,723,603 |
|
|
|
1,776,310 |
|
|
|
19,031 |
|
|
|
— |
|
| Auto |
|
|
100,061 |
|
|
|
27,443 |
|
|
|
45,615 |
|
|
|
173,119 |
|
|
|
3,487,661 |
|
|
|
3,660,780 |
|
|
|
45,615 |
|
|
|
— |
|
| Other |
|
|
1,641 |
|
|
|
204 |
|
|
|
1,213 |
|
|
|
3,058 |
|
|
|
147,104 |
|
|
|
150,162 |
|
|
|
964 |
|
|
|
249 |
|
|
|
|
|
|
|
|
|
|
|
|
|
|
|
|
|
|
|
|
|
|
|
|
|
|
|
|
|
|
|
|
|
|
| Total |
|
$ |
431,035 |
|
|
$ |
176,849 |
|
|
$ |
597,080 |
|
|
$ |
1,204,964 |
|
|
$ |
23,305,959 |
|
|
$ |
24,510,923 |
|
|
$ |
328,718 |
|
|
$ |
268,362 |
|
|
|
|
|
|
|
|
|
|
|
|
|
|
|
|
|
|
|
|
|
|
|
|
|
|
|
|
|
|
|
|
|
|
|
| 30-Sep-23 |
|
| BPPR |
|
| |
|
Past due |
|
|
|
|
|
|
|
|
Past due 90 days or more |
|
| |
|
30-59 |
|
|
60-89 |
|
|
90 days |
|
|
Total |
|
|
|
|
|
|
|
|
Non-accrual |
|
|
Accruing |
|
| (In thousands) |
|
days |
|
|
days |
|
|
or more |
|
|
past due |
|
|
Current |
|
|
Loans HIP |
|
|
loans |
|
|
loans |
|
| Commercial multi-family |
|
$ |
4,407 |
|
|
$ |
176 |
|
|
$ |
184 |
|
|
$ |
4,767 |
|
|
$ |
290,047 |
|
|
$ |
294,814 |
|
|
$ |
184 |
|
|
$ |
— |
|
| Commercial real estate: |
|
|
|
|
|
|
|
|
|
|
|
|
|
|
|
|
|
|
|
|
|
|
|
|
|
|
|
|
|
|
|
|
| Non-owner occupied |
|
|
1,274 |
|
|
|
— |
|
|
|
15,330 |
|
|
|
16,604 |
|
|
|
2,932,277 |
|
|
|
2,948,881 |
|
|
|
15,330 |
|
|
|
— |
|
| Owner occupied |
|
|
817 |
|
|
|
827 |
|
|
|
35,089 |
|
|
|
36,733 |
|
|
|
1,370,820 |
|
|
|
1,407,553 |
|
|
|
35,089 |
|
|
|
— |
|
| Commercial and industrial |
|
|
4,022 |
|
|
|
1,728 |
|
|
|
24,733 |
|
|
|
30,483 |
|
|
|
4,299,335 |
|
|
|
4,329,818 |
|
|
|
21,624 |
|
|
|
3,109 |
|
| Construction |
|
|
— |
|
|
|
— |
|
|
|
6,578 |
|
|
|
6,578 |
|
|
|
163,929 |
|
|
|
170,507 |
|
|
|
6,578 |
|
|
|
— |
|
| Mortgage |
|
|
241,962 |
|
|
|
100,679 |
|
|
|
430,430 |
|
|
|
773,071 |
|
|
|
5,516,197 |
|
|
|
6,289,268 |
|
|
|
187,443 |
|
|
|
242,987 |
|
| Leasing |
|
|
17,915 |
|
|
|
4,574 |
|
|
|
6,842 |
|
|
|
29,331 |
|
|
|
1,668,783 |
|
|
|
1,698,114 |
|
|
|
6,842 |
|
|
|
— |
|
| Consumer: |
|
|
|
|
|
|
|
|
|
|
|
|
|
|
|
|
|
|
|
|
|
|
|
|
|
|
|
|
|
|
|
|
| Credit cards |
|
|
11,218 |
|
|
|
8,133 |
|
|
|
17,719 |
|
|
|
37,070 |
|
|
|
1,040,341 |
|
|
|
1,077,411 |
|
|
|
— |
|
|
|
17,719 |
|
| Home equity lines of credit |
|
|
26 |
|
|
|
— |
|
|
|
— |
|
|
|
26 |
|
|
|
2,448 |
|
|
|
2,474 |
|
|
|
— |
|
|
|
— |
|
| Personal |
|
|
19,586 |
|
|
|
12,476 |
|
|
|
18,582 |
|
|
|
50,644 |
|
|
|
1,712,358 |
|
|
|
1,763,002 |
|
|
|
18,582 |
|
|
|
— |
|
| Auto |
|
|
89,453 |
|
|
|
23,019 |
|
|
|
40,268 |
|
|
|
152,740 |
|
|
|
3,480,456 |
|
|
|
3,633,196 |
|
|
|
40,268 |
|
|
|
— |
|
| Other |
|
|
567 |
|
|
|
388 |
|
|
|
2,152 |
|
|
|
3,107 |
|
|
|
144,425 |
|
|
|
147,532 |
|
|
|
1,885 |
|
|
|
267 |
|
|
|
|
|
|
|
|
|
|
|
|
|
|
|
|
|
|
|
|
|
|
|
|
|
|
|
|
|
|
|
|
|
|
| Total |
|
$ |
391,247 |
|
|
$ |
152,000 |
|
|
$ |
597,907 |
|
|
$ |
1,141,154 |
|
|
$ |
22,621,416 |
|
|
$ |
23,762,570 |
|
|
$ |
333,825 |
|
|
$ |
264,082 |
|
|
|
|
|
|
|
|
|
|
|
|
|
|
|
|
|
|
|
|
|
|
|
|
|
|
|
|
|
|
|
|
|
|
19
|
|
|
|
|
|
|
|
|
|
|
|
|
|
|
|
|
|
|
|
|
|
|
|
|
|
|
|
|
|
|
|
|
| Variance |
|
| |
|
Past due |
|
|
|
|
|
|
|
|
Past due 90 days or more |
|
| |
|
30-59 |
|
|
60-89 |
|
|
90 days |
|
|
Total |
|
|
|
|
|
|
|
|
Non-accrual |
|
|
Accruing |
|
| (In thousands) |
|
days |
|
|
days |
|
|
or more |
|
|
past due |
|
|
Current |
|
|
Loans HIP |
|
|
loans |
|
|
loans |
|
| Commercial multi-family |
|
$ |
(3,883 |
) |
|
$ |
(176 |
) |
|
$ |
1,807 |
|
|
$ |
(2,252 |
) |
|
$ |
(620 |
) |
|
$ |
(2,872 |
) |
|
$ |
1,807 |
|
|
$ |
— |
|
| Commercial real estate: |
|
|
|
|
|
|
|
|
|
|
|
|
|
|
|
|
|
|
|
|
|
|
|
|
|
|
|
|
|
|
|
|
| Non-owner occupied |
|
|
4,236 |
|
|
|
77 |
|
|
|
(6,585 |
) |
|
|
(2,272 |
) |
|
|
58,645 |
|
|
|
56,373 |
|
|
|
(6,585 |
) |
|
|
— |
|
| Owner occupied |
|
|
1,909 |
|
|
|
(578 |
) |
|
|
(5,659 |
) |
|
|
(4,328 |
) |
|
|
(4,842 |
) |
|
|
(9,170 |
) |
|
|
(5,659 |
) |
|
|
— |
|
| Commercial and industrial |
|
|
2,976 |
|
|
|
1,624 |
|
|
|
11,477 |
|
|
|
16,077 |
|
|
|
450,331 |
|
|
|
466,408 |
|
|
|
11,202 |
|
|
|
275 |
|
| Construction |
|
|
— |
|
|
|
— |
|
|
|
(200 |
) |
|
|
(200 |
) |
|
|
(450 |
) |
|
|
(650 |
) |
|
|
(200 |
) |
|
|
— |
|
| Mortgage |
|
|
18,935 |
|
|
|
13,603 |
|
|
|
(13,902 |
) |
|
|
18,636 |
|
|
|
83,920 |
|
|
|
102,556 |
|
|
|
(12,337 |
) |
|
|
(1,565 |
) |
| Leasing |
|
|
2,225 |
|
|
|
2,145 |
|
|
|
1,790 |
|
|
|
6,160 |
|
|
|
27,535 |
|
|
|
33,695 |
|
|
|
1,790 |
|
|
|
— |
|
| Consumer: |
|
|
|
|
|
|
|
|
|
|
|
|
|
|
|
|
|
|
|
|
|
|
|
|
|
|
|
|
|
|
|
|
| Credit cards |
|
|
2,025 |
|
|
|
1,779 |
|
|
|
5,562 |
|
|
|
9,366 |
|
|
|
48,951 |
|
|
|
58,317 |
|
|
|
— |
|
|
|
5,562 |
|
| Home equity lines of credit |
|
|
204 |
|
|
|
— |
|
|
|
26 |
|
|
|
230 |
|
|
|
(56 |
) |
|
|
174 |
|
|
|
— |
|
|
|
26 |
|
| Personal |
|
|
(521 |
) |
|
|
2,135 |
|
|
|
449 |
|
|
|
2,063 |
|
|
|
11,245 |
|
|
|
13,308 |
|
|
|
449 |
|
|
|
— |
|
| Auto |
|
|
10,608 |
|
|
|
4,424 |
|
|
|
5,347 |
|
|
|
20,379 |
|
|
|
7,205 |
|
|
|
27,584 |
|
|
|
5,347 |
|
|
|
— |
|
| Other |
|
|
1,074 |
|
|
|
(184 |
) |
|
|
(939 |
) |
|
|
(49 |
) |
|
|
2,679 |
|
|
|
2,630 |
|
|
|
(921 |
) |
|
|
(18 |
) |
|
|
|
|
|
|
|
|
|
|
|
|
|
|
|
|
|
|
|
|
|
|
|
|
|
|
|
|
|
|
|
|
|
| Total |
|
$ |
39,788 |
|
|
$ |
24,849 |
|
|
$ |
(827 |
) |
|
$ |
63,810 |
|
|
$ |
684,543 |
|
|
$ |
748,353 |
|
|
$ |
(5,107 |
) |
|
$ |
4,280 |
|
|
|
|
|
|
|
|
|
|
|
|
|
|
|
|
|
|
|
|
|
|
|
|
|
|
|
|
|
|
|
|
|
|
20
Popular, Inc.
Financial Supplement to Fourth Quarter 2023 Earnings Release
Table J - Loan Delinquency - Popular U.S. Operations
(Unaudited)
|
|
|
|
|
|
|
|
|
|
|
|
|
|
|
|
|
|
|
|
|
|
|
|
|
|
|
|
|
|
|
|
|
| 31-Dec-23 |
|
| Popular U.S. |
|
| |
|
Past due |
|
|
|
|
|
|
|
|
Past due 90 days or more |
|
| |
|
30-59 |
|
|
60-89 |
|
|
90 days |
|
|
Total |
|
|
|
|
|
|
|
|
Non-accrual |
|
|
Accruing |
|
| (In thousands) |
|
days |
|
|
days |
|
|
or more |
|
|
past due |
|
|
Current |
|
|
Loans HIP |
|
|
loans |
|
|
loans |
|
| Commercial multi-family |
|
$ |
9,141 |
|
|
$ |
2,001 |
|
|
$ |
— |
|
|
$ |
11,142 |
|
|
$ |
2,112,536 |
|
|
$ |
2,123,678 |
|
|
$ |
— |
|
|
$ |
— |
|
| Commercial real estate: |
|
|
|
|
|
|
|
|
|
|
|
|
|
|
|
|
|
|
|
|
|
|
|
|
|
|
|
|
|
|
|
|
| Non-owner occupied |
|
|
566 |
|
|
|
1,036 |
|
|
|
1,117 |
|
|
|
2,719 |
|
|
|
2,079,448 |
|
|
|
2,082,167 |
|
|
|
1,117 |
|
|
|
— |
|
| Owner occupied |
|
|
30,560 |
|
|
|
— |
|
|
|
6,274 |
|
|
|
36,834 |
|
|
|
1,645,418 |
|
|
|
1,682,252 |
|
|
|
6,274 |
|
|
|
— |
|
| Commercial and industrial |
|
|
7,815 |
|
|
|
697 |
|
|
|
3,881 |
|
|
|
12,393 |
|
|
|
2,317,502 |
|
|
|
2,329,895 |
|
|
|
3,772 |
|
|
|
109 |
|
| Construction |
|
|
— |
|
|
|
— |
|
|
|
— |
|
|
|
— |
|
|
|
789,423 |
|
|
|
789,423 |
|
|
|
— |
|
|
|
— |
|
| Mortgage |
|
|
48,818 |
|
|
|
7,821 |
|
|
|
11,191 |
|
|
|
67,830 |
|
|
|
1,236,263 |
|
|
|
1,304,093 |
|
|
|
11,191 |
|
|
|
— |
|
| Consumer: |
|
|
|
|
|
|
|
|
|
|
|
|
|
|
|
|
|
|
|
|
|
|
|
|
|
|
|
|
|
|
|
|
| Credit cards |
|
|
— |
|
|
|
— |
|
|
|
— |
|
|
|
— |
|
|
|
19 |
|
|
|
19 |
|
|
|
— |
|
|
|
— |
|
| Home equity lines of credit |
|
|
1,472 |
|
|
|
4 |
|
|
|
3,733 |
|
|
|
5,209 |
|
|
|
58,096 |
|
|
|
63,305 |
|
|
|
3,733 |
|
|
|
— |
|
| Personal |
|
|
2,222 |
|
|
|
1,948 |
|
|
|
2,805 |
|
|
|
6,975 |
|
|
|
161,962 |
|
|
|
168,937 |
|
|
|
2,805 |
|
|
|
— |
|
| Other |
|
|
4 |
|
|
|
— |
|
|
|
1 |
|
|
|
5 |
|
|
|
10,274 |
|
|
|
10,279 |
|
|
|
1 |
|
|
|
— |
|
|
|
|
|
|
|
|
|
|
|
|
|
|
|
|
|
|
|
|
|
|
|
|
|
|
|
|
|
|
|
|
|
|
| Total |
|
$ |
100,598 |
|
|
$ |
13,507 |
|
|
$ |
29,002 |
|
|
$ |
143,107 |
|
|
$ |
10,410,941 |
|
|
$ |
10,554,048 |
|
|
$ |
28,893 |
|
|
$ |
109 |
|
|
|
|
|
|
|
|
|
|
|
|
|
|
|
|
|
|
|
|
|
|
|
|
|
|
|
|
|
|
|
|
|
|
|
| 30-Sep-23 |
|
| Popular U.S. |
|
| |
|
Past due |
|
|
|
|
|
|
|
|
Past due 90 days or more |
|
| |
|
30-59 |
|
|
60-89 |
|
|
90 days |
|
|
Total |
|
|
|
|
|
|
|
|
Non-accrual |
|
|
Accruing |
|
| (In thousands) |
|
days |
|
|
days |
|
|
or more |
|
|
past due |
|
|
Current |
|
|
Loans HIP |
|
|
loans |
|
|
loans |
|
| Commercial multi-family |
|
$ |
1,332 |
|
|
$ |
— |
|
|
$ |
404 |
|
|
$ |
1,736 |
|
|
$ |
2,031,883 |
|
|
$ |
2,033,619 |
|
|
$ |
404 |
|
|
$ |
— |
|
| Commercial real estate: |
|
|
|
|
|
|
|
|
|
|
|
|
|
|
|
|
|
|
|
|
|
|
|
|
|
|
|
|
|
|
|
|
| Non-owner occupied |
|
|
2,628 |
|
|
|
— |
|
|
|
734 |
|
|
|
3,362 |
|
|
|
2,082,887 |
|
|
|
2,086,249 |
|
|
|
734 |
|
|
|
— |
|
| Owner occupied |
|
|
1,110 |
|
|
|
923 |
|
|
|
3,877 |
|
|
|
5,910 |
|
|
|
1,631,442 |
|
|
|
1,637,352 |
|
|
|
3,877 |
|
|
|
— |
|
| Commercial and industrial |
|
|
3,000 |
|
|
|
464 |
|
|
|
3,709 |
|
|
|
7,173 |
|
|
|
2,190,091 |
|
|
|
2,197,264 |
|
|
|
3,579 |
|
|
|
130 |
|
| Construction |
|
|
— |
|
|
|
— |
|
|
|
— |
|
|
|
— |
|
|
|
751,605 |
|
|
|
751,605 |
|
|
|
— |
|
|
|
— |
|
| Mortgage |
|
|
946 |
|
|
|
22,313 |
|
|
|
11,980 |
|
|
|
35,239 |
|
|
|
1,260,604 |
|
|
|
1,295,843 |
|
|
|
11,980 |
|
|
|
— |
|
| Consumer: |
|
|
|
|
|
|
|
|
|
|
|
|
|
|
|
|
|
|
|
|
|
|
|
|
|
|
|
|
|
|
|
|
| Credit cards |
|
|
— |
|
|
|
— |
|
|
|
— |
|
|
|
— |
|
|
|
17 |
|
|
|
17 |
|
|
|
— |
|
|
|
— |
|
| Home equity lines of credit |
|
|
1,045 |
|
|
|
335 |
|
|
|
4,085 |
|
|
|
5,465 |
|
|
|
59,560 |
|
|
|
65,025 |
|
|
|
4,085 |
|
|
|
— |
|
| Personal |
|
|
2,581 |
|
|
|
1,716 |
|
|
|
2,637 |
|
|
|
6,934 |
|
|
|
182,232 |
|
|
|
189,166 |
|
|
|
2,637 |
|
|
|
— |
|
| Other |
|
|
113 |
|
|
|
— |
|
|
|
402 |
|
|
|
515 |
|
|
|
10,088 |
|
|
|
10,603 |
|
|
|
402 |
|
|
|
— |
|
|
|
|
|
|
|
|
|
|
|
|
|
|
|
|
|
|
|
|
|
|
|
|
|
|
|
|
|
|
|
|
|
|
| Total |
|
$ |
12,755 |
|
|
$ |
25,751 |
|
|
$ |
27,828 |
|
|
$ |
66,334 |
|
|
$ |
10,200,409 |
|
|
$ |
10,266,743 |
|
|
$ |
27,698 |
|
|
$ |
130 |
|
|
|
|
|
|
|
|
|
|
|
|
|
|
|
|
|
|
|
|
|
|
|
|
|
|
|
|
|
|
|
|
|
|
21
|
|
|
|
|
|
|
|
|
|
|
|
|
|
|
|
|
|
|
|
|
|
|
|
|
|
|
|
|
|
|
|
|
| Variance |
|
| |
|
Past due |
|
|
|
|
|
|
|
|
Past due 90 days or more |
|
| |
|
30-59 |
|
|
60-89 |
|
|
90 days |
|
|
Total |
|
|
|
|
|
|
|
|
Non-accrual |
|
|
Accruing |
|
| (In thousands) |
|
days |
|
|
days |
|
|
or more |
|
|
past due |
|
|
Current |
|
|
Loans HIP |
|
|
loans |
|
|
loans |
|
| Commercial multi-family |
|
$ |
7,809 |
|
|
$ |
2,001 |
|
|
$ |
(404 |
) |
|
$ |
9,406 |
|
|
$ |
80,653 |
|
|
$ |
90,059 |
|
|
$ |
(404 |
) |
|
$ |
— |
|
| Commercial real estate: |
|
|
|
|
|
|
|
|
|
|
|
|
|
|
|
|
|
|
|
|
|
|
|
|
|
|
|
|
|
|
|
|
| Non-owner occupied |
|
|
(2,062 |
) |
|
|
1,036 |
|
|
|
383 |
|
|
|
(643 |
) |
|
|
(3,439 |
) |
|
|
(4,082 |
) |
|
|
383 |
|
|
|
— |
|
| Owner occupied |
|
|
29,450 |
|
|
|
(923 |
) |
|
|
2,397 |
|
|
|
30,924 |
|
|
|
13,976 |
|
|
|
44,900 |
|
|
|
2,397 |
|
|
|
— |
|
| Commercial and industrial |
|
|
4,815 |
|
|
|
233 |
|
|
|
172 |
|
|
|
5,220 |
|
|
|
127,411 |
|
|
|
132,631 |
|
|
|
193 |
|
|
|
(21 |
) |
| Construction |
|
|
— |
|
|
|
— |
|
|
|
— |
|
|
|
— |
|
|
|
37,818 |
|
|
|
37,818 |
|
|
|
— |
|
|
|
— |
|
| Mortgage |
|
|
47,872 |
|
|
|
(14,492 |
) |
|
|
(789 |
) |
|
|
32,591 |
|
|
|
(24,341 |
) |
|
|
8,250 |
|
|
|
(789 |
) |
|
|
— |
|
| Consumer: |
|
|
|
|
|
|
|
|
|
|
|
|
|
|
|
|
|
|
|
|
|
|
|
|
|
|
|
|
|
|
|
|
| Credit cards |
|
|
— |
|
|
|
— |
|
|
|
— |
|
|
|
— |
|
|
|
2 |
|
|
|
2 |
|
|
|
— |
|
|
|
— |
|
| Home equity lines of credit |
|
|
427 |
|
|
|
(331 |
) |
|
|
(352 |
) |
|
|
(256 |
) |
|
|
(1,464 |
) |
|
|
(1,720 |
) |
|
|
(352 |
) |
|
|
— |
|
| Personal |
|
|
(359 |
) |
|
|
232 |
|
|
|
168 |
|
|
|
41 |
|
|
|
(20,270 |
) |
|
|
(20,229 |
) |
|
|
168 |
|
|
|
— |
|
| Other |
|
|
(109 |
) |
|
|
— |
|
|
|
(401 |
) |
|
|
(510 |
) |
|
|
186 |
|
|
|
(324 |
) |
|
|
(401 |
) |
|
|
— |
|
|
|
|
|
|
|
|
|
|
|
|
|
|
|
|
|
|
|
|
|
|
|
|
|
|
|
|
|
|
|
|
|
|
| Total |
|
$ |
87,843 |
|
|
$ |
(12,244 |
) |
|
$ |
1,174 |
|
|
$ |
76,773 |
|
|
$ |
210,532 |
|
|
$ |
287,305 |
|
|
$ |
1,195 |
|
|
$ |
(21 |
) |
|
|
|
|
|
|
|
|
|
|
|
|
|
|
|
|
|
|
|
|
|
|
|
|
|
|
|
|
|
|
|
|
|
22
Popular, Inc.
Financial Supplement to Fourth Quarter 2023 Earnings Release
Table K - Loan Delinquency - Consolidated
(Unaudited)
|
|
|
|
|
|
|
|
|
|
|
|
|
|
|
|
|
|
|
|
|
|
|
|
|
|
|
|
|
|
|
|
|
| 31-Dec-23 |
|
| Popular, Inc. |
|
| |
|
Past due |
|
|
|
|
|
|
|
|
Past due 90 days or more |
|
| |
|
30-59 |
|
|
60-89 |
|
|
90 days |
|
|
Total |
|
|
|
|
|
|
|
|
Non-accrual |
|
|
Accruing |
|
| (In thousands) |
|
days |
|
|
days |
|
|
or more |
|
|
past due |
|
|
Current |
|
|
Loans HIP |
|
|
loans |
|
|
loans |
|
| Commercial multi-family |
|
$ |
9,665 |
|
|
$ |
2,001 |
|
|
$ |
1,991 |
|
|
$ |
13,657 |
|
|
$ |
2,401,963 |
|
|
$ |
2,415,620 |
|
|
$ |
1,991 |
|
|
$ |
— |
|
| Commercial real estate: |
|
|
|
|
|
|
|
|
|
|
|
|
|
|
|
|
|
|
|
|
|
|
|
|
|
|
|
|
|
|
|
|
| Non-owner occupied |
|
|
6,076 |
|
|
|
1,113 |
|
|
|
9,862 |
|
|
|
17,051 |
|
|
|
5,070,370 |
|
|
|
5,087,421 |
|
|
|
9,862 |
|
|
|
— |
|
| Owner occupied |
|
|
33,286 |
|
|
|
249 |
|
|
|
35,704 |
|
|
|
69,239 |
|
|
|
3,011,396 |
|
|
|
3,080,635 |
|
|
|
35,704 |
|
|
|
— |
|
| Commercial and industrial |
|
|
14,813 |
|
|
|
4,049 |
|
|
|
40,091 |
|
|
|
58,953 |
|
|
|
7,067,168 |
|
|
|
7,126,121 |
|
|
|
36,598 |
|
|
|
3,493 |
|
| Construction |
|
|
— |
|
|
|
— |
|
|
|
6,378 |
|
|
|
6,378 |
|
|
|
952,902 |
|
|
|
959,280 |
|
|
|
6,378 |
|
|
|
— |
|
| Mortgage |
|
|
309,715 |
|
|
|
122,103 |
|
|
|
427,719 |
|
|
|
859,537 |
|
|
|
6,836,380 |
|
|
|
7,695,917 |
|
|
|
186,297 |
|
|
|
241,422 |
|
| Leasing |
|
|
20,140 |
|
|
|
6,719 |
|
|
|
8,632 |
|
|
|
35,491 |
|
|
|
1,696,318 |
|
|
|
1,731,809 |
|
|
|
8,632 |
|
|
|
— |
|
| Consumer: |
|
|
|
|
|
|
|
|
|
|
|
|
|
|
|
|
|
|
|
|
|
|
|
|
|
|
|
|
|
|
|
|
| Credit cards |
|
|
13,243 |
|
|
|
9,912 |
|
|
|
23,281 |
|
|
|
46,436 |
|
|
|
1,089,311 |
|
|
|
1,135,747 |
|
|
|
— |
|
|
|
23,281 |
|
| Home equity lines of credit |
|
|
1,702 |
|
|
|
4 |
|
|
|
3,759 |
|
|
|
5,465 |
|
|
|
60,488 |
|
|
|
65,953 |
|
|
|
3,733 |
|
|
|
26 |
|
| Personal |
|
|
21,287 |
|
|
|
16,559 |
|
|
|
21,836 |
|
|
|
59,682 |
|
|
|
1,885,565 |
|
|
|
1,945,247 |
|
|
|
21,836 |
|
|
|
— |
|
| Auto |
|
|
100,061 |
|
|
|
27,443 |
|
|
|
45,615 |
|
|
|
173,119 |
|
|
|
3,487,661 |
|
|
|
3,660,780 |
|
|
|
45,615 |
|
|
|
— |
|
| Other |
|
|
1,645 |
|
|
|
204 |
|
|
|
1,214 |
|
|
|
3,063 |
|
|
|
157,378 |
|
|
|
160,441 |
|
|
|
965 |
|
|
|
249 |
|
|
|
|
|
|
|
|
|
|
|
|
|
|
|
|
|
|
|
|
|
|
|
|
|
|
|
|
|
|
|
|
|
|
| Total |
|
$ |
531,633 |
|
|
$ |
190,356 |
|
|
$ |
626,082 |
|
|
$ |
1,348,071 |
|
|
$ |
33,716,900 |
|
|
$ |
35,064,971 |
|
|
$ |
357,611 |
|
|
$ |
268,471 |
|
|
|
|
|
|
|
|
|
|
|
|
|
|
|
|
|
|
|
|
|
|
|
|
|
|
|
|
|
|
|
|
|
|
|
| 30-Sep-23 |
|
| Popular, Inc. |
|
| |
|
Past due |
|
|
|
|
|
|
|
|
Past due 90 days or more |
|
| |
|
30-59 |
|
|
60-89 |
|
|
90 days |
|
|
Total |
|
|
|
|
|
|
|
|
Non-accrual |
|
|
Accruing |
|
| (In thousands) |
|
days |
|
|
days |
|
|
or more |
|
|
past due |
|
|
Current |
|
|
Loans HIP |
|
|
loans |
|
|
loans |
|
| Commercial multi-family |
|
$ |
5,739 |
|
|
$ |
176 |
|
|
$ |
588 |
|
|
$ |
6,503 |
|
|
$ |
2,321,930 |
|
|
$ |
2,328,433 |
|
|
$ |
588 |
|
|
$ |
— |
|
| Commercial real estate: |
|
|
|
|
|
|
|
|
|
|
|
|
|
|
|
|
|
|
|
|
|
|
|
|
|
|
|
|
|
|
|
|
| Non-owner occupied |
|
|
3,902 |
|
|
|
— |
|
|
|
16,064 |
|
|
|
19,966 |
|
|
|
5,015,164 |
|
|
|
5,035,130 |
|
|
|
16,064 |
|
|
|
— |
|
| Owner occupied |
|
|
1,927 |
|
|
|
1,750 |
|
|
|
38,966 |
|
|
|
42,643 |
|
|
|
3,002,262 |
|
|
|
3,044,905 |
|
|
|
38,966 |
|
|
|
— |
|
| Commercial and industrial |
|
|
7,022 |
|
|
|
2,192 |
|
|
|
28,442 |
|
|
|
37,656 |
|
|
|
6,489,426 |
|
|
|
6,527,082 |
|
|
|
25,203 |
|
|
|
3,239 |
|
| Construction |
|
|
— |
|
|
|
— |
|
|
|
6,578 |
|
|
|
6,578 |
|
|
|
915,534 |
|
|
|
922,112 |
|
|
|
6,578 |
|
|
|
— |
|
| Mortgage |
|
|
242,908 |
|
|
|
122,992 |
|
|
|
442,410 |
|
|
|
808,310 |
|
|
|
6,776,801 |
|
|
|
7,585,111 |
|
|
|
199,423 |
|
|
|
242,987 |
|
| Leasing |
|
|
17,915 |
|
|
|
4,574 |
|
|
|
6,842 |
|
|
|
29,331 |
|
|
|
1,668,783 |
|
|
|
1,698,114 |
|
|
|
6,842 |
|
|
|
— |
|
| Consumer: |
|
|
|
|
|
|
|
|
|
|
|
|
|
|
|
|
|
|
|
|
|
|
|
|
|
|
|
|
|
|
|
|
| Credit cards |
|
|
11,218 |
|
|
|
8,133 |
|
|
|
17,719 |
|
|
|
37,070 |
|
|
|
1,040,358 |
|
|
|
1,077,428 |
|
|
|
— |
|
|
|
17,719 |
|
| Home equity lines of credit |
|
|
1,071 |
|
|
|
335 |
|
|
|
4,085 |
|
|
|
5,491 |
|
|
|
62,008 |
|
|
|
67,499 |
|
|
|
4,085 |
|
|
|
— |
|
| Personal |
|
|
22,167 |
|
|
|
14,192 |
|
|
|
21,219 |
|
|
|
57,578 |
|
|
|
1,894,590 |
|
|
|
1,952,168 |
|
|
|
21,219 |
|
|
|
— |
|
| Auto |
|
|
89,453 |
|
|
|
23,019 |
|
|
|
40,268 |
|
|
|
152,740 |
|
|
|
3,480,456 |
|
|
|
3,633,196 |
|
|
|
40,268 |
|
|
|
— |
|
| Other |
|
|
680 |
|
|
|
388 |
|
|
|
2,554 |
|
|
|
3,622 |
|
|
|
154,513 |
|
|
|
158,135 |
|
|
|
2,287 |
|
|
|
267 |
|
|
|
|
|
|
|
|
|
|
|
|
|
|
|
|
|
|
|
|
|
|
|
|
|
|
|
|
|
|
|
|
|
|
| Total |
|
$ |
404,002 |
|
|
$ |
177,751 |
|
|
$ |
625,735 |
|
|
$ |
1,207,488 |
|
|
$ |
32,821,825 |
|
|
$ |
34,029,313 |
|
|
$ |
361,523 |
|
|
$ |
264,212 |
|
|
|
|
|
|
|
|
|
|
|
|
|
|
|
|
|
|
|
|
|
|
|
|
|
|
|
|
|
|
|
|
|
|
23
|
|
|
|
|
|
|
|
|
|
|
|
|
|
|
|
|
|
|
|
|
|
|
|
|
|
|
|
|
|
|
|
|
| Variance |
|
| |
|
Past due |
|
|
|
|
|
|
|
|
Past due 90 days or more |
|
| |
|
30-59 |
|
|
60-89 |
|
|
90 days |
|
|
Total |
|
|
|
|
|
|
|
|
Non-accrual |
|
|
Accruing |
|
| (In thousands) |
|
days |
|
|
days |
|
|
or more |
|
|
past due |
|
|
Current |
|
|
Loans HIP |
|
|
loans |
|
|
loans |
|
| Commercial multi-family |
|
$ |
3,926 |
|
|
$ |
1,825 |
|
|
$ |
1,403 |
|
|
$ |
7,154 |
|
|
$ |
80,033 |
|
|
$ |
87,187 |
|
|
$ |
1,403 |
|
|
$ |
— |
|
| Commercial real estate: |
|
|
|
|
|
|
|
|
|
|
|
|
|
|
|
|
|
|
|
|
|
|
|
|
|
|
|
|
|
|
|
|
| Non-owner occupied |
|
|
2,174 |
|
|
|
1,113 |
|
|
|
(6,202 |
) |
|
|
(2,915 |
) |
|
|
55,206 |
|
|
|
52,291 |
|
|
|
(6,202 |
) |
|
|
— |
|
| Owner occupied |
|
|
31,359 |
|
|
|
(1,501 |
) |
|
|
(3,262 |
) |
|
|
26,596 |
|
|
|
9,134 |
|
|
|
35,730 |
|
|
|
(3,262 |
) |
|
|
— |
|
| Commercial and industrial |
|
|
7,791 |
|
|
|
1,857 |
|
|
|
11,649 |
|
|
|
21,297 |
|
|
|
577,742 |
|
|
|
599,039 |
|
|
|
11,395 |
|
|
|
254 |
|
| Construction |
|
|
— |
|
|
|
— |
|
|
|
(200 |
) |
|
|
(200 |
) |
|
|
37,368 |
|
|
|
37,168 |
|
|
|
(200 |
) |
|
|
— |
|
| Mortgage |
|
|
66,807 |
|
|
|
(889 |
) |
|
|
(14,691 |
) |
|
|
51,227 |
|
|
|
59,579 |
|
|
|
110,806 |
|
|
|
(13,126 |
) |
|
|
(1,565 |
) |
| Leasing |
|
|
2,225 |
|
|
|
2,145 |
|
|
|
1,790 |
|
|
|
6,160 |
|
|
|
27,535 |
|
|
|
33,695 |
|
|
|
1,790 |
|
|
|
— |
|
| Consumer: |
|
|
|
|
|
|
|
|
|
|
|
|
|
|
|
|
|
|
|
|
|
|
|
|
|
|
|
|
|
|
|
|
| Credit cards |
|
|
2,025 |
|
|
|
1,779 |
|
|
|
5,562 |
|
|
|
9,366 |
|
|
|
48,953 |
|
|
|
58,319 |
|
|
|
— |
|
|
|
5,562 |
|
| Home equity lines of credit |
|
|
631 |
|
|
|
(331 |
) |
|
|
(326 |
) |
|
|
(26 |
) |
|
|
(1,520 |
) |
|
|
(1,546 |
) |
|
|
(352 |
) |
|
|
26 |
|
| Personal |
|
|
(880 |
) |
|
|
2,367 |
|
|
|
617 |
|
|
|
2,104 |
|
|
|
(9,025 |
) |
|
|
(6,921 |
) |
|
|
617 |
|
|
|
— |
|
| Auto |
|
|
10,608 |
|
|
|
4,424 |
|
|
|
5,347 |
|
|
|
20,379 |
|
|
|
7,205 |
|
|
|
27,584 |
|
|
|
5,347 |
|
|
|
— |
|
| Other |
|
|
965 |
|
|
|
(184 |
) |
|
|
(1,340 |
) |
|
|
(559 |
) |
|
|
2,865 |
|
|
|
2,306 |
|
|
|
(1,322 |
) |
|
|
(18 |
) |
|
|
|
|
|
|
|
|
|
|
|
|
|
|
|
|
|
|
|
|
|
|
|
|
|
|
|
|
|
|
|
|
|
| Total |
|
$ |
127,631 |
|
|
$ |
12,605 |
|
|
$ |
347 |
|
|
$ |
140,583 |
|
|
$ |
895,075 |
|
|
$ |
1,035,658 |
|
|
$ |
(3,912 |
) |
|
$ |
4,259 |
|
|
|
|
|
|
|
|
|
|
|
|
|
|
|
|
|
|
|
|
|
|
|
|
|
|
|
|
|
|
|
|
|
|
24
Popular, Inc.
Financial Supplement to Fourth Quarter 2023 Earnings Release
Table L - Non-Performing Assets
(Unaudited)
|
|
|
|
|
|
|
|
|
|
|
|
|
|
|
|
|
|
|
|
|
|
|
|
|
|
|
|
|
|
|
|
|
| |
|
|
|
|
|
|
|
|
|
|
|
|
|
|
|
|
|
|
|
Variance |
|
| (In thousands) |
|
31-Dec-23 |
|
|
As a % of
loans HIP by
category |
|
|
30-Sep-23 |
|
|
As a % of
loans HIP by
category |
|
|
31-Dec-22 |
|
|
As a % of
loans HIP by
category |
|
|
Q4 2023 vs.
Q3 2023 |
|
|
Q4 2023 vs.
Q4 2022 |
|
| Non-accrual loans: |
|
|
|
|
|
|
|
|
|
|
|
|
|
|
|
|
|
|
|
|
|
|
|
|
|
|
|
|
|
|
|
|
| Commercial |
|
|
|
|
|
|
|
|
|
|
|
|
|
|
|
|
|
|
|
|
|
|
|
|
|
|
|
|
|
|
|
|
| Commercial multi-family |
|
$ |
1,991 |
|
|
|
0.1 |
% |
|
$ |
588 |
|
|
|
— |
% |
|
$ |
242 |
|
|
|
— |
% |
|
$ |
1,403 |
|
|
$ |
1,749 |
|
| Commercial real estate non-owner occupied |
|
|
9,862 |
|
|
|
0.2 |
|
|
|
16,064 |
|
|
|
0.3 |
|
|
|
25,116 |
|
|
|
0.6 |
|
|
|
(6,202 |
) |
|
|
(15,254 |
) |
| Commercial real estate owner occupied |
|
|
35,704 |
|
|
|
1.2 |
|
|
|
38,966 |
|
|
|
1.3 |
|
|
|
29,085 |
|
|
|
0.9 |
|
|
|
(3,262 |
) |
|
|
6,619 |
|
| Commercial and industrial |
|
|
36,598 |
|
|
|
0.5 |
|
|
|
25,203 |
|
|
|
0.4 |
|
|
|
38,596 |
|
|
|
0.7 |
|
|
|
11,395 |
|
|
|
(1,998 |
) |
| Total Commercial |
|
|
84,155 |
|
|
|
0.5 |
|
|
|
80,821 |
|
|
|
0.5 |
|
|
|
93,039 |
|
|
|
0.6 |
|
|
|
3,334 |
|
|
|
(8,884 |
) |
| Construction |
|
|
6,378 |
|
|
|
0.7 |
|
|
|
6,578 |
|
|
|
0.7 |
|
|
|
— |
|
|
|
— |
|
|
|
(200 |
) |
|
|
6,378 |
|
| Leasing |
|
|
8,632 |
|
|
|
0.5 |
|
|
|
6,842 |
|
|
|
0.4 |
|
|
|
5,941 |
|
|
|
0.4 |
|
|
|
1,790 |
|
|
|
2,691 |
|
| Mortgage |
|
|
186,297 |
|
|
|
2.4 |
|
|
|
199,423 |
|
|
|
2.6 |
|
|
|
262,879 |
|
|
|
3.6 |
|
|
|
(13,126 |
) |
|
|
(76,582 |
) |
| Consumer |
|
|
|
|
|
|
|
|
|
|
|
|
|
|
|
|
|
|
|
|
|
|
|
|
|
|
|
|
|
|
|
|
| Home equity lines of credit |
|
|
3,733 |
|
|
|
5.7 |
|
|
|
4,085 |
|
|
|
6.1 |
|
|
|
4,110 |
|
|
|
5.7 |
|
|
|
(352 |
) |
|
|
(377 |
) |
| Personal |
|
|
21,836 |
|
|
|
1.1 |
|
|
|
21,219 |
|
|
|
1.1 |
|
|
|
20,040 |
|
|
|
1.1 |
|
|
|
617 |
|
|
|
1,796 |
|
| Auto |
|
|
45,615 |
|
|
|
1.2 |
|
|
|
40,268 |
|
|
|
1.1 |
|
|
|
40,978 |
|
|
|
1.2 |
|
|
|
5,347 |
|
|
|
4,637 |
|
| Other Consumer |
|
|
965 |
|
|
|
0.6 |
|
|
|
2,287 |
|
|
|
1.4 |
|
|
|
12,454 |
|
|
|
8.4 |
|
|
|
(1,322 |
) |
|
|
(11,489 |
) |
| Total Consumer |
|
|
72,149 |
|
|
|
1.0 |
|
|
|
67,859 |
|
|
|
1.0 |
|
|
|
77,582 |
|
|
|
1.2 |
|
|
|
4,290 |
|
|
|
(5,433 |
) |
|
|
|
|
|
|
|
|
|
|
|
|
|
|
|
|
|
|
|
|
|
|
|
|
|
|
|
|
|
|
|
|
|
| Total non-performing loans
held-in-portfolio |
|
|
357,611 |
|
|
|
1.0 |
% |
|
|
361,523 |
|
|
|
1.1 |
% |
|
|
439,441 |
|
|
|
1.4 |
% |
|
|
(3,912 |
) |
|
|
(81,830 |
) |
| Other real estate owned (“OREO”) |
|
|
80,416 |
|
|
|
|
|
|
|
82,322 |
|
|
|
|
|
|
|
89,126 |
|
|
|
|
|
|
|
(1,906 |
) |
|
|
(8,710 |
) |
|
|
|
|
|
|
|
|
|
|
|
|
|
|
|
|
|
|
|
|
|
|
|
|
|
|
|
|
|
|
|
|
|
| Total non-performing assets [1] |
|
$ |
438,027 |
|
|
|
|
|
|
$ |
443,845 |
|
|
|
|
|
|
$ |
528,567 |
|
|
|
|
|
|
$ |
(5,818 |
) |
|
$ |
(90,540 |
) |
|
|
|
|
|
|
|
|
|
|
|
|
|
|
|
|
|
|
|
|
|
|
|
|
|
|
|
|
|
|
|
|
|
| Accruing loans past due 90 days or more [2] |
|
$ |
268,471 |
|
|
|
|
|
|
$ |
264,212 |
|
|
|
|
|
|
$ |
351,614 |
|
|
|
|
|
|
$ |
4,259 |
|
|
$ |
(83,143 |
) |
|
|
|
|
|
|
|
|
|
|
|
|
|
|
|
|
|
|
|
|
|
|
|
|
|
|
|
|
|
|
|
|
|
| Ratios: |
|
|
|
|
|
|
|
|
|
|
|
|
|
|
|
|
|
|
|
|
|
|
|
|
|
|
|
|
|
|
|
|
| Non-performing assets to total assets |
|
|
0.62 |
% |
|
|
|
|
|
|
0.64 |
% |
|
|
|
|
|
|
0.78 |
% |
|
|
|
|
|
|
|
|
|
|
|
|
| Non-performing loans held-in-portfolio to loans held-in-portfolio |
|
|
1.02 |
|
|
|
|
|
|
|
1.06 |
|
|
|
|
|
|
|
1.37 |
|
|
|
|
|
|
|
|
|
|
|
|
|
| Allowance for credit losses to loans held-in-portfolio |
|
|
2.08 |
|
|
|
|
|
|
|
2.09 |
|
|
|
|
|
|
|
2.25 |
|
|
|
|
|
|
|
|
|
|
|
|
|
| Allowance for credit losses to non-performing loans,
excluding loans held-for-sale |
|
|
203.95 |
|
|
|
|
|
|
|
196.69 |
|
|
|
|
|
|
|
163.91 |
|
|
|
|
|
|
|
|
|
|
|
|
|
| [1] |
There were no non-performing loans held-for-sale as of December 31, 2023, September 30, 2023 and December 31, 2022. |
| [2] |
It is the Corporation’s policy to report delinquent residential mortgage loans insured by FHA or
guaranteed by the VA as accruing loans past due 90 days or more as opposed to non-performing since the principal repayment is insured. The balance of these loans includes $11 million at December 31,
2023, related to the rebooking of loans previously pooled into GNMA securities, in which the Corporation had a buy-back option as further described below ( September 30, 2023 - $8 million;
December 31, 2022 - $14 million). Under the GNMA program, issuers such as BPPR have the option but not the obligation to repurchase loans that are 90 days or more past due. For accounting purposes, these loans subject to the repurchase option
are required to be reflected (rebooked) on the financial statements of BPPR with an offsetting liability. These balances include $106 million of residential mortgage loans insured by FHA or guaranteed by the VA that are no longer accruing
interest as of December 31, 2023 (September 30, 2023 - $115 million; December 31, 2022 - $190 million). Furthermore, the Corporation has approximately $38 million in reverse mortgage loans which are guaranteed by FHA, but which
are currently not accruing interest. Due to the guaranteed nature of the loans, it is the Corporation’s policy to exclude these balances from non-performing assets (September 30, 2023- $39 million;
December 31, 2022 - $42 million). |
25
Popular, Inc.
Financial Supplement to Fourth Quarter 2023 Earnings Release
Table M - Activity in Non-Performing Loans
(Unaudited)
Commercial loans held-in-portfolio:
|
|
|
|
|
|
|
|
|
|
|
|
|
|
|
|
|
|
|
|
|
|
|
|
|
| |
|
Quarter ended |
|
|
Quarter ended |
|
| |
|
31-Dec-23 |
|
|
30-Sep-23 |
|
| (In thousands) |
|
BPPR |
|
|
Popular U.S. |
|
|
Popular, Inc. |
|
|
BPPR |
|
|
Popular U.S. |
|
|
Popular, Inc. |
|
| Beginning balance NPLs |
|
$ |
72,227 |
|
|
$ |
8,594 |
|
|
$ |
80,821 |
|
|
$ |
88,716 |
|
|
$ |
11,610 |
|
|
$ |
100,326 |
|
| Plus: |
|
|
|
|
|
|
|
|
|
|
|
|
|
|
|
|
|
|
|
|
|
|
|
|
| New non-performing loans |
|
|
22,009 |
|
|
|
3,859 |
|
|
|
25,868 |
|
|
|
2,736 |
|
|
|
1,324 |
|
|
|
4,060 |
|
| Advances on existing non-performing loans |
|
|
— |
|
|
|
515 |
|
|
|
515 |
|
|
|
— |
|
|
|
7 |
|
|
|
7 |
|
| Less: |
|
|
|
|
|
|
|
|
|
|
|
|
|
|
|
|
|
|
|
|
|
|
|
|
| Non-performing loans transferred to OREO |
|
|
(5,484 |
) |
|
|
— |
|
|
|
(5,484 |
) |
|
|
(138 |
) |
|
|
— |
|
|
|
(138 |
) |
| Non-performing loans
charged-off |
|
|
(5,427 |
) |
|
|
— |
|
|
|
(5,427 |
) |
|
|
(969 |
) |
|
|
(2,446 |
) |
|
|
(3,415 |
) |
| Loans returned to accrual status / loan collections |
|
|
(10,333 |
) |
|
|
(1,805 |
) |
|
|
(12,138 |
) |
|
|
(18,118 |
) |
|
|
(1,901 |
) |
|
|
(20,019 |
) |
|
|
|
|
|
|
|
|
|
|
|
|
|
|
|
|
|
|
|
|
|
|
|
|
|
| Ending balance NPLs |
|
$ |
72,992 |
|
|
$ |
11,163 |
|
|
$ |
84,155 |
|
|
$ |
72,227 |
|
|
$ |
8,594 |
|
|
$ |
80,821 |
|
|
|
|
|
|
|
|
|
|
|
|
|
|
|
|
|
|
|
|
|
|
|
|
|
|
Construction loans held-in-portfolio:
|
|
|
|
|
|
|
|
|
|
|
|
|
|
|
|
|
|
|
|
|
|
|
|
|
| |
|
Quarter ended |
|
|
Quarter ended |
|
| |
|
31-Dec-23 |
|
|
30-Sep-23 |
|
| (In thousands) |
|
BPPR |
|
|
Popular U.S. |
|
|
Popular, Inc. |
|
|
BPPR |
|
|
Popular U.S. |
|
|
Popular, Inc. |
|
| Beginning balance NPLs |
|
$ |
6,578 |
|
|
$ |
— |
|
|
$ |
6,578 |
|
|
$ |
9,284 |
|
|
$ |
— |
|
|
$ |
9,284 |
|
| Less: |
|
|
|
|
|
|
|
|
|
|
|
|
|
|
|
|
|
|
|
|
|
|
|
|
| Non-performing loans
charged-off |
|
|
— |
|
|
|
— |
|
|
|
— |
|
|
|
(2,537 |
) |
|
|
— |
|
|
|
(2,537 |
) |
| Loans returned to accrual status / loan collections |
|
|
(200 |
) |
|
|
— |
|
|
|
(200 |
) |
|
|
(169 |
) |
|
|
— |
|
|
|
(169 |
) |
|
|
|
|
|
|
|
|
|
|
|
|
|
|
|
|
|
|
|
|
|
|
|
|
|
| Ending balance NPLs |
|
$ |
6,378 |
|
|
$ |
— |
|
|
$ |
6,378 |
|
|
$ |
6,578 |
|
|
$ |
— |
|
|
$ |
6,578 |
|
|
|
|
|
|
|
|
|
|
|
|
|
|
|
|
|
|
|
|
|
|
|
|
|
|
Mortgage loans held-in-portfolio:
|
|
|
|
|
|
|
|
|
|
|
|
|
|
|
|
|
|
|
|
|
|
|
|
|
| |
|
Quarter ended |
|
|
Quarter ended |
|
| |
|
31-Dec-23 |
|
|
30-Sep-23 |
|
| (In thousands) |
|
BPPR |
|
|
Popular U.S. |
|
|
Popular, Inc. |
|
|
BPPR |
|
|
Popular U.S. |
|
|
Popular, Inc. |
|
| Beginning balance NPLs |
|
$ |
187,443 |
|
|
$ |
11,980 |
|
|
$ |
199,423 |
|
|
$ |
194,219 |
|
|
$ |
14,577 |
|
|
$ |
208,796 |
|
| Plus: |
|
|
|
|
|
|
|
|
|
|
|
|
|
|
|
|
|
|
|
|
|
|
|
|
| New non-performing loans |
|
|
30,406 |
|
|
|
4,179 |
|
|
|
34,585 |
|
|
|
34,657 |
|
|
|
4,503 |
|
|
|
39,160 |
|
| Advances on existing non-performing loans |
|
|
— |
|
|
|
11 |
|
|
|
11 |
|
|
|
— |
|
|
|
5 |
|
|
|
5 |
|
| Less: |
|
|
|
|
|
|
|
|
|
|
|
|
|
|
|
|
|
|
|
|
|
|
|
|
| Non-performing loans transferred to OREO |
|
|
(5,423 |
) |
|
|
— |
|
|
|
(5,423 |
) |
|
|
(5,519 |
) |
|
|
— |
|
|
|
(5,519 |
) |
| Non-performing loans
charged-off |
|
|
153 |
|
|
|
— |
|
|
|
153 |
|
|
|
152 |
|
|
|
— |
|
|
|
152 |
|
| Loans returned to accrual status / loan collections |
|
|
(37,473 |
) |
|
|
(4,979 |
) |
|
|
(42,452 |
) |
|
|
(36,066 |
) |
|
|
(7,105 |
) |
|
|
(43,171 |
) |
|
|
|
|
|
|
|
|
|
|
|
|
|
|
|
|
|
|
|
|
|
|
|
|
|
| Ending balance NPLs |
|
$ |
175,106 |
|
|
$ |
11,191 |
|
|
$ |
186,297 |
|
|
$ |
187,443 |
|
|
$ |
11,980 |
|
|
$ |
199,423 |
|
|
|
|
|
|
|
|
|
|
|
|
|
|
|
|
|
|
|
|
|
|
|
|
|
|
26
Total non-performing loans held-in-portfolio (excluding consumer):
|
|
|
|
|
|
|
|
|
|
|
|
|
|
|
|
|
|
|
|
|
|
|
|
|
| |
|
Quarter ended |
|
|
Quarter ended |
|
| |
|
31-Dec-23 |
|
|
30-Sep-23 |
|
| (In thousands) |
|
BPPR |
|
|
Popular U.S. |
|
|
Popular, Inc. |
|
|
BPPR |
|
|
Popular U.S. |
|
|
Popular, Inc. |
|
| Beginning balance NPLs |
|
$ |
266,248 |
|
|
$ |
20,574 |
|
|
$ |
286,822 |
|
|
$ |
292,219 |
|
|
$ |
26,187 |
|
|
$ |
318,406 |
|
| Plus: |
|
|
|
|
|
|
|
|
|
|
|
|
|
|
|
|
|
|
|
|
|
|
|
|
| New non-performing loans |
|
|
52,415 |
|
|
|
8,038 |
|
|
|
60,453 |
|
|
|
37,393 |
|
|
|
5,827 |
|
|
|
43,220 |
|
| Advances on existing non-performing loans |
|
|
— |
|
|
|
526 |
|
|
|
526 |
|
|
|
— |
|
|
|
12 |
|
|
|
12 |
|
| Less: |
|
|
|
|
|
|
|
|
|
|
|
|
|
|
|
|
|
|
|
|
|
|
|
|
| Non-performing loans transferred to OREO |
|
|
(10,907 |
) |
|
|
— |
|
|
|
(10,907 |
) |
|
|
(5,657 |
) |
|
|
— |
|
|
|
(5,657 |
) |
| Non-performing loans
charged-off |
|
|
(5,274 |
) |
|
|
— |
|
|
|
(5,274 |
) |
|
|
(3,354 |
) |
|
|
(2,446 |
) |
|
|
(5,800 |
) |
| Loans returned to accrual status / loan collections |
|
|
(48,006 |
) |
|
|
(6,784 |
) |
|
|
(54,790 |
) |
|
|
(54,353 |
) |
|
|
(9,006 |
) |
|
|
(63,359 |
) |
|
|
|
|
|
|
|
|
|
|
|
|
|
|
|
|
|
|
|
|
|
|
|
|
|
| Ending balance NPLs |
|
$ |
254,476 |
|
|
$ |
22,354 |
|
|
$ |
276,830 |
|
|
$ |
266,248 |
|
|
$ |
20,574 |
|
|
$ |
286,822 |
|
|
|
|
|
|
|
|
|
|
|
|
|
|
|
|
|
|
|
|
|
|
|
|
|
|
27
Popular, Inc.
Financial Supplement to Fourth Quarter 2023 Earnings Release
Table N - Allowance for Credit Losses, Net Charge-offs and Related Ratios
(Unaudited)
|
|
|
|
|
|
|
|
|
|
|
|
|
| |
|
Quarters ended |
|
| (In thousands) |
|
31-Dec-23 |
|
|
30-Sep-23 |
|
|
31-Dec-22 |
|
| Balance at beginning of period - loans held-in-portfolio |
|
$ |
711,068 |
|
|
$ |
700,200 |
|
|
$ |
703,096 |
|
| Provision for credit losses (benefit) |
|
|
75,218 |
|
|
|
43,514 |
|
|
|
48,332 |
|
| Initial allowance for credit losses - PCD Loans |
|
|
2 |
|
|
|
9 |
|
|
|
74 |
|
|
|
|
|
|
|
|
|
|
|
|
|
|
|
|
|
786,288 |
|
|
|
743,723 |
|
|
|
751,502 |
|
|
|
|
|
|
|
|
|
|
|
|
|
|
| Net loans charge-off (recovered)- BPPR |
|
|
|
|
|
|
|
|
|
|
|
|
| Commercial: |
|
|
|
|
|
|
|
|
|
|
|
|
| Commercial multi-family |
|
|
— |
|
|
|
— |
|
|
|
— |
|
| Commercial real estate non-owner occupied |
|
|
(426 |
) |
|
|
(168 |
) |
|
|
(305 |
) |
| Commercial real estate owner occupied |
|
|
2,770 |
|
|
|
166 |
|
|
|
(462 |
) |
| Commercial and industrial |
|
|
1,535 |
|
|
|
(10,547 |
) |
|
|
(1,333 |
) |
| Total Commercial |
|
|
3,879 |
|
|
|
(10,549 |
) |
|
|
(2,100 |
) |
| Construction |
|
|
(1 |
) |
|
|
2,611 |
|
|
|
— |
|
| Leasing |
|
|
3,677 |
|
|
|
1,442 |
|
|
|
2,221 |
|
| Mortgage |
|
|
(2,720 |
) |
|
|
(3,800 |
) |
|
|
(6,135 |
) |
| Consumer: |
|
|
|
|
|
|
|
|
|
|
|
|
| Credit cards |
|
|
10,811 |
|
|
|
8,631 |
|
|
|
5,433 |
|
| Home equity lines of credit |
|
|
(64 |
) |
|
|
(30 |
) |
|
|
(72 |
) |
| Personal |
|
|
20,405 |
|
|
|
17,303 |
|
|
|
9,268 |
|
| Auto |
|
|
15,582 |
|
|
|
9,691 |
|
|
|
10,978 |
|
| Other Consumer |
|
|
344 |
|
|
|
301 |
|
|
|
253 |
|
| Total Consumer |
|
|
47,078 |
|
|
|
35,896 |
|
|
|
25,860 |
|
|
|
|
|
|
|
|
|
|
|
|
|
|
| Total net charged-off (recovered) BPPR |
|
$ |
51,913 |
|
|
$ |
25,600 |
|
|
$ |
19,846 |
|
|
|
|
|
|
|
|
|
|
|
|
|
|
| Net loans charge-off (recovered) - Popular
U.S. |
|
|
|
|
|
|
|
|
|
|
|
|
| Commercial: |
|
|
|
|
|
|
|
|
|
|
|
|
| Commercial multi-family |
|
|
(1 |
) |
|
|
(1 |
) |
|
|
(1 |
) |
| Commercial real estate non-owner occupied |
|
|
128 |
|
|
|
(66 |
) |
|
|
8,668 |
|
| Commercial real estate owner occupied |
|
|
(22 |
) |
|
|
1,202 |
|
|
|
(111 |
) |
| Commercial and industrial |
|
|
(159 |
) |
|
|
899 |
|
|
|
(162 |
) |
| Total Commercial |
|
|
(54 |
) |
|
|
2,034 |
|
|
|
8,394 |
|
| Mortgage |
|
|
(25 |
) |
|
|
(62 |
) |
|
|
(32 |
) |
| Consumer: |
|
|
|
|
|
|
|
|
|
|
|
|
| Credit cards |
|
|
— |
|
|
|
— |
|
|
|
(3 |
) |
| Home equity lines of credit |
|
|
(214 |
) |
|
|
12 |
|
|
|
(156 |
) |
| Personal |
|
|
5,302 |
|
|
|
5,032 |
|
|
|
3,142 |
|
| Other Consumer |
|
|
25 |
|
|
|
39 |
|
|
|
9 |
|
| Total Consumer |
|
|
5,113 |
|
|
|
5,083 |
|
|
|
2,992 |
|
|
|
|
|
|
|
|
|
|
|
|
|
|
| Total net charged-off (recovered) Popular U.S. |
|
$ |
5,034 |
|
|
$ |
7,055 |
|
|
$ |
11,354 |
|
|
|
|
|
|
|
|
|
|
|
|
|
|
| Total loans charged-off (recovered) - Popular,
Inc. |
|
$ |
56,947 |
|
|
$ |
32,655 |
|
|
$ |
31,200 |
|
|
|
|
|
|
|
|
|
|
|
|
|
|
| Balance at end of period - loans
held-in-portfolio |
|
$ |
729,341 |
|
|
$ |
711,068 |
|
|
$ |
720,302 |
|
|
|
|
|
|
|
|
|
|
|
|
|
|
| Balance at beginning of period - unfunded commitments |
|
$ |
13,284 |
|
|
$ |
11,593 |
|
|
$ |
7,307 |
|
| Provision for credit losses (benefit) |
|
|
3,722 |
|
|
|
1,691 |
|
|
|
1,498 |
|
|
|
|
|
|
|
|
|
|
|
|
|
|
| Balance at end of period - unfunded commitments [1] |
|
$ |
17,006 |
|
|
$ |
13,284 |
|
|
$ |
8,805 |
|
|
|
|
|
|
|
|
|
|
|
|
|
|
| POPULAR, INC. |
|
|
|
|
|
|
|
|
|
|
|
|
| Annualized net charge-offs (recoveries) to average loans held-in-portfolio |
|
|
0.66 |
% |
|
|
0.39 |
% |
|
|
0.39 |
% |
| Provision for credit losses (benefit) - loan portfolios to net charge-offs |
|
|
132.08 |
% |
|
|
133.25 |
% |
|
|
154.91 |
% |
| BPPR |
|
|
|
|
|
|
|
|
|
|
|
|
| Annualized net charge-offs (recoveries) to average loans held-in-portfolio |
|
|
0.86 |
% |
|
|
0.44 |
% |
|
|
0.35 |
% |
| Provision for credit losses (benefit) - loan portfolios to net charge-offs |
|
|
129.51 |
% |
|
|
211.00 |
% |
|
|
223.64 |
% |
| Popular U.S. |
|
|
|
|
|
|
|
|
|
|
|
|
| Annualized net charge-offs (recoveries) to average loans held-in-portfolio |
|
|
0.19 |
% |
|
|
0.28 |
% |
|
|
0.49 |
% |
| Provision for credit losses (benefit) - loan portfolios to net charge-offs |
|
|
158.58 |
% |
|
|
(148.87 |
)% |
|
|
34.78 |
% |
| [1] |
Allowance for credit losses of unfunded commitments is presented as part of Other Liabilities in the
Consolidated Statements of Financial Condition. |
28
|
|
|
|
|
|
|
|
|
| (In thousands) |
|
Year
ended
31-Dec-23 |
|
|
Year
ended
31-Dec-22 |
|
| |
|
Total |
|
|
Total |
|
| Balance at beginning of period - loans held-in-portfolio |
|
$ |
720,302 |
|
|
$ |
695,366 |
|
| Impact of adopting
ASU-2022-02 |
|
|
(45,583 |
) |
|
|
— |
|
| Provision for credit losses (benefit) |
|
|
201,539 |
|
|
|
83,307 |
|
| Initial allowance for credit losses - PCD Loans |
|
|
89 |
|
|
|
915 |
|
|
|
|
|
|
|
|
|
|
|
|
|
876,347 |
|
|
|
779,588 |
|
|
|
|
|
|
|
|
|
|
| Net loans charge-off (recovered)- BPPR |
|
|
|
|
|
|
|
|
| Commercial: |
|
|
|
|
|
|
|
|
| Commercial multi-family |
|
|
(1 |
) |
|
|
— |
|
| Commercial real estate non-owner occupied |
|
|
(299 |
) |
|
|
(1,520 |
) |
| Commercial real estate owner occupied |
|
|
1,100 |
|
|
|
(6,622 |
) |
| Commercial and industrial |
|
|
(10,001 |
) |
|
|
(2,750 |
) |
| Total Commercial |
|
|
(9,201 |
) |
|
|
(10,892 |
) |
| Construction |
|
|
2,610 |
|
|
|
(811 |
) |
| Leasing |
|
|
7,039 |
|
|
|
3,792 |
|
| Mortgage |
|
|
(13,858 |
) |
|
|
(15,743 |
) |
| Consumer |
|
|
|
|
|
|
|
|
| Credit Cards |
|
|
32,231 |
|
|
|
17,411 |
|
| Home equity lines of credit |
|
|
(155 |
) |
|
|
(278 |
) |
| Personal |
|
|
62,394 |
|
|
|
28,932 |
|
| Auto |
|
|
34,968 |
|
|
|
25,606 |
|
| Other Consumer |
|
|
11,636 |
|
|
|
1,059 |
|
| Total Consumer |
|
|
141,074 |
|
|
|
72,730 |
|
|
|
|
|
|
|
|
|
|
| Total net charged-off (recovered) BPPR |
|
|
127,664 |
|
|
|
49,076 |
|
|
|
|
|
|
|
|
|
|
| Net loans charge-off (recovered) - Popular
U.S. |
|
|
|
|
|
|
|
|
| Commercial |
|
|
|
|
|
|
|
|
| Commercial multi-family |
|
|
(5 |
) |
|
|
(21 |
) |
| Commercial real estate non-owner occupied |
|
|
(1,856 |
) |
|
|
8,649 |
|
| Commercial real estate owner occupied |
|
|
1,312 |
|
|
|
(359 |
) |
| Commercial and industrial |
|
|
2,005 |
|
|
|
(876 |
) |
| Total Commercial |
|
|
1,456 |
|
|
|
7,393 |
|
| Construction |
|
|
— |
|
|
|
(1,132 |
) |
| Mortgage |
|
|
(210 |
) |
|
|
(12 |
) |
| Consumer |
|
|
|
|
|
|
|
|
| Credit Cards |
|
|
1 |
|
|
|
(13 |
) |
| Home equity lines of credit |
|
|
(494 |
) |
|
|
(2,444 |
) |
| Personal |
|
|
17,829 |
|
|
|
6,262 |
|
| Other Consumer |
|
|
159 |
|
|
|
156 |
|
| Total Consumer |
|
|
17,495 |
|
|
|
3,961 |
|
|
|
|
|
|
|
|
|
|
| Total net charged-off (recovered) Popular U.S. |
|
|
18,741 |
|
|
|
10,210 |
|
|
|
|
|
|
|
|
|
|
| Total loans charged-off - Popular, Inc. |
|
|
146,405 |
|
|
|
59,286 |
|
|
|
|
|
|
|
|
|
|
| Net write- downs [2] |
|
|
601 |
|
|
|
— |
|
|
|
|
|
|
|
|
|
|
| Balance at end of period - loans
held-in-portfolio |
|
$ |
729,341 |
|
|
$ |
720,302 |
|
|
|
|
|
|
|
|
|
|
| Balance at beginning of period - unfunded commitments |
|
$ |
8,805 |
|
|
$ |
7,897 |
|
| Provision for credit losses (benefit) |
|
|
8,201 |
|
|
|
908 |
|
|
|
|
|
|
|
|
|
|
| Balance at end of period - unfunded commitments [1] |
|
$ |
17,006 |
|
|
$ |
8,805 |
|
|
|
|
|
|
|
|
|
|
| POPULAR, INC. |
|
|
|
|
|
|
|
|
| Annualized net charge-offs (recoveries) to average loans held-in-portfolio |
|
|
0.44 |
% |
|
|
0.20 |
% |
| Provision for credit losses (benefit) - loan portfolios to net charge-offs |
|
|
137.66 |
% |
|
|
140.52 |
% |
| BPPR |
|
|
|
|
|
|
|
|
| Annualized net charge-offs (recoveries) to average loans held-in-portfolio |
|
|
0.55 |
% |
|
|
0.23 |
% |
| Provision for credit losses (benefit) - loan portfolios to net charge-offs |
|
|
152.61 |
% |
|
|
141.71 |
% |
| Popular U.S. |
|
|
|
|
|
|
|
|
| Annualized net charge-offs (recoveries) to average loans held-in-portfolio |
|
|
0.19 |
% |
|
|
0.12 |
% |
| Provision for credit losses (benefit) - loan portfolios to net charge-offs |
|
|
35.78 |
% |
|
|
134.80 |
% |
| [1] |
Allowance for credit losses of unfunded commitments is presented as part of Other Liabilities in the
Consolidated Statements of Financial Condition. |
| [2] |
Net write-downs are related to credit cards loans reclassified to held-for-sale during the quarter ended
June 30, 2023. |
29
Popular, Inc.
Financial Supplement to Fourth Quarter 2023 Earnings Release
Table O - Allowance for Credit Losses “ACL”- Loan Portfolios - Consolidated
(Unaudited)
|
|
|
|
|
|
|
|
|
|
|
|
|
| 31-Dec-23 |
|
| (In thousands) |
|
Total ACL |
|
|
Total loans
held-in-portfolio |
|
|
ACL to loans
held-in-portfolio |
|
| Commercial: |
|
|
|
|
|
|
|
|
|
|
|
|
| Commercial multi-family |
|
$ |
13,740 |
|
|
$ |
2,415,620 |
|
|
|
0.57 |
% |
| Commercial real estate - non-owner occupied |
|
|
65,453 |
|
|
|
5,087,421 |
|
|
|
1.29 |
% |
| Commercial real estate - owner occupied |
|
|
56,864 |
|
|
|
3,080,635 |
|
|
|
1.85 |
% |
| Commercial and industrial |
|
|
122,356 |
|
|
|
7,126,121 |
|
|
|
1.72 |
% |
|
|
|
|
|
|
|
|
|
|
|
|
|
| Total commercial |
|
$ |
258,413 |
|
|
$ |
17,709,797 |
|
|
|
1.46 |
% |
|
|
|
|
|
|
|
|
|
|
|
|
|
| Construction |
|
|
12,686 |
|
|
|
959,280 |
|
|
|
1.32 |
% |
| Mortgage |
|
|
83,214 |
|
|
|
7,695,917 |
|
|
|
1.08 |
% |
| Leasing |
|
|
9,708 |
|
|
|
1,731,809 |
|
|
|
0.56 |
% |
| Consumer: |
|
|
|
|
|
|
|
|
|
|
|
|
| Credit cards |
|
|
80,487 |
|
|
|
1,135,747 |
|
|
|
7.09 |
% |
| Home equity lines of credit |
|
|
1,978 |
|
|
|
65,953 |
|
|
|
3.00 |
% |
| Personal |
|
|
117,790 |
|
|
|
1,945,247 |
|
|
|
6.06 |
% |
| Auto |
|
|
157,931 |
|
|
|
3,660,780 |
|
|
|
4.31 |
% |
| Other consumer |
|
|
7,134 |
|
|
|
160,441 |
|
|
|
4.45 |
% |
|
|
|
|
|
|
|
|
|
|
|
|
|
| Total consumer |
|
$ |
365,320 |
|
|
$ |
6,968,168 |
|
|
|
5.24 |
% |
|
|
|
|
|
|
|
|
|
|
|
|
|
| Total |
|
$ |
729,341 |
|
|
$ |
35,064,971 |
|
|
|
2.08 |
% |
|
|
|
|
|
|
|
|
|
|
|
|
|
|
| 30-Sep-23 |
|
| (In thousands) |
|
Total ACL |
|
|
Total loans
held-in-portfolio |
|
|
ACL to loans
held-in-portfolio |
|
| Commercial: |
|
|
|
|
|
|
|
|
|
|
|
|
| Commercial multi-family |
|
$ |
15,223 |
|
|
$ |
2,328,433 |
|
|
|
0.65 |
% |
| Commercial real estate - non-owner occupied |
|
|
67,149 |
|
|
|
5,035,130 |
|
|
|
1.33 |
% |
| Commercial real estate - owner occupied |
|
|
48,109 |
|
|
|
3,044,905 |
|
|
|
1.58 |
% |
| Commercial and industrial |
|
|
103,585 |
|
|
|
6,527,082 |
|
|
|
1.59 |
% |
|
|
|
|
|
|
|
|
|
|
|
|
|
| Total commercial |
|
$ |
234,066 |
|
|
$ |
16,935,550 |
|
|
|
1.38 |
% |
|
|
|
|
|
|
|
|
|
|
|
|
|
| Construction |
|
|
10,971 |
|
|
|
922,112 |
|
|
|
1.19 |
% |
| Mortgage |
|
|
91,904 |
|
|
|
7,585,111 |
|
|
|
1.21 |
% |
| Leasing |
|
|
10,198 |
|
|
|
1,698,114 |
|
|
|
0.60 |
% |
| Consumer: |
|
|
|
|
|
|
|
|
|
|
|
|
| Credit cards |
|
|
72,550 |
|
|
|
1,077,428 |
|
|
|
6.73 |
% |
| Home equity lines of credit |
|
|
2,387 |
|
|
|
67,499 |
|
|
|
3.54 |
% |
| Personal |
|
|
126,116 |
|
|
|
1,952,168 |
|
|
|
6.46 |
% |
| Auto |
|
|
155,436 |
|
|
|
3,633,196 |
|
|
|
4.28 |
% |
| Other consumer |
|
|
7,440 |
|
|
|
158,135 |
|
|
|
4.70 |
% |
|
|
|
|
|
|
|
|
|
|
|
|
|
| Total consumer |
|
$ |
363,929 |
|
|
$ |
6,888,426 |
|
|
|
5.28 |
% |
|
|
|
|
|
|
|
|
|
|
|
|
|
| Total |
|
$ |
711,068 |
|
|
$ |
34,029,313 |
|
|
|
2.09 |
% |
|
|
|
|
|
|
|
|
|
|
|
|
|
30
|
|
|
|
|
|
|
|
|
|
|
|
|
| Variance |
|
| (In thousands) |
|
Total ACL |
|
|
Total loans
held-in-portfolio |
|
|
ACL to loans
held-in-portfolio |
|
| Commercial: |
|
|
|
|
|
|
|
|
|
|
|
|
| Commercial multi-family |
|
$ |
(1,483 |
) |
|
$ |
87,187 |
|
|
|
(0.08 |
)% |
| Commercial real estate - non-owner occupied |
|
|
(1,696 |
) |
|
|
52,291 |
|
|
|
(0.04 |
)% |
| Commercial real estate - owner occupied |
|
|
8,755 |
|
|
|
35,730 |
|
|
|
0.27 |
% |
| Commercial and industrial |
|
|
18,771 |
|
|
|
599,039 |
|
|
|
0.13 |
% |
|
|
|
|
|
|
|
|
|
|
|
|
|
| Total commercial |
|
$ |
24,347 |
|
|
$ |
774,247 |
|
|
|
0.08 |
% |
|
|
|
|
|
|
|
|
|
|
|
|
|
| Construction |
|
|
1,715 |
|
|
|
37,168 |
|
|
|
0.13 |
% |
| Mortgage |
|
|
(8,690 |
) |
|
|
110,806 |
|
|
|
(0.13 |
)% |
| Leasing |
|
|
(490 |
) |
|
|
33,695 |
|
|
|
(0.04 |
)% |
| Consumer: |
|
|
|
|
|
|
|
|
|
|
|
|
| Credit cards |
|
|
7,937 |
|
|
|
58,319 |
|
|
|
0.36 |
% |
| Home equity lines of credit |
|
|
(409 |
) |
|
|
(1,546 |
) |
|
|
(0.54 |
)% |
| Personal |
|
|
(8,326 |
) |
|
|
(6,921 |
) |
|
|
(0.40 |
)% |
| Auto |
|
|
2,495 |
|
|
|
27,584 |
|
|
|
0.03 |
% |
| Other consumer |
|
|
(306 |
) |
|
|
2,306 |
|
|
|
(0.25 |
)% |
|
|
|
|
|
|
|
|
|
|
|
|
|
| Total consumer |
|
$ |
1,391 |
|
|
$ |
79,742 |
|
|
|
(0.04 |
)% |
|
|
|
|
|
|
|
|
|
|
|
|
|
| Total |
|
$ |
18,273 |
|
|
$ |
1,035,658 |
|
|
|
(0.01 |
)% |
|
|
|
|
|
|
|
|
|
|
|
|
|
31
Popular, Inc.
Financial Supplement to Fourth Quarter 2023 Earnings Release
Table P - Allowance for Credit Losses “ACL”- Loan Portfolios - BPPR Operations
(Unaudited)
|
|
|
|
|
|
|
|
|
|
|
|
|
| 31-Dec-23 |
|
| BPPR |
|
| (In thousands) |
|
Total ACL |
|
|
Total loans
held-in-portfolio |
|
|
ACL to loans
held-in-portfolio |
|
| Commercial: |
|
|
|
|
|
|
|
|
|
|
|
|
| Commercial multi-family |
|
$ |
3,614 |
|
|
$ |
291,942 |
|
|
|
1.24 |
% |
| Commercial real estate - non-owner occupied |
|
|
53,754 |
|
|
|
3,005,254 |
|
|
|
1.79 |
% |
| Commercial real estate - owner occupied |
|
|
40,637 |
|
|
|
1,398,383 |
|
|
|
2.91 |
% |
| Commercial and industrial |
|
|
107,577 |
|
|
|
4,796,226 |
|
|
|
2.24 |
% |
|
|
|
|
|
|
|
|
|
|
|
|
|
| Total commercial |
|
$ |
205,582 |
|
|
$ |
9,491,805 |
|
|
|
2.17 |
% |
|
|
|
|
|
|
|
|
|
|
|
|
|
| Construction |
|
|
5,294 |
|
|
|
169,857 |
|
|
|
3.12 |
% |
| Mortgage |
|
|
72,440 |
|
|
|
6,391,824 |
|
|
|
1.13 |
% |
| Leasing |
|
|
9,708 |
|
|
|
1,731,809 |
|
|
|
0.56 |
% |
| Consumer: |
|
|
|
|
|
|
|
|
|
|
|
|
| Credit cards |
|
|
80,487 |
|
|
|
1,135,728 |
|
|
|
7.09 |
% |
| Home equity lines of credit |
|
|
103 |
|
|
|
2,648 |
|
|
|
3.89 |
% |
| Personal |
|
|
101,181 |
|
|
|
1,776,310 |
|
|
|
5.70 |
% |
| Auto |
|
|
157,931 |
|
|
|
3,660,780 |
|
|
|
4.31 |
% |
| Other consumer |
|
|
7,132 |
|
|
|
150,162 |
|
|
|
4.75 |
% |
|
|
|
|
|
|
|
|
|
|
|
|
|
| Total consumer |
|
$ |
346,834 |
|
|
$ |
6,725,628 |
|
|
|
5.16 |
% |
|
|
|
|
|
|
|
|
|
|
|
|
|
| Total |
|
$ |
639,858 |
|
|
$ |
24,510,923 |
|
|
|
2.61 |
% |
|
|
|
|
|
|
|
|
|
|
|
|
|
|
| 30-Sep-23 |
|
| BPPR |
|
| (In thousands) |
|
Total ACL |
|
|
Total loans
held-in-portfolio |
|
|
ACL to loans
held-in-portfolio |
|
| Commercial: |
|
|
|
|
|
|
|
|
|
|
|
|
| Commercial multi-family |
|
$ |
3,481 |
|
|
$ |
294,814 |
|
|
|
1.18 |
% |
| Commercial real estate - non-owner occupied |
|
|
53,208 |
|
|
|
2,948,881 |
|
|
|
1.80 |
% |
| Commercial real estate - owner occupied |
|
|
41,493 |
|
|
|
1,407,553 |
|
|
|
2.95 |
% |
| Commercial and industrial |
|
|
87,579 |
|
|
|
4,329,818 |
|
|
|
2.02 |
% |
|
|
|
|
|
|
|
|
|
|
|
|
|
| Total commercial |
|
$ |
185,761 |
|
|
$ |
8,981,066 |
|
|
|
2.07 |
% |
|
|
|
|
|
|
|
|
|
|
|
|
|
| Construction |
|
|
5,457 |
|
|
|
170,507 |
|
|
|
3.20 |
% |
| Mortgage |
|
|
79,900 |
|
|
|
6,289,268 |
|
|
|
1.27 |
% |
| Leasing |
|
|
10,198 |
|
|
|
1,698,114 |
|
|
|
0.60 |
% |
| Consumer: |
|
|
|
|
|
|
|
|
|
|
|
|
| Credit cards |
|
|
72,550 |
|
|
|
1,077,411 |
|
|
|
6.73 |
% |
| Home equity lines of credit |
|
|
87 |
|
|
|
2,474 |
|
|
|
3.52 |
% |
| Personal |
|
|
107,707 |
|
|
|
1,763,002 |
|
|
|
6.11 |
% |
| Auto |
|
|
155,436 |
|
|
|
3,633,196 |
|
|
|
4.28 |
% |
| Other consumer |
|
|
7,438 |
|
|
|
147,532 |
|
|
|
5.04 |
% |
|
|
|
|
|
|
|
|
|
|
|
|
|
| Total consumer |
|
$ |
343,218 |
|
|
$ |
6,623,615 |
|
|
|
5.18 |
% |
|
|
|
|
|
|
|
|
|
|
|
|
|
| Total |
|
$ |
624,534 |
|
|
$ |
23,762,570 |
|
|
|
2.63 |
% |
|
|
|
|
|
|
|
|
|
|
|
|
|
32
|
|
|
|
|
|
|
|
|
|
|
|
|
| Variance |
|
| (In thousands) |
|
Total ACL |
|
|
Total loans
held-in-portfolio |
|
|
ACL to loans
held-in-portfolio |
|
| Commercial: |
|
|
|
|
|
|
|
|
|
|
|
|
| Commercial multi-family |
|
|
133 |
|
|
|
(2,872 |
) |
|
|
0.06 |
% |
| Commercial real estate - non-owner occupied |
|
|
546 |
|
|
|
56,373 |
|
|
|
(0.01 |
)% |
| Commercial real estate - owner occupied |
|
|
(856 |
) |
|
|
(9,170 |
) |
|
|
(0.04 |
)% |
| Commercial and industrial |
|
|
19,998 |
|
|
|
466,408 |
|
|
|
0.22 |
% |
|
|
|
|
|
|
|
|
|
|
|
|
|
| Total commercial |
|
$ |
19,821 |
|
|
$ |
510,739 |
|
|
|
0.10 |
% |
|
|
|
|
|
|
|
|
|
|
|
|
|
| Construction |
|
|
(163 |
) |
|
|
(650 |
) |
|
|
(0.08 |
)% |
| Mortgage |
|
|
(7,460 |
) |
|
|
102,556 |
|
|
|
(0.14 |
)% |
| Leasing |
|
|
(490 |
) |
|
|
33,695 |
|
|
|
(0.04 |
)% |
| Consumer: |
|
|
|
|
|
|
|
|
|
|
|
|
| Credit cards |
|
|
7,937 |
|
|
|
58,317 |
|
|
|
0.36 |
% |
| Home equity lines of credit |
|
|
16 |
|
|
|
174 |
|
|
|
0.37 |
% |
| Personal |
|
|
(6,526 |
) |
|
|
13,308 |
|
|
|
(0.41 |
)% |
| Auto |
|
|
2,495 |
|
|
|
27,584 |
|
|
|
0.03 |
% |
| Other consumer |
|
|
(306 |
) |
|
|
2,630 |
|
|
|
(0.29 |
)% |
|
|
|
|
|
|
|
|
|
|
|
|
|
| Total consumer |
|
$ |
3,616 |
|
|
$ |
102,013 |
|
|
|
(0.02 |
)% |
|
|
|
|
|
|
|
|
|
|
|
|
|
| Total |
|
$ |
15,324 |
|
|
$ |
748,353 |
|
|
|
(0.02 |
)% |
|
|
|
|
|
|
|
|
|
|
|
|
|
33
Popular, Inc.
Financial Supplement to Fourth Quarter 2023 Earnings Release
Table Q - Allowance for Credit Losses “ACL”- Loan Portfolios - POPULAR U.S. Operations
(Unaudited)
|
|
|
|
|
|
|
|
|
|
|
|
|
| 31-Dec-23 |
|
| Popular U.S. |
|
| (In thousands) |
|
Total ACL |
|
|
Total loans
held-in-portfolio |
|
|
ACL to loans
held-in-portfolio |
|
| Commercial: |
|
|
|
|
|
|
|
|
|
|
|
|
| Commercial multi-family |
|
$ |
10,126 |
|
|
$ |
2,123,678 |
|
|
|
0.48 |
% |
| Commercial real estate - non-owner occupied |
|
|
11,699 |
|
|
|
2,082,167 |
|
|
|
0.56 |
% |
| Commercial real estate - owner occupied |
|
|
16,227 |
|
|
|
1,682,252 |
|
|
|
0.96 |
% |
| Commercial and industrial |
|
|
14,779 |
|
|
|
2,329,895 |
|
|
|
0.63 |
% |
|
|
|
|
|
|
|
|
|
|
|
|
|
| Total commercial |
|
$ |
52,831 |
|
|
$ |
8,217,992 |
|
|
|
0.64 |
% |
|
|
|
|
|
|
|
|
|
|
|
|
|
| Construction |
|
|
7,392 |
|
|
|
789,423 |
|
|
|
0.94 |
% |
| Mortgage |
|
|
10,774 |
|
|
|
1,304,093 |
|
|
|
0.83 |
% |
| Consumer: |
|
|
|
|
|
|
|
|
|
|
|
|
| Credit cards |
|
|
— |
|
|
|
19 |
|
|
|
— |
% |
| Home equity lines of credit |
|
|
1,875 |
|
|
|
63,305 |
|
|
|
2.96 |
% |
| Personal |
|
|
16,609 |
|
|
|
168,937 |
|
|
|
9.83 |
% |
| Other consumer |
|
|
2 |
|
|
|
10,279 |
|
|
|
0.02 |
% |
|
|
|
|
|
|
|
|
|
|
|
|
|
| Total consumer |
|
$ |
18,486 |
|
|
$ |
242,540 |
|
|
|
7.62 |
% |
|
|
|
|
|
|
|
|
|
|
|
|
|
| Total |
|
$ |
89,483 |
|
|
$ |
10,554,048 |
|
|
|
0.85 |
% |
|
|
|
|
|
|
|
|
|
|
|
|
|
|
| 30-Sep-23 |
|
| Popular U.S. |
|
| (In thousands) |
|
Total ACL |
|
|
Total loans
held-in-portfolio |
|
|
ACL to loans
held-in-portfolio |
|
| Commercial: |
|
|
|
|
|
|
|
|
|
|
|
|
| Commercial multi-family |
|
$ |
11,742 |
|
|
$ |
2,033,619 |
|
|
|
0.58 |
% |
| Commercial real estate - non-owner occupied |
|
|
13,941 |
|
|
|
2,086,249 |
|
|
|
0.67 |
% |
| Commercial real estate - owner occupied |
|
|
6,616 |
|
|
|
1,637,352 |
|
|
|
0.40 |
% |
| Commercial and industrial |
|
|
16,006 |
|
|
|
2,197,264 |
|
|
|
0.73 |
% |
|
|
|
|
|
|
|
|
|
|
|
|
|
| Total commercial |
|
$ |
48,305 |
|
|
$ |
7,954,484 |
|
|
|
0.61 |
% |
|
|
|
|
|
|
|
|
|
|
|
|
|
| Construction |
|
|
5,514 |
|
|
|
751,605 |
|
|
|
0.73 |
% |
| Mortgage |
|
|
12,004 |
|
|
|
1,295,843 |
|
|
|
0.93 |
% |
| Consumer: |
|
|
|
|
|
|
|
|
|
|
|
|
| Credit cards |
|
|
— |
|
|
|
17 |
|
|
|
— |
% |
| Home equity lines of credit |
|
|
2,300 |
|
|
|
65,025 |
|
|
|
3.54 |
% |
| Personal |
|
|
18,409 |
|
|
|
189,166 |
|
|
|
9.73 |
% |
| Other consumer |
|
|
2 |
|
|
|
10,603 |
|
|
|
0.02 |
% |
|
|
|
|
|
|
|
|
|
|
|
|
|
| Total consumer |
|
$ |
20,711 |
|
|
$ |
264,811 |
|
|
|
7.82 |
% |
|
|
|
|
|
|
|
|
|
|
|
|
|
| Total |
|
$ |
86,534 |
|
|
$ |
10,266,743 |
|
|
|
0.84 |
% |
|
|
|
|
|
|
|
|
|
|
|
|
|
34
|
|
|
|
|
|
|
|
|
|
|
|
|
| Variance |
|
| (In thousands) |
|
Total ACL |
|
|
Total loans
held-in-portfolio |
|
|
ACL to loans
held-in-portfolio |
|
| Commercial: |
|
|
|
|
|
|
|
|
|
|
|
|
| Commercial multi-family |
|
$ |
(1,616 |
) |
|
$ |
90,059 |
|
|
|
(0.10 |
)% |
| Commercial real estate - non-owner occupied |
|
|
(2,242 |
) |
|
|
(4,082 |
) |
|
|
(0.11 |
)% |
| Commercial real estate - owner occupied |
|
|
9,611 |
|
|
|
44,900 |
|
|
|
0.56 |
% |
| Commercial and industrial |
|
|
(1,227 |
) |
|
|
132,631 |
|
|
|
(0.10 |
)% |
|
|
|
|
|
|
|
|
|
|
|
|
|
| Total commercial |
|
$ |
4,526 |
|
|
$ |
263,508 |
|
|
|
0.03 |
% |
|
|
|
|
|
|
|
|
|
|
|
|
|
| Construction |
|
|
1,878 |
|
|
|
37,818 |
|
|
|
0.21 |
% |
| Mortgage |
|
|
(1,230 |
) |
|
|
8,250 |
|
|
|
(0.10 |
)% |
| Consumer: |
|
|
|
|
|
|
|
|
|
|
|
|
| Credit cards |
|
|
— |
|
|
|
2 |
|
|
|
— |
% |
| Home equity lines of credit |
|
|
(425 |
) |
|
|
(1,720 |
) |
|
|
(0.58 |
)% |
| Personal |
|
|
(1,800 |
) |
|
|
(20,229 |
) |
|
|
0.10 |
% |
| Other consumer |
|
|
— |
|
|
|
(324 |
) |
|
|
— |
% |
|
|
|
|
|
|
|
|
|
|
|
|
|
| Total consumer |
|
$ |
(2,225 |
) |
|
$ |
(22,271 |
) |
|
|
(0.20 |
)% |
|
|
|
|
|
|
|
|
|
|
|
|
|
| Total |
|
$ |
2,949 |
|
|
$ |
287,305 |
|
|
|
0.01 |
% |
|
|
|
|
|
|
|
|
|
|
|
|
|
35
Popular, Inc.
Financial Supplement to Fourth Quarter 2023 Earnings Release
Table R - Reconciliation to GAAP Financial Measures
(Unaudited)
|
|
|
|
|
|
|
|
|
|
|
|
|
| (In thousands, except share or per share information) |
|
31-Dec-23 |
|
|
30-Sep-23 |
|
|
31-Dec-22 |
|
| Total stockholders’ equity |
|
$ |
5,146,953 |
|
|
$ |
4,457,608 |
|
|
$ |
4,093,425 |
|
| Less: Preferred stock |
|
|
(22,143 |
) |
|
|
(22,143 |
) |
|
|
(22,143 |
) |
| Less: Goodwill |
|
|
(804,428 |
) |
|
|
(804,428 |
) |
|
|
(827,428 |
) |
| Less: Other intangibles |
|
|
(9,764 |
) |
|
|
(10,559 |
) |
|
|
(12,944 |
) |
|
|
|
|
|
|
|
|
|
|
|
|
|
| Total tangible common equity |
|
$ |
4,310,618 |
|
|
$ |
3,620,478 |
|
|
$ |
3,230,910 |
|
|
|
|
|
|
|
|
|
|
|
|
|
|
| Total assets |
|
$ |
70,758,155 |
|
|
$ |
69,736,936 |
|
|
$ |
67,637,917 |
|
| Less: Goodwill |
|
|
(804,428 |
) |
|
|
(804,428 |
) |
|
|
(827,428 |
) |
| Less: Other intangibles |
|
|
(9,764 |
) |
|
|
(10,559 |
) |
|
|
(12,944 |
) |
|
|
|
|
|
|
|
|
|
|
|
|
|
| Total tangible assets |
|
$ |
69,943,963 |
|
|
$ |
68,921,949 |
|
|
$ |
66,797,545 |
|
|
|
|
|
|
|
|
|
|
|
|
|
|
| Tangible common equity to tangible assets |
|
|
6.16 |
% |
|
|
5.25 |
% |
|
|
4.84 |
% |
| Common shares outstanding at end of period |
|
|
72,153,621 |
|
|
|
72,127,595 |
|
|
|
71,853,720 |
|
| Tangible book value per common share |
|
$ |
59.74 |
|
|
$ |
50.20 |
|
|
$ |
44.97 |
|
|
|
| |
|
Quarterly average |
|
| Total stockholders’ equity [1] |
|
$ |
6,755,948 |
|
|
$ |
6,636,364 |
|
|
$ |
6,161,634 |
|
| Less: Preferred Stock |
|
|
(22,143 |
) |
|
|
(22,143 |
) |
|
|
(22,143 |
) |
| Less: Goodwill |
|
|
(804,427 |
) |
|
|
(827,177 |
) |
|
|
(827,427 |
) |
| Less: Other intangibles |
|
|
(10,286 |
) |
|
|
(11,083 |
) |
|
|
(13,440 |
) |
|
|
|
|
|
|
|
|
|
|
|
|
|
| Total tangible equity |
|
$ |
5,919,092 |
|
|
$ |
5,775,961 |
|
|
$ |
5,298,624 |
|
| Return on average tangible common equity |
|
|
6.32 |
% |
|
|
9.36 |
% |
|
|
19.23 |
% |
|
|
|
|
|
|
|
|
|
|
|
|
|
| [1] |
Average balances exclude unrealized gains or losses on debt securities available-for-sale and the unrealized loss related to certain securities transferred from available-for-sale to held-to-maturity. |
|
|
|
|
|
|
|
|
|
| |
|
Year-to-date average |
|
| Total stockholders’ equity [1] |
|
$ |
6,600,603 |
|
|
$ |
6,009,225 |
|
| Less: Preferred Stock |
|
|
(22,143 |
) |
|
|
(22,143 |
) |
| Less: Goodwill |
|
|
(821,567 |
) |
|
|
(757,133 |
) |
| Less: Other intangibles |
|
|
(11,473 |
) |
|
|
(17,113 |
) |
|
|
|
|
|
|
|
|
|
| Total tangible equity |
|
$ |
5,745,420 |
|
|
$ |
5,212,836 |
|
| Return on average tangible common equity |
|
|
9.40 |
% |
|
|
21.13 |
% |
|
|
|
|
|
|
|
|
|
| [1] |
Average balances exclude unrealized gains or losses on debt securities available-for-sale and the unrealized loss related to certain securities transferred from available-for-sale to held-to-maturity. |
36
CONTACTS:
Popular, Inc.
Investor Relations:
Paul J. Cardillo, 212-417-6721
Senior Vice President and Investor Relations Officer
pcardillo@popular.com
or
Media Relations:
MC González Noguera, 917-804-5253
Executive Vice President and Chief Communications & Public
Affairs Officer
mc.gonzalez@popular.com
37

Exhibit 99.2
Cautionary Note Regarding Forward-Looking Statements This presentation
contains “forward-looking statements” within the meaning of the U.S. Private Securities Litigation Reform Act of 1995, including without limitation those regarding Popular’s business, financial condition, results of operations and
future plans, objectives, performance, earnings and expenses. These statements are not guarantees of future performance, are based on the current expectations of Popular, Inc.’s (the “Corporation”) management and, by their nature,
involve risks, uncertainties, estimates and assumptions. Potential factors, some of which are beyond the Corporation’s control, could cause actual results to differ materially from those expressed in, or implied by, such forward-looking
statements. More information on the risks and important factors that could affect the Corporation’s future results and financial condition is included in our Form 10-K for the year ended December 31, 2022, our Quarterly Reports on Form 10-Q
for the quarters ended March 31, 2023, June 30, 2023 and September 30, 2023, in our earnings release for the quarter ended December 31, 2023, and in our Annual Report on form 10-K for the year ended December 31, 2023 to be filed with the Securities
and Exchange Commission. Our filings are available on the Corporation’s website (www.popular.com) and on the Securities and Exchange Commission website (www.sec.gov). The Corporation assumes no obligation to update or revise any
forward-looking statements which speak as of their respective dates.
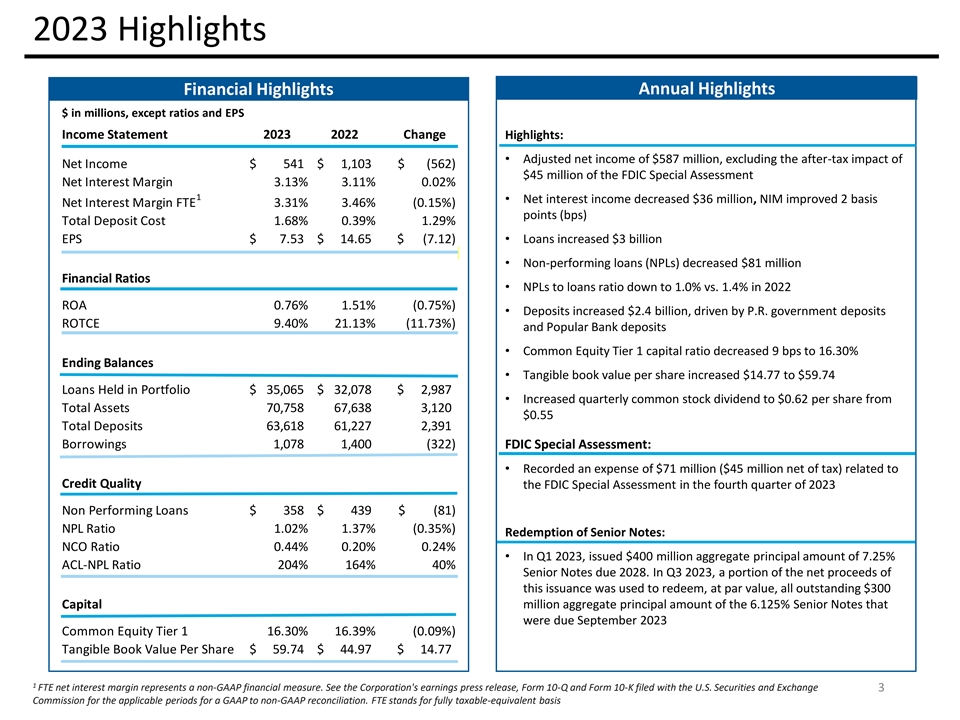
2023 Highlights Financial Highlights Annual Highlights $ in millions,
except ratios and EPS Income Statement 2023 2022 Change Highlights: • Adjusted net income of $587 million, excluding the after-tax impact of Net Income $ 541 $ 1,103 $ ( 562) $45 million of the FDIC Special Assessment Net Interest Margin 3.13%
3.11% 0.02% 1 • Net interest income decreased $36 million, NIM improved 2 basis Net Interest Margin FTE 3.31% 3.46% (0.15%) points (bps) Total Deposit Cost 1.68% 0.39% 1.29% • Loans increased $3 billion EPS $ 7.53 $ 14.65 $ ( 7.12)
• Non-performing loans (NPLs) decreased $81 million Financial Ratios • NPLs to loans ratio down to 1.0% vs. 1.4% in 2022 ROA 0.76% 1.51% (0.75%) • Deposits increased $2.4 billion, driven by P.R. government deposits ROTCE 9.40%
21.13% (11.73%) and Popular Bank deposits • Common Equity Tier 1 capital ratio decreased 9 bps to 16.30% Ending Balances • Tangible book value per share increased $14.77 to $59.74 Loans Held in Portfolio $ 35,065 $ 32,078 $ 2,987 •
Increased quarterly common stock dividend to $0.62 per share from Total Assets 70,758 67,638 3,120 $0.55 Total Deposits 63,618 61,227 2,391 Borrowings 1,078 1,400 (322) FDIC Special Assessment: • Recorded an expense of $71 million ($45 million
net of tax) related to Credit Quality the FDIC Special Assessment in the fourth quarter of 2023 Non Performing Loans $ 358 $ 439 $ ( 81) NPL Ratio 1.02% 1.37% (0.35%) Redemption of Senior Notes: NCO Ratio 0.44% 0.20% 0.24% • In Q1 2023, issued
$400 million aggregate principal amount of 7.25% ACL-NPL Ratio 204% 164% 40% Senior Notes due 2028. In Q3 2023, a portion of the net proceeds of this issuance was used to redeem, at par value, all outstanding $300 Capital million aggregate principal
amount of the 6.125% Senior Notes that were due September 2023 Common Equity Tier 1 16.30% 16.39% (0.09%) Tangible Book Value Per Share $ 59.74 $ 44.97 $ 14.77 1 FTE net interest margin represents a non-GAAP financial measure. See the Corporation's
earnings press release, Form 10-Q and Form 10-K filed with the U.S. Securities and Exchange 3 Commission for the applicable periods for a GAAP to non-GAAP reconciliation. FTE stands for fully taxable-equivalent basis
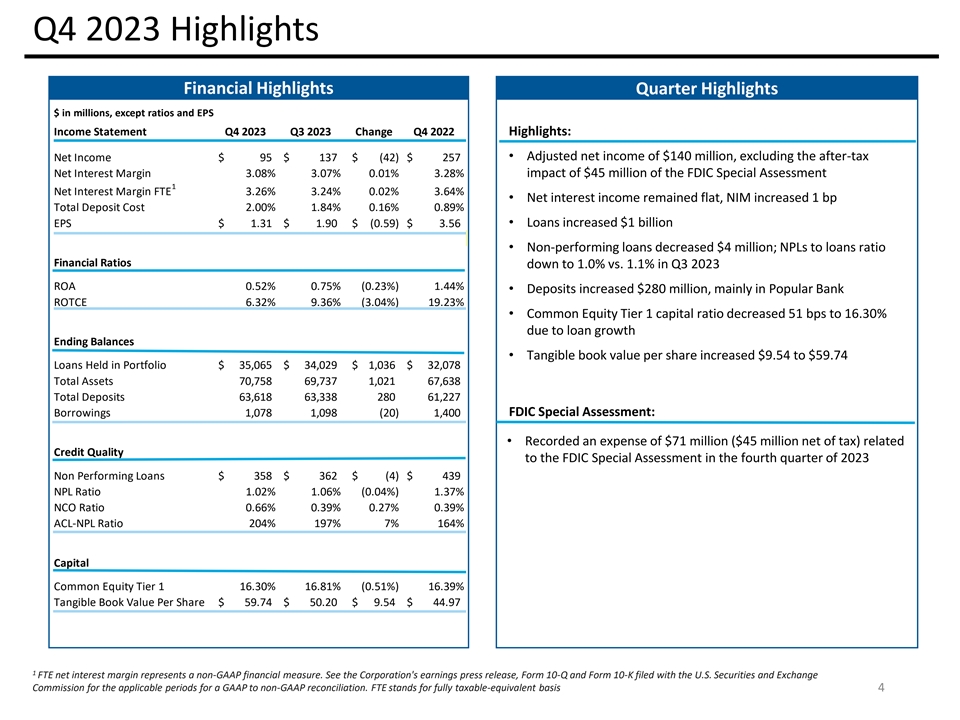
Q4 2023 Highlights Financial Highlights Quarter Highlights $ in
millions, except ratios and EPS Income Statement Q4 2023 Q3 2023 Change Q4 2022 Highlights: • Adjusted net income of $140 million, excluding the after-tax Net Income $ 95 $ 137 $ (42) $ 257 Net Interest Margin 3.08% 3.07% 0.01% 3.28% impact of
$45 million of the FDIC Special Assessment 1 Net Interest Margin FTE 3.26% 3.24% 0.02% 3.64% • Net interest income remained flat, NIM increased 1 bp Total Deposit Cost 2.00% 1.84% 0.16% 0.89% EPS $ 1.31 $ 1.90 $ (0.59) $ 3.56• Loans
increased $1 billion • Non-performing loans decreased $4 million; NPLs to loans ratio Financial Ratios down to 1.0% vs. 1.1% in Q3 2023 ROA 0.52% 0.75% (0.23%) 1.44% • Deposits increased $280 million, mainly in Popular Bank ROTCE 6.32%
9.36% (3.04%) 19.23% • Common Equity Tier 1 capital ratio decreased 51 bps to 16.30% due to loan growth Ending Balances • Tangible book value per share increased $9.54 to $59.74 Loans Held in Portfolio $ 35,065 $ 34,029 $ 1,036 $ 32,078
Total Assets 70,758 69,737 1 ,021 67,638 Total Deposits 63,618 63,338 280 61,227 FDIC Special Assessment: Borrowings 1,078 1,098 ( 20) 1,400 • Recorded an expense of $71 million ($45 million net of tax) related Credit Quality to the FDIC
Special Assessment in the fourth quarter of 2023 Non Performing Loans $ 358 $ 362 $ ( 4) $ 439 NPL Ratio 1.02% 1.06% (0.04%) 1.37% NCO Ratio 0.66% 0.39% 0.27% 0.39% ACL-NPL Ratio 204% 197% 7% 164% Capital Common Equity Tier 1 16.30% 16.81% (0.51%)
16.39% Tangible Book Value Per Share $ 59.74 $ 50.20 $ 9.54 $ 44.97 1 FTE net interest margin represents a non-GAAP financial measure. See the Corporation's earnings press release, Form 10-Q and Form 10-K filed with the U.S. Securities and Exchange
Commission for the applicable periods for a GAAP to non-GAAP reconciliation. FTE stands for fully taxable-equivalent basis 4
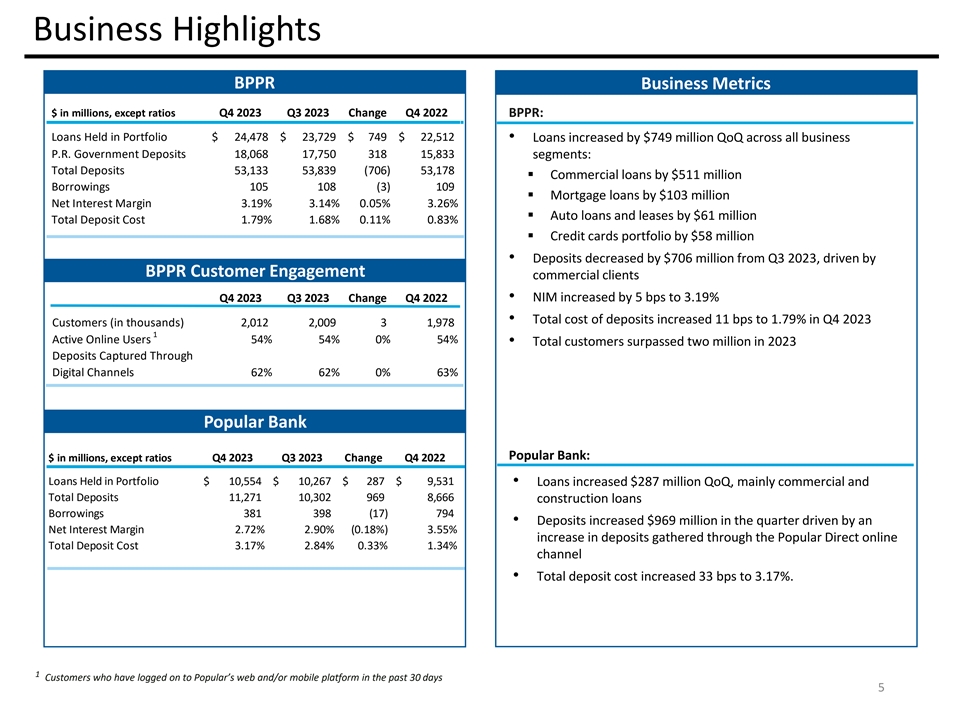
Business Highlights BPPR Business Metrics $ in millions, except ratios
Q4 2023 Q3 2023 Change Q4 2022 BPPR: Loans Held in Portfolio $ 24,478 $ 23,729 $ 749 $ 22,512 • Loans increased by $749 million QoQ across all business P.R. Government Deposits 18,068 17,750 318 15,833 segments: Total Deposits 53,133 53,839
(706) 53,178 ▪ Commercial loans by $511 million Borrowings 105 108 (3) 109 ▪ Mortgage loans by $103 million Net Interest Margin 3.19% 3.14% 0.05% 3.26% ▪ Auto loans and leases by $61 million Total Deposit Cost 1.79% 1.68% 0.11%
0.83% ▪ Credit cards portfolio by $58 million • Deposits decreased by $706 million from Q3 2023, driven by BPPR Customer Engagement commercial clients • NIM increased by 5 bps to 3.19% Q4 2023 Q3 2023 Change Q4 2022 • Total
cost of deposits increased 11 bps to 1.79% in Q4 2023 Customers (in thousands) 2,012 2 ,009 3 1 ,978 1 Active Online Users 54% 54% 0% 54% • Total customers surpassed two million in 2023 Deposits Captured Through Earnings Digital Channels 62%
62% 0% 63% Popular Bank Popular Bank: $ in millions, except ratios Q4 2023 Q3 2023 Change Q4 2022 Loans Held in Portfolio $ 10,554 $ 10,267 $ 287 $ 9,531 • Loans increased $287 million QoQ, mainly commercial and Total Deposits 11,271 10,302
969 8,666 construction loans Borrowings 381 398 ( 17) 794 • Deposits increased $969 million in the quarter driven by an Net Interest Margin 2.72% 2.90% (0.18%) 3.55% increase in deposits gathered through the Popular Direct online Total Deposit
Cost 3.17% 2.84% 0.33% 1.34% channel • Total deposit cost increased 33 bps to 3.17%. 1 Customers who have logged on to Popular’s web and/or mobile platform in the past 30 days 5
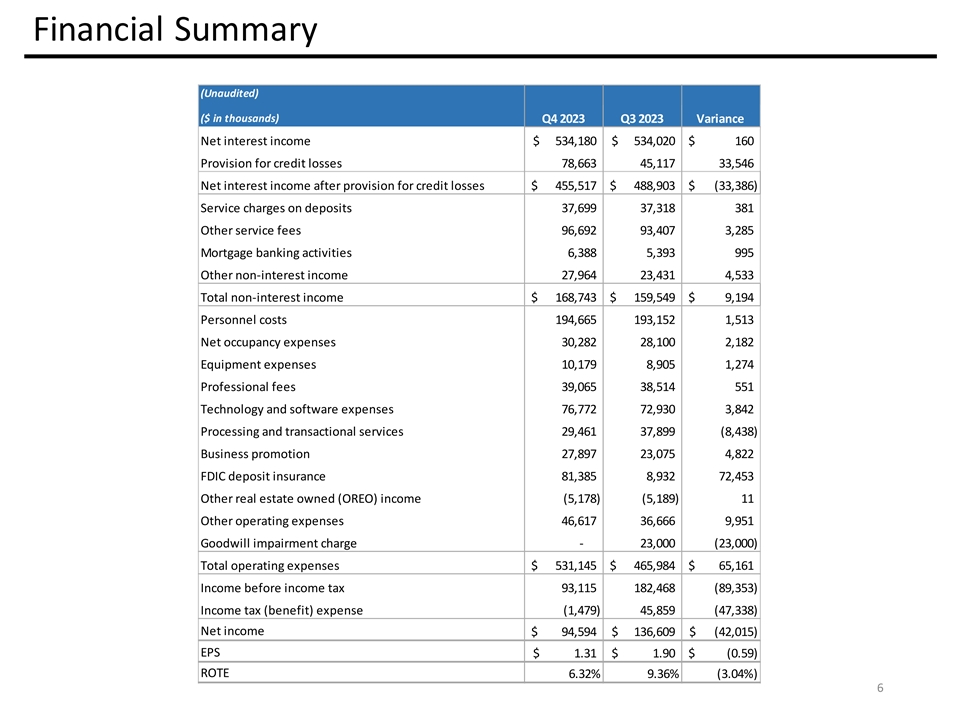
LMNOMPQR ! ## $#% &-&’()*+,-*’(),.,-, /%0$%1% 2#%$$
$3(+)’ ’&)**3’)&( ! ## $#% 1# 4%0$%1% 2#%$$ $(-(&&)&*3-6++)5,’-’’)’+7 0 89 $%2 4%$#$’’3)55’3)’*++* :#8 $ 0 1 $55)5. ’’)(,3).+& ;%#99 <=9#0#
$&)’++ 5)’5’5& :#8 %># $#% ..3)5((’)(’*)&’’ ?%#%># $#% -**+)3(’-5&5)&(5-)*5( / $% %$#$**5()&*5’)*&.)&*’ ! #%4 @4 $ $’.,).+..+)*,,)*+. AB4 # @4 $
$*+,)*35 *)5,&).3( /%1 $$%1 $’’5),&&+)&*(&* ? 8%%92$%1#C @4 $ $33)33.’.)5’,)+(. /% $$92#$#%$ 0 $.’5)(* 63)+55+)(’+7 D$ $$4% %#%..3)+53(’),3&)+.. EFG2 4%$#$ ++*)’+&
3)5’..)(&’ :#8 $## %C 26:HA:7% 66&)*3+7*&)*+57* :#8 %4 #9 @4 $ $(’)*35))5&* I%%2C 4 #89 >.6’),,,.’),,,7 ?%#%4 #9 @4 $ $&-(’*)*(&-&)5+(-&)** F% < 1% %
#@5*’)**&6+.)(++5)’&’7 F% #@6< 1#7 @4 $ 6(*)(3576&)+&5(3)’’+7 ! #% -5*()&5(-6’),5-(.),*&7 A/-**J’*-6J5,-,J&57 H:?A J’.K5J’K6’J,(K7
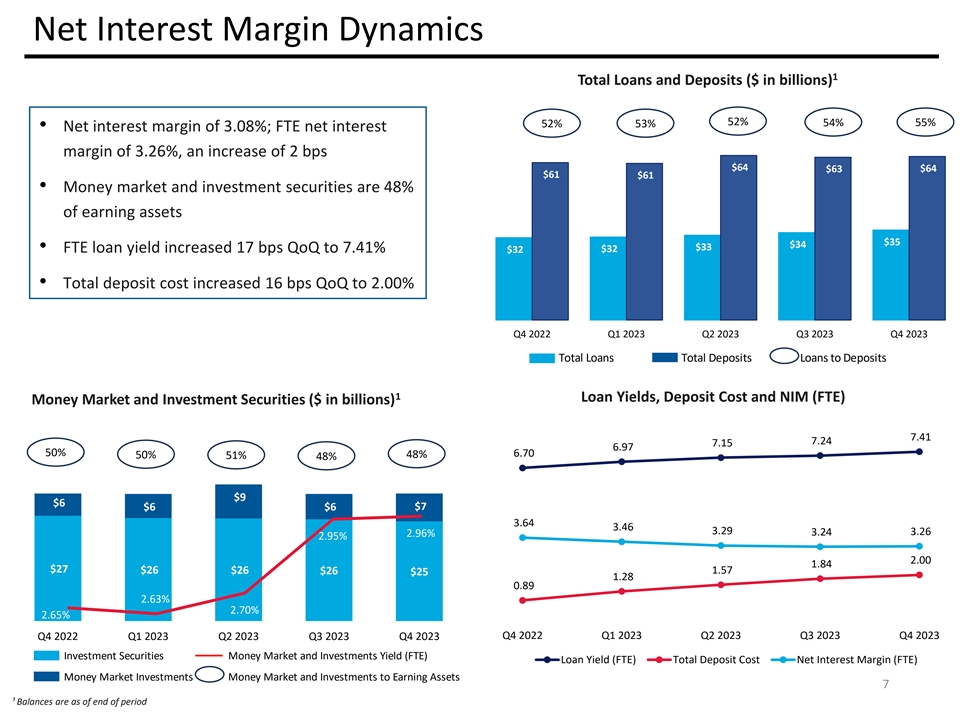
Net Interest Margin Dynamics 1 Total Loans and Deposits ($ in billions)
$80 52% 54% 55% 52% 53% • Net interest margin of 3.08%; FTE net interest $70 margin of 3.26%, an increase of 2 bps $60 $64 $63 $64 $61 $61 • Money market and investment securities are 48% $50 of earning assets $40 $35 $30 $34 $33 $32
• FTE loan yield increased 17 bps QoQ to 7.41% $32 $20 • Total deposit cost increased 16 bps QoQ to 2.00% $10 $- Q4 2022 Q1 2023 Q2 2023 Q3 2023 Q4 2023 Total Loans Total Deposits Loans to Deposits 1 Loan Yields, Deposit Cost and NIM
(FTE) Money Market and Investment Securities ($ in billions) 7.41 7.24 7.15 6.97 50% 6.70 50% 51% 48% 48% $9 $6 3% $6 $6 $7 3.64 3.46 3.29 3.24 3.26 2.96% 3% 2.95% 2.00 3% 1.84 $27 $26 1.57 $26 $26 $25 1.28 0.89 3% 2.63% 2.70% 2.65% 3% Q4 2022 Q1
2023 Q2 2023 Q3 2023 Q4 2023 Q4 2022 Q1 2023 Q2 2023 Q3 2023 Q4 2023 3% Investment Securities Money Market and Investments Yield (FTE) Loan Yield (FTE) Total Deposit Cost Net Interest Margin (FTE) Money Market Investments Money Market and
Investments to Earning Assets 2% 7 ¹ Balances are as of end of period
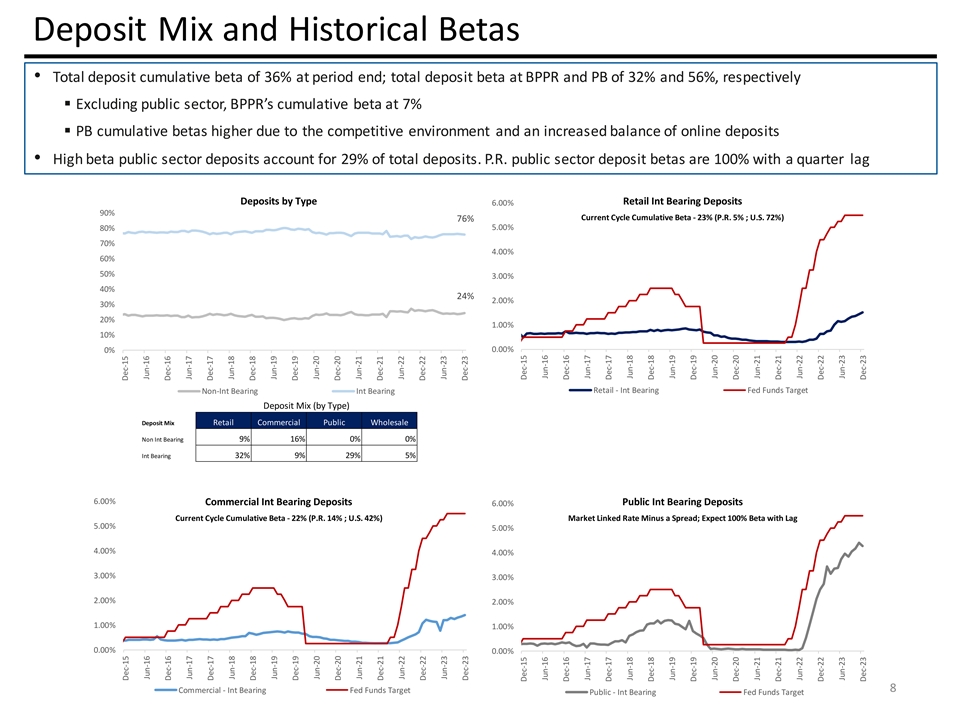
! # $%&’()*+,-.)/(+’01’2345677890’)
:)(;2+<1/12;;2=> $?@?? @? ABBBCDDE?F@ HIJKLMNLOPQPJIRBDDINSMTUVNWISXMVYHIJKLMNL AD Z[XXIVNZPTIZ[ ][TSNM^IWINS_‘abcdeRefbgheiej‘bk GD!BDD D }BDD D !D BDD }D } BDD D D CBDD CD DBDD D ~s@@ r~s@s@ l##m HIJKLMN nMo p q? rs@ACDD s@ A A!
BDD ZK ]]IXMSTUVNWISXMVYHIJKLMNLd[OTMUVNWISXMVYHIJKLMNL BDD Z[XXIVNZPTIZ[ ][TSNM^IWINS_‘‘bcdeRetubgheieu‘bknSXvINwMVvIxRSNI nMV[LSiJXISxgyoJINtzzbWINS{MN|wSY !BDD !BDD }BDD }BDD BDD BDD BDD BDD CBDD CBDD DBDD DBDD G p~s@@ ~s@@
~C! ~C! ~C ~C ~C ~C ~C ~C ~C ~C ~CG ~CG ~CG~CG ~CA~CA ~CA~CA ~ D~ D ~ D~ D ~ C~ C ~ C~ C ~ ~ ~ ~ ~ ~ ~ ~ ~C!~C! ~C~C ~C~C ~C~C ~C~C ~CG~CG ~CG~CG ~CA~CA ~CA~CA ~ D~ D ~ D~ D ~ C~ C ~ C~ C ~ ~ ~ ~ ~ ~ ~ ~
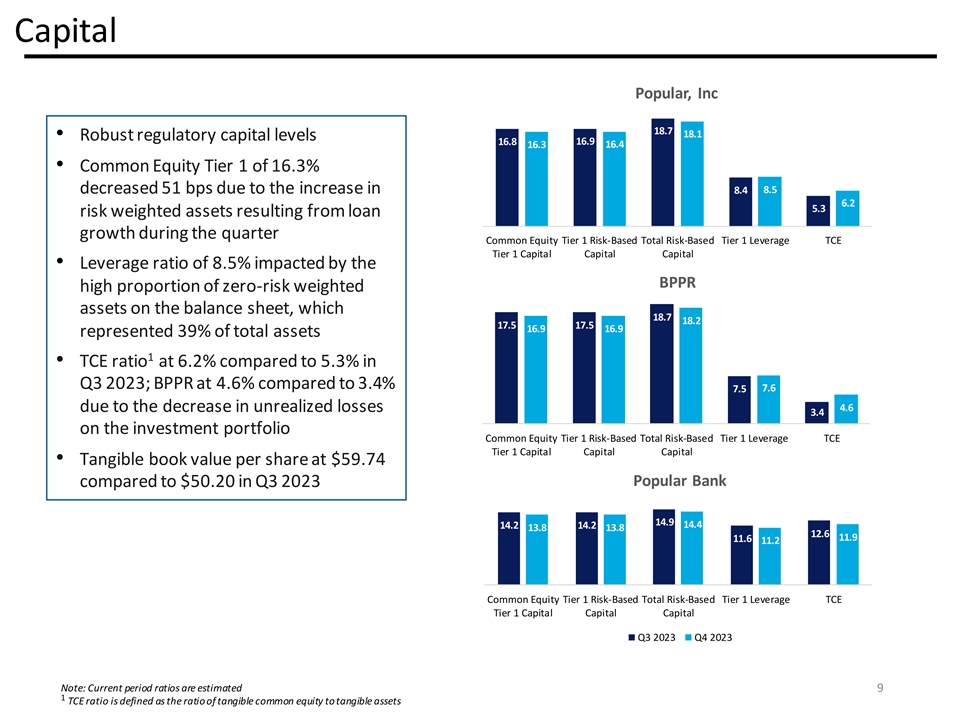
VWXYZ[]^_‘ LONQ LONL LMNOLMNP LMNTLMNR !ONRONS MNU SNT #! #!!
’. ’.$ $% ! aVVb !!&’ #! !!(#!! LONQ LONU LQNSLQNS LMNPLMNP ) * +*,*-.//00 QNSQNM !&RNM TNR ! ’. ’.$ !1 )20 1 ,*,+*,*VWXYZ[a[_c LRNP LRNR LRNULRNU LTNOLTNO LUNM LLNP LLNM LLNU ’. ’.$ +*,*+0*,*
3456789::6;5<6:=4>:?5=4@?:66@5= A?56>) B8C:?5=4=@>6D=;6>?@5E6:?5=44D5?;F=GH6I4A A4;6J9=5K545?;F=GH6?@@65@

15%&& $(.=%+ d e)&()’%f ?@ABCDEF@E GHAIJKKDLK 49 !
g1=)h12h%’&%)%hij46 $(()h4 $((k &%l%’+(d%j48 ! 47 m12((’&%)%hij48 $((k $+jh&(d% ! 46 ij)(.%’$$%&’()&%)+(0(l(+0% ! ’$$%&’()l&+( 4 ! 4 m12)+49 $((k&!)khij ! 4 4 $((k
$)(jh&(d%ij%& $&+.).%12ij ! 4 $((k%+(l)&+ij0(.0%&’, $%&12 4 ij4 $(( ! 4 m12)+49 $((k& !)k(’&%)(.45 ! ij4 $((k $+jh&(d%ij0(.0%&’$$%&’() 12/:/12;<1=3>+)=%+ 12ij4$(( ! ?@ABCDEF@E
GHAIa@_AK ^@L_‘?CabAF‘@cK ! ! ! ! ! ! ! ! #$$%&’()*#+&,’+( -&+.).%/+0%&1232) MNOOPQRSTUS VTOOTNUR MTWWXQXUYXRSZ[XSNSQN[UZTU]
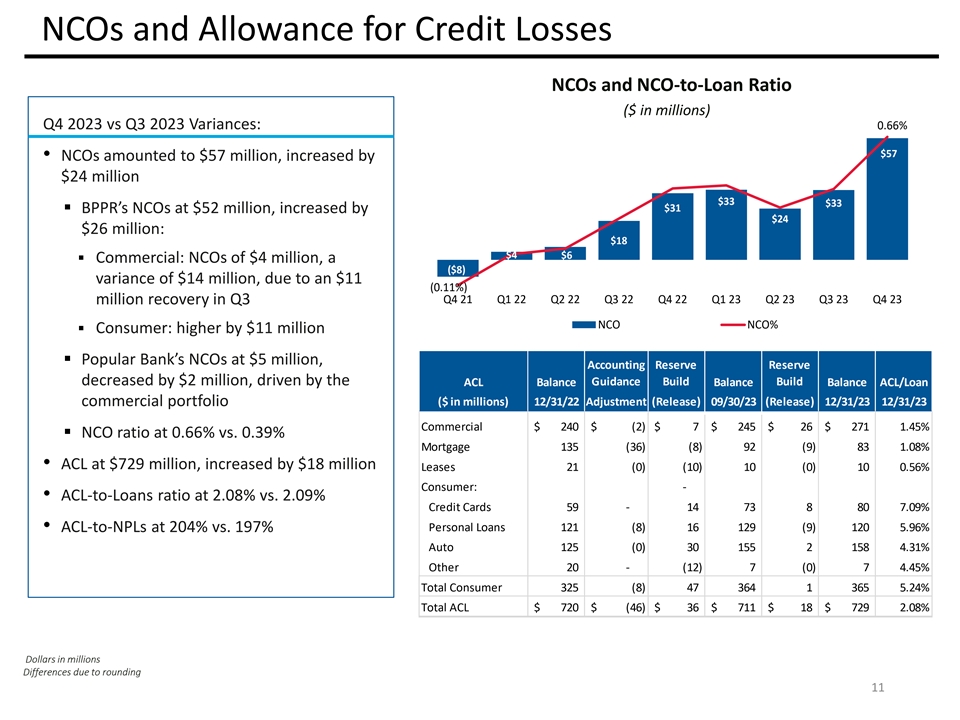
NCOs and Allowance for Credit Losses NCOs and NCO-to-Loan Ratio ($ in
millions) Q4 2023 vs Q3 2023 Variances: 0.66% $57 • NCOs amounted to $57 million, increased by $24 million $33 $33 $31 ▪ BPPR’s NCOs at $52 million, increased by $24 $26 million: $18 $4 $6 ▪ Commercial: NCOs of $4 million, a
($8) variance of $14 million, due to an $11 (0.11%) million recovery in Q3 Q4 21 Q1 22 Q2 22 Q3 22 Q4 22 Q1 23 Q2 23 Q3 23 Q4 23 NCO NCO% ▪ Consumer: higher by $11 million ▪ Popular Bank’s NCOs at $5 million, Accounting Reserve
Reserve decreased by $2 million, driven by the Guidance Build Build ACL Balance Balance Balance ACL/Loan ($ in millions) 12/31/22 Adjustment (Release) 09/30/23 (Release) 12/31/23 12/31/23 commercial portfolio Commercial $ 240 $ (2) $ 7 $ 245 $ 26 $
271 1.45% ▪ NCO ratio at 0.66% vs. 0.39% Mortgage 135 (36) (8) 92 (9) 83 1.08% • ACL at $729 million, increased by $18 million Leases 21 (0) (10) 10 (0) 10 0.56% Consumer: - • ACL-to-Loans ratio at 2.08% vs. 2.09% Credit Cards 59 -
14 73 8 80 7.09% • ACL-to-NPLs at 204% vs. 197% Personal Loans 121 (8) 16 129 (9) 120 5.96% Auto 125 (0) 30 155 2 158 4.31% Other 20 - (12) 7 (0) 7 4.45% Total Consumer 325 (8) 47 364 1 365 5.24% Total ACL $ 720 $ (46) $ 36 $ 711 $ 18 $ 729
2.08% Dollars in millions Differences due to rounding 11
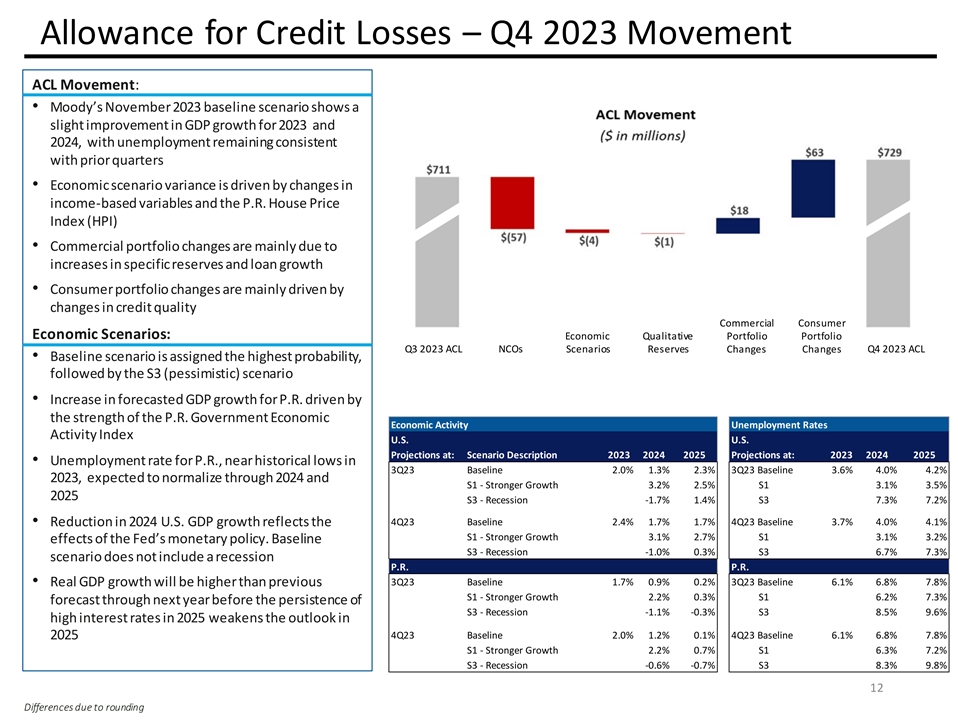
e55=DH@N?E=<Z<?I69p=44?4qrJFG s=>? :?@9 ! #$%&
’(&)*+*,(-#&./0&0-)/#23#- 4567896 :;<=>? :?@96@ABC7<=D98E=<FGH@I FJKD698L@? :;5=M :?@9<? :H6@6@7N=@4649?@9 D698;<6=<OLH<9?<4 PN=@= :6N4N?@H<6=>H<6H@N?64I<6>?@QMN8H@7?46@ 6@N=
:?RQH4?I>H<6HQ5?4H@I98?CSTSU=L4?C<6N? V@I?WXUCVY Z= ::?<N6H5;=<9E=56=N8H@7?4H<? :H6@5MIL?9= 6@N<?H4?46@4;?N6E6N<?4?<>?4H@I5=H@7<=D98 Z=@4L :?<;=<9E=56=N8H@7?4H<? :H6@5MI<6>?@QM
N8H@7?46@N<?I69OLH569M Z= ::?<N6H5Z=@4L :?< [ ]^_‘]ab PN=@= :6NrLH569H96>?C=<9E=56=C=<9E=56= rGFGeZpZ4dN?@H<6=4T?4?<>?4Z8H@7?4Z8H@7?4rJFGeZp cH4?56@?4N?@H<6=64H4467@?I98?8678?49;<=QHQ6569MK
E=55=D?IQM98?dGX;?446:6496NY4N?@H<6= V@N<?H4?6@E=<?NH49?IABC7<=D98E=<CSTSI<6>?@QM 98?49<?@798=E98?CSTSA=>?<@ :?@9PN=@= :6N [ ]]]tu vwtx_a eN96>69MV@I?W uy^yuy^y
z‘{]a_b^_‘]|a‘]v]}~}}~}}~}z‘{]a_b}~}}~}}~} f@? :;5=M :?@9<H9?E=<CSTSK@?H<8649=<6NH55=D46@ GrGcH4?56@?SFSGSGGrGcH4?56@?GSJSFJS FGK?W;?N9?I9=@=< :H56g?98<=L78FJH@I dRd9<=@7?<A<=D98GSShdGSGSh Fh
dGRT?N?446=@RSSJdGSGS JrGcH4?56@?SJSSJrGcH4?56@?GSJSFJS T?ILN96=@6@FJfSdSABC7<=D98<?E5?N9498? dRd9<=@7?<A<=D98GSSdGSGS &ii&1j#ij2&k& # ’0&j-)!l./1!mn-#&./0& dGRT?N?446=@RSFFSGdGSSG
4N?@H<6=I=?4@=96@N5LI?H<?N?446=@ zyxyzyxy GrGcH4?56@?SFSFSGrGcH4?56@?SSS T?H5ABC7<=D98D655Q?8678?<98H@;<?>6=L4 dRd9<=@7?<A<=D98SFSGdSSG E=<?NH4998<=L78@?W9M?H<Q?E=<?98?;?<4649?@N?=E dGRT?N?446=@RSRFSGdGShS
86786@9?<?49<H9?46@FhD?Ho?@498?=L95==o6@ JrGcH4?56@?SFSFSJrGcH4?56@?SSS Fh dRd9<=@7?<A<=D98SFSdSGS dGRT?N?446=@RFSRFSdGSGS
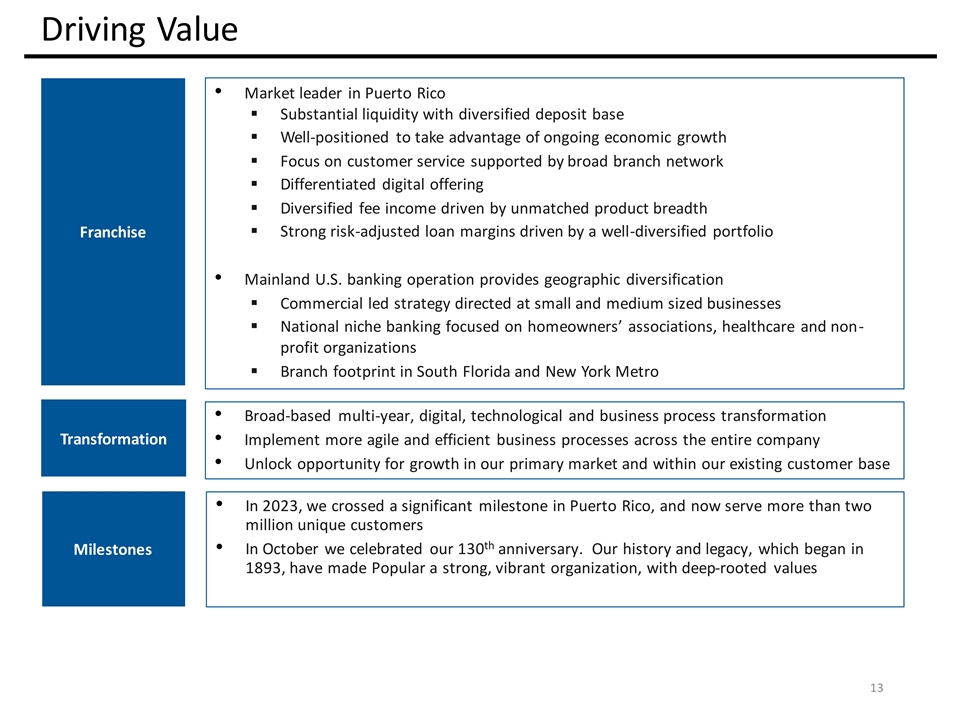
! #$%& ’( ! )*( ’ +%& , + ((!$!!&%
’’’’ ’’ +!$ +&(!& *- + !$%* ’(’ ./ /!(( (& ’ 0 ++ $ + + + 1! 23456738759:;<37=57>?69@A;B67:6 C;6D7;EAF3AA69534567AG:;384:93E;37B767* (’1 H&’( &,I%J H*!
+*$PP&! ( ’ + KLMNOMQ +( + +’’! ( & +($ .(($’%&( +$ +%&R +! QWXWTP% ’ + P% +&% +# + & UVOMQY!%!STX $/Y& $$P%&&! SZ[TP& +( P!1P%&(* ST
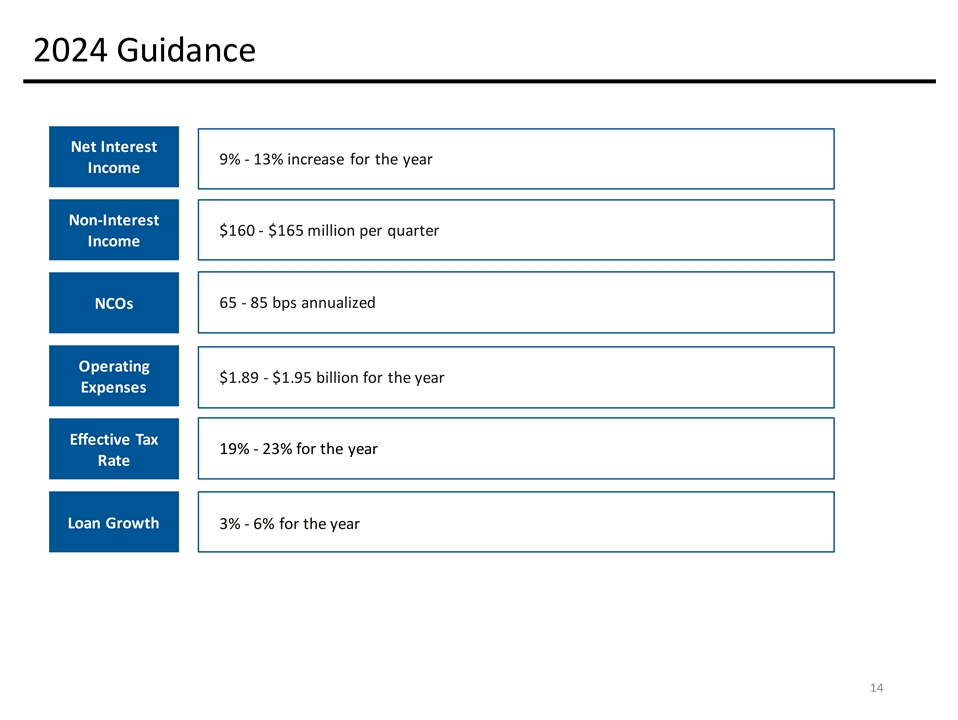
3*+)*/;-./012/ 4,+4,7 =99.:/>/0/ ,7+678:;9< 4563+4537899.-./012/
!! # 3*+)*-./012/ $ %& ’( )*+,*-./012/

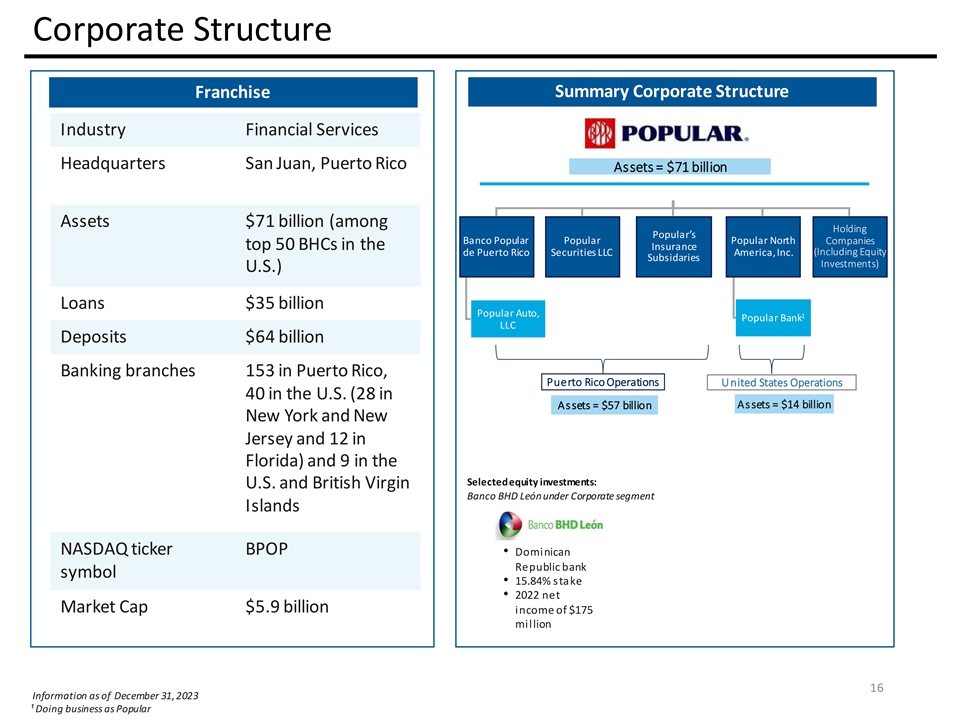
FG HH@AIJKALKA@MNFMAGOMGAN PA@BOQCEN ’! $ ()*+,-. #/) 012-,34
y~# $ %56-7*8+,-.9:8,;< ! 6-=34; 03-;4> %% y! ’ & xR{! ?@ABCBDE?@ABCBDE &!#’y {~#%%}z & ’} # FNlNOMNmNnGCMICBoNEMHNBMEp %%# qYT_Vqr]s^tThTu^WvVWjVWYZ^^g X^TZ x& wx $ !!& $! w’y%z{|& w}~}}
&y%! $’y $ ’R STUVW XYZ[VTYVU]^_^X‘^Wabcdeda f]V[Tg‘h[T^YiVjhkYW
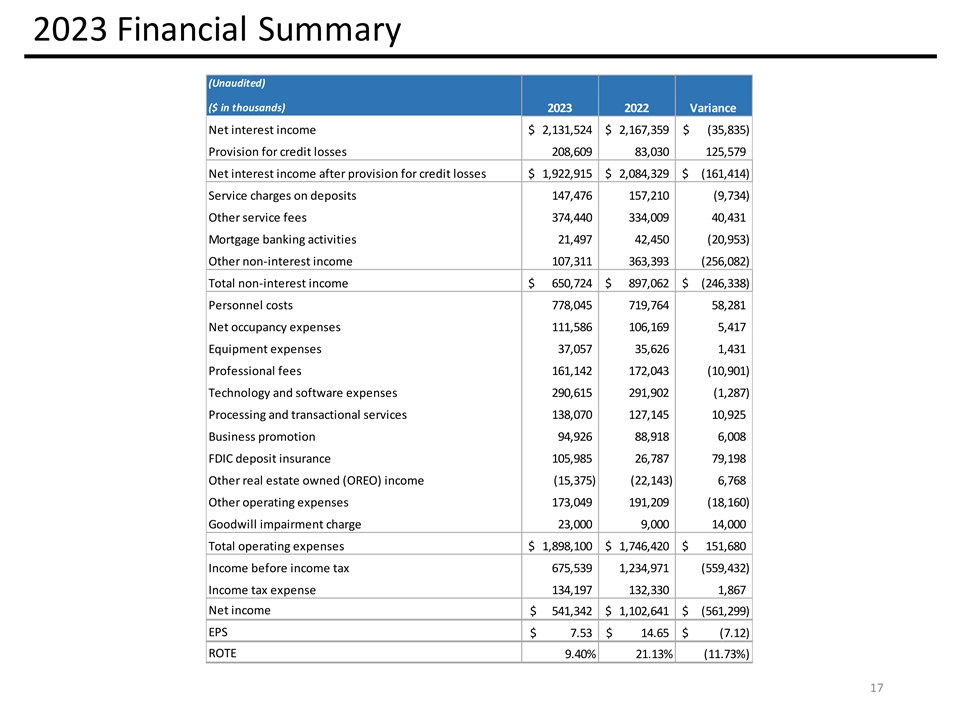
! ! JKLMKNOP #$%%$$&%’ $+(()*+.(,()-+)(/)0
1’2&’3’$4%’&&$&//(,- ()()- #$%%$$&%’ $3%$5’2&’3’$4%’&&$&+(-(-)+.(/*(-+,(**0 $2$67$&’4$5’&%&*(*,.)(-(*0 8%6$&$2$3$$&*(** **(-(*
9’%77$:;7%2%$&*(*- .(*)(-)0 8%6$’<%$$&%’ $ ( .,(-),(/0 =’%’<%$$&%’ $+ ,/)(*+.-(,+*,(/0 1$&’$’&%&/(*))-(,*/(/ #$%’5$>5$&$&()/,),(,-(* ?@5
$%$>5$&$&() )(,,(* 1’3$&&’3$$&,(* .(*(-0 =$6’’74&’3%A$$>5$&$&-(,).-(-(/0 1’$&&74%&%’&$2$&/( (*)(-) B&$&&5’
’%’-/*(-,,/(-/(/ CDE4$5’&%&$)(-/) ,(/-(-/ 8%6$$$&%%$’A$4.8F?80’ $ ..)()0,(*0(,/ 8%6$’5$%7$>5$&$&(*-.-(-/(,0 G’’4A 5 $%67$-( (*(
=’%’5$%7$>5$&$&+(/-/(+(*,(*+)(,/ D’ $:$3’$’ $%>,)()-.(*(-))-(*0 D’ $%>$>5$&$*(-((/, #$%’ $ +)*(*+.((,*+),(--0 ?1 +H)+.*H,)+H0 F8=? -H*IHI.HI0
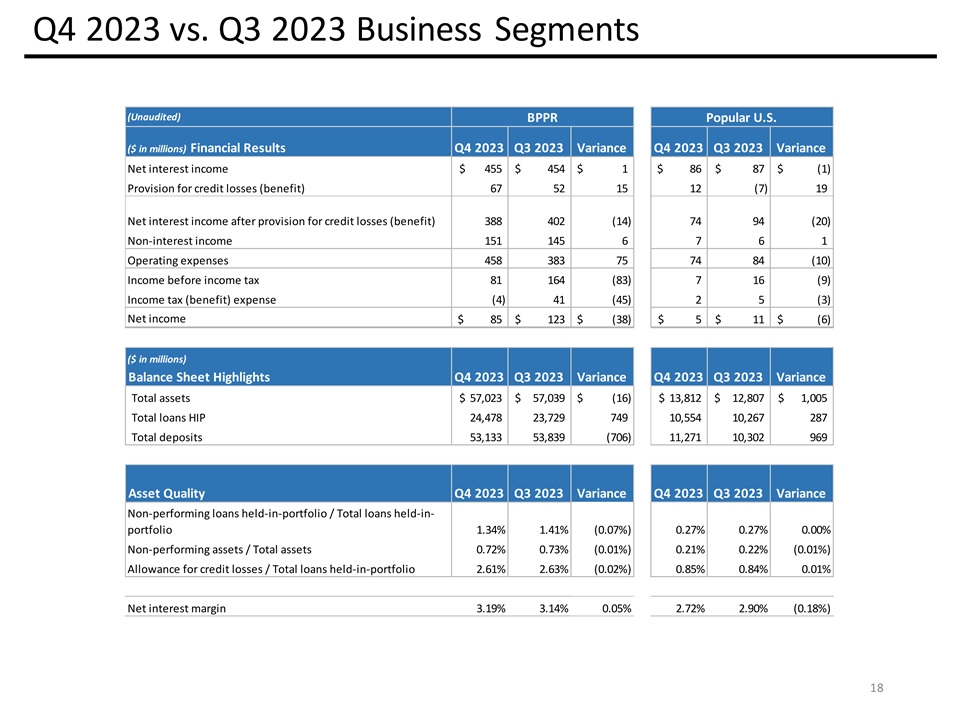
L[[*[]-)’5^_M_ !! #$%&’&(%’)*+,-).,/0121
3/312134’5%’&(+/0121 3/312134’5%’&(+ 6789;::;:; ;<;>=;? @799A9787BC9>DA?<:= : >=?E 6789FA7G799A9787BC9>DA?>=? E>? 69H789 : <: =< IG7FJG: ==: >? K89DA9789FJ>< =? ><E?
K89FJ>DA?JG>? >:? :>? 689 ;:;>;:?; ;>;<? !! # L’)’&(+MN++.O%PN)%PN.,/0121 3/312134’5%’&(+/0121 3/312134’5%’&(+ Q9FCF:;:=R;>=RE; <?;R;R=;R: Q9FCC9FSK@R==R=E E R::R<==
Q9FCBG9::R >RE =<? R=ER<E T,,+./-’)%.U/0121 3/312134’5%’&(+/0121 3/312134’5%’&(+ 69HG7A97C9FVCBHHG97A9C9WQ9FCC9FVCBHH G97A9C9 X X>=X?=X=XX 69HG7A97FWQ9FCF=X=X>X? X X>X?
YCC9ZF8A9787BC9WQ9FCC9FVCBHHG97A9C9<X<X>X?:X XX 67 F7EX X:X=XEX>X?
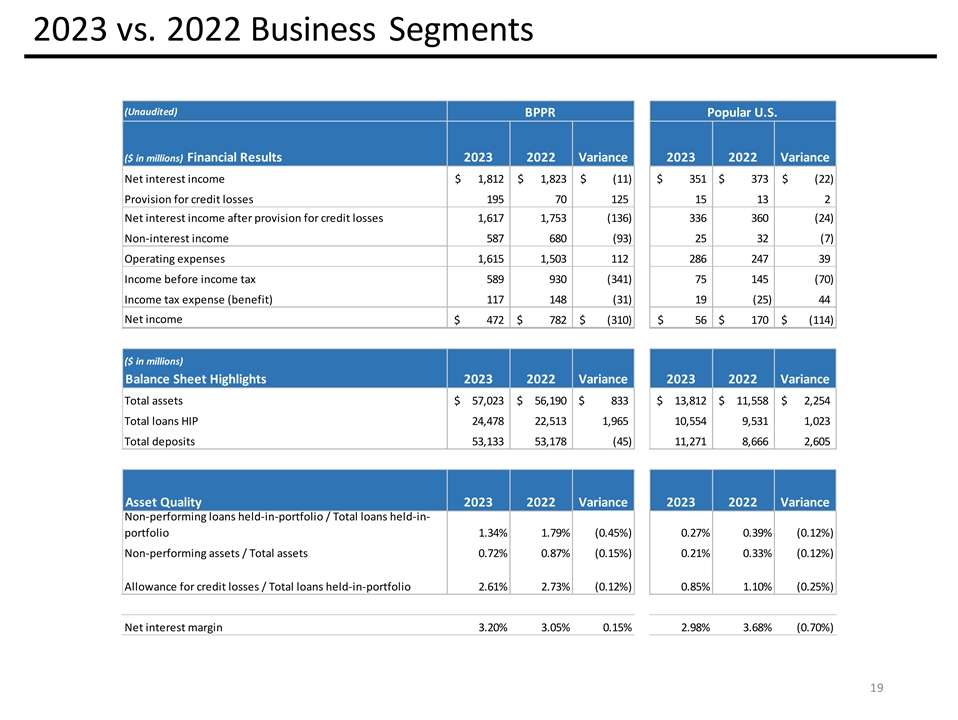
JYY(YZ[+’%1]K] !
#$%$&#%’()*+’,*-.-/-.--0%1#%$&)-.-/-.--0%1#%$&) 234586789678:8;89<8: =355>5343?@5<; ; ; 2345A>3B355>5343?@56C< 96<; C: C 9CD: 25E345 ;C7< 97 : ; 9<: FB3AGB6C; 6; 7C D< H45I>5345AG;7 9<D: ;
9D;<: H45AGGB9I>:< 9D7 : 9D;:D 245 8<D<8978;:8 C89<8D: ! J%’%$&)KL)),M#NL’#NL,*-.-/-.--0%1#%$&)-.-/-.--0%1#%$&) O5A@A;8;<687C6886786;;786;D O5A@@5APH=D6D<76; 6C; 6;;D 6;6 O5A@?B5;;6 96<7 D;: 76<
6CCC6C; Q**),R+%’#,S-.-/-.--0%1#%$&)-.-/-.--0%1#%$&) 25EB3>53@5AT@?EEB53>5@5UO5A@@5AT@?EE B53>5@5DV<V9D;V:<V V9V: 25EB3>53AUO5A@A<V7<V9;V: V V9V: W@@5XA4>5343?@5UO5A@@5AT@?EEB53>5@5CV<V9V:7;V V9;V: 23
A3 V;V;V7VC7V9<V:
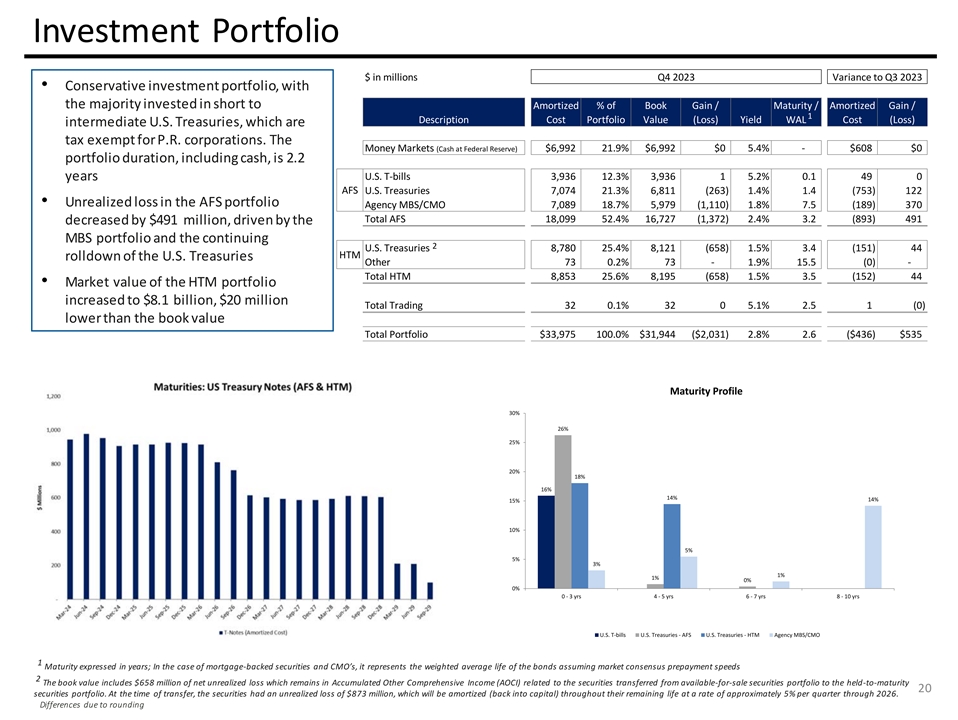
<=>?@A B?=ACDEAFDGHD gH= BHGGHD=@hiefejklEHl=m?ADhjefej
sD=@?E>lAH>?H=>?@A B?=AoDEAFDGHDHA A? BlDEHAH=>?@A?rH=@DEAAD p BDEAHq?rtDFuDDvxlH=y ~lAwEHAyp BDEAHq?rxlH=y n?@mEHoAHD=sD@ACDEAFDGHDklGw?z{D@@|}H?Gr p{sD@Az{D@@| H=A?E B?rHlA?E?l@wEH?@HmlE? Al?? BoAFDECmDEoDElAHD=@? ~D=?
~lEv?A@zsl@lA?r?ElG?@?E>?|g ee tgegfitgfgf oDEAFDGHDrwElAHD=H=mGwrH=ml@H@ee HGG@jjejtjj etfif ?lE@ p E?l@wEH?@efijtzej|itzi j|ee =E?lGHq?rGD@@H=A?poDEAFDGHD p?=m ~uys ~ f tzf| tzj|f DAlGpfeitze eje|itjze ij| r?mE?l@?rgi BHGGHD=rEH>?=A?
~uoDEAFDGHDl=rA?mD=AH=wH= e E?l@wEH?@efitze | tjzi i|i ~ EDGGrD=DFA?E?l@wEH?@ A?Efjetj tzf| DAlG~ej tz| tjzie|i ~lEv?A>lGw?DFA? ~oDEAFDGHD H=mE?l@?rADgHGGHD=gef BHGGHD= DAlGElrH=jfe tjfe tezf| GD?EAl=A?DDv>lGw? DAlGCDEAFDGHDgjj
ffftgjiizgefj|etezgij|gj ¡¢£⁄¥ƒ§ jft et et eft t t it it t ft t t jt t t ft ftftfftftftt ft fjE@iE@E@fE@ HGG@E?l@wEH?@pE?l@wEH?@~p?=m ~uys ~ I J$*$K ))#LMNOPQRPNSTUVUPRMWQX
YZ[RUVTP]TPRPWVRV^P_PU‘^VPQMaPTM‘PbUcPdcV^P)$ ! ####$ ef %&’(&! ))*$+,)-% .../0112324526.782.9:.3:84704;
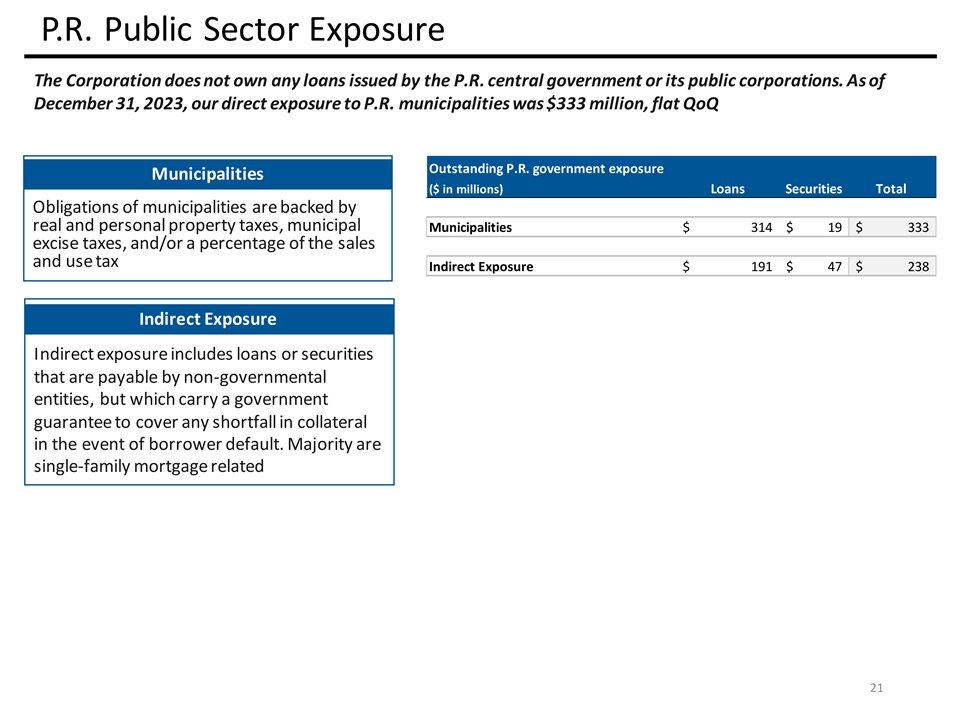
%&’()*+)*,-.)/0)’1/)-)2/,/34),/1.115’063-&’7898:’/-*,4;)<’*/ =’/-)*.-1+564.::)*+)*,-.)/18>1)? @’:’ =6’*ABCDEDAC)5*0.*’:-’F+)15*’-)7898
=5/.:.+,4.-.’12,1GAAA =.44.)/C?4,-H)H JQSQOKULK]^_‘_]YaRVK bRKQRXNYSJVR IJKLMLNOPLQLRS cdLKbLPPLYKSefYOKSgRMJVLQLRShYQOP IJKLMLNOPLQLRSik [[jkilkii TKULVRMQWXNYSJVR[k jl[kZmkin TKULVRMQWXNYSJVR ! ! ! ! #$ Z[
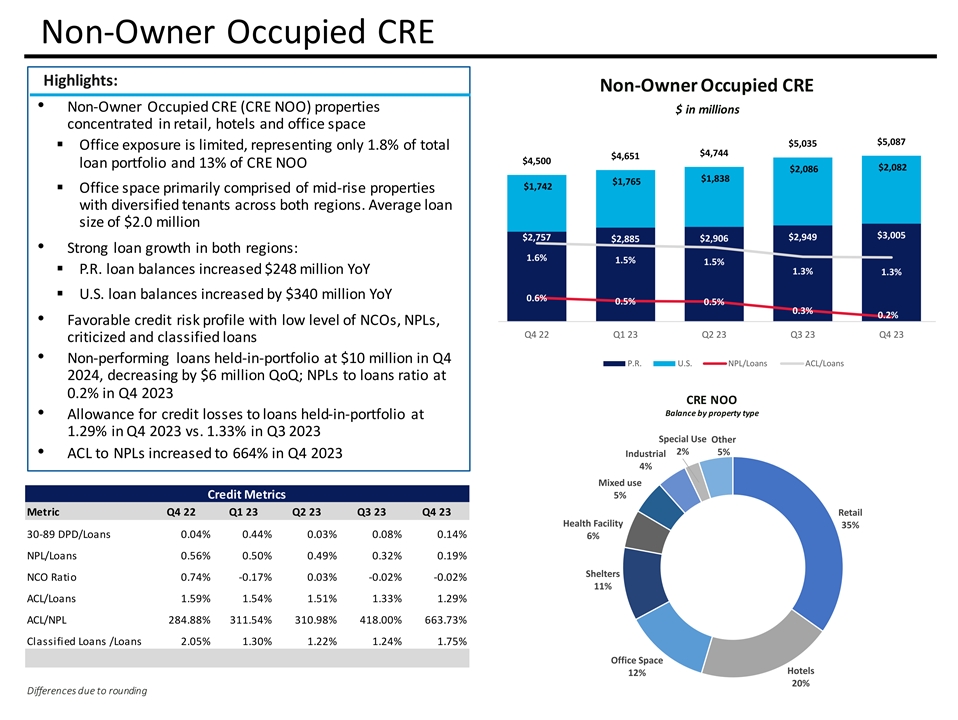
#$%&’$()&**+,-(./01 !
#$%&’$()&**+,-(./012/01 &&3,)#,()4-(5 *#$*($4)64(.-$)(46-789#4(756$.#::-*(5,6*( osqvtr osqvys ;&::-*((<,#5+)(-57- =-4(.8)(,)(5($4-$>#$7?@ABC#:4#467 oxqrxxDADC oxqwsz oxqsvv 7#6$,#)4:#7-#6$.@DC#:/01 && opqvtp
opqvtw ozqtytABC ozqrws ozqrxp ;&::-*(5,6*(,)-=6)-7?*#=,)-5(.#:=-.%)-5(,)#,()4-(5 ADC ’-49.-E()5-:-(.4($6$456*)#55F#49)(>-#$5AGE()6>(7#6$ 5-H(#:IAJ=-77-#$ @ABC oyqvvs opquxu opqrsropquvw opqtts
!K4)#$>7#6$>)#’49-$F#49)(>-#$5L z{w| @ADC z{s| z{s| ;MA0A7#6$F676$*(5-$*)(65(.INB =-77-#$O#Oz{y| z{y| JABC ;PAKA7#6$F676$*(5-$*)(65(.F?IDNJ =-77-#$O#O v{w| v{s|v{s| v{y|JADC v{p| !Q6E#)6F7(*)(.-4)-5R,)#:-7(’-497#’7(E(7#:
/&58 MS58 TNT@DTDTDDTND %JAC *)-4-*-H(.6$.*7655-:-(.7#6$5 ! #$%,():#) =-$>7#6$59(7.%-$%,#)4:#7-#64I@J=-77-#$-$TN MA0APAKA MS}S#6$5G/S}S#6$5 JN8.(*)(65-$>F?IU=-77-#$T#TV MS54#7#6$5)64-#64 JAC-$TNJD fgghijklmlimnknkli
!G77#’6$*(:#)*)(.-47#55(54#7#6$59(7.%-$%,#)4:#7-#64 @AWC-$TNJDE5A@ADDC-$TDJD p| s| !G/S4# MS5-$*)(65(.4#UUNC-$TNJD x| ~ ~s| ~xppzpyppyypyxpy ys| DJ%BWM}S#6$5JAJNCJANNCJAJDCJAJBCJA@NC w| MS}S#6$5JAUCJAJCJANWCJADCJA@WC
/&064-#JANC%JA@CJAJDC%JAJC%JAJC zz| G/S}S#6$5@AWC@ANC@A@C@ADDC@AWC G/S} MSBNABBCD@@ANCD@JAWBCN@BAJJCUUDADC /7655-:-(.S#6$5}S#6$5AJC@ADJC@AC@ANC@AC zp| pv| XYZZ[[]^[_‘ab[‘cd‘db]aY]e
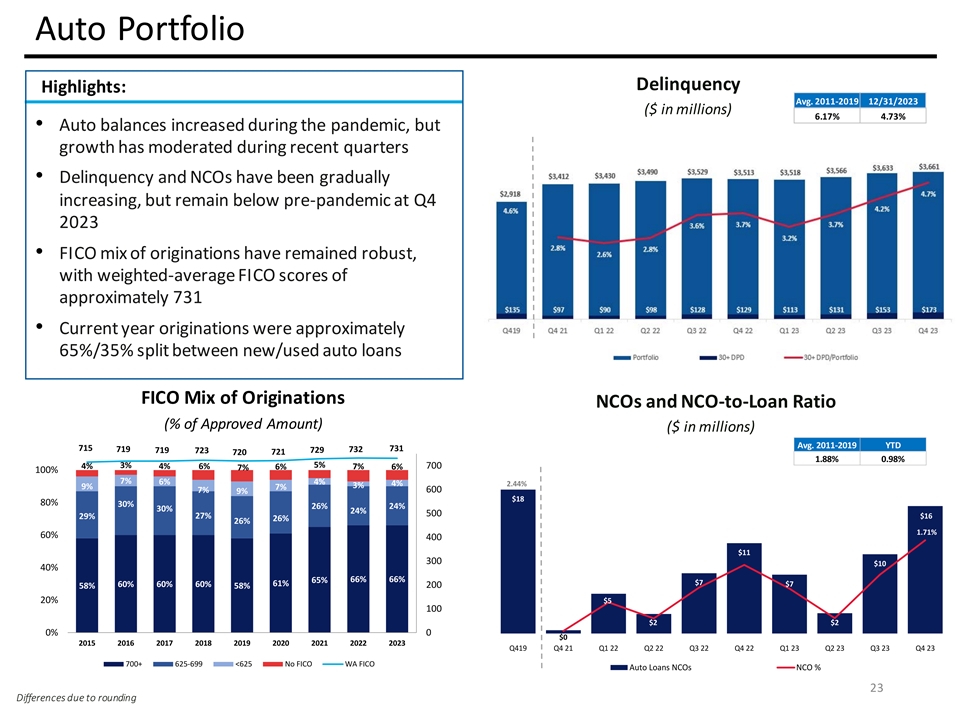
12342567 _‘aD=bc‘=de fDTgaDTg@;h ~T? EFGH IGJJGKHLM i
12jk6klmno7lm4nkonpp147lq2rnsklpn t7muj12 q4v2rrko tpn4k2npp147lq4nmnl2w1k42n4o ixn67lw1nlmyklp orkznjnnlq4kp1k66y 7lm4nko7lquj124n tk7ljn6vs4nsklpn t7mk2{ i t7|547q7lk27lorkzn4n tk7lnp4j1o2u v72rvn7qr2npkzn4kqn om4no5 kss4|7 tk2n6y
i144nl2ynk447q7lk27lovn4nkss4|7 tk2n6y }os672jn2vnnllnv}1onpk126klo NO9:PDQAR:SDTD=<@DA=; 89:;<=>89:?@A?BA<=C<@DA EUKVWXXYKZ[W IK]H^M EFGH IGJJGKHLM ~T?_ {{ { { { { { { { { ! 12klo o
#$%%&’&()&*+,-&+./+’/-(,$(0
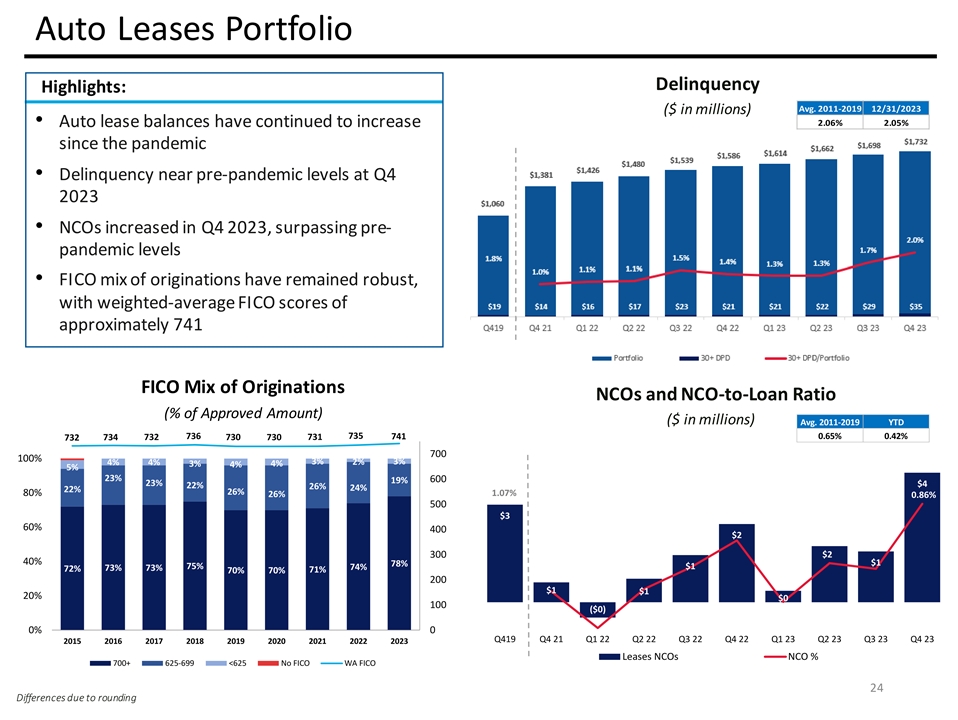
123456467829:; cdeHAfgdAhi jHXkeHXkD?l ~XC IJKL MKNNKOLPQ m
12:4564n5:5op46q5r4po2;o14s2;op84564 6;op42q4t5os4 u;p mv4:;ow14opxo458t84t5os4 u;p:4r4:652y m 6;op84564s;oyz618t566;o{t84 t5os4 u;p:4r4:6 m u;|98;{;o52;o6q5r484 u5;o4s8n162z };2q}4;{q24s5r485{4 6p8469 5tt8|; u524:x RS=>THUEV>WHXHA@DHEA?
<=>?@AB<=>CDECFE@AG@DHE IYOZ[]O^_‘[ MOaLbQ IJKL MKNNKOLPQ ~XCc yy y y y y y y y y 345646 6 ! #$%%&’&()&*+,-&+./+’/-(,$(0
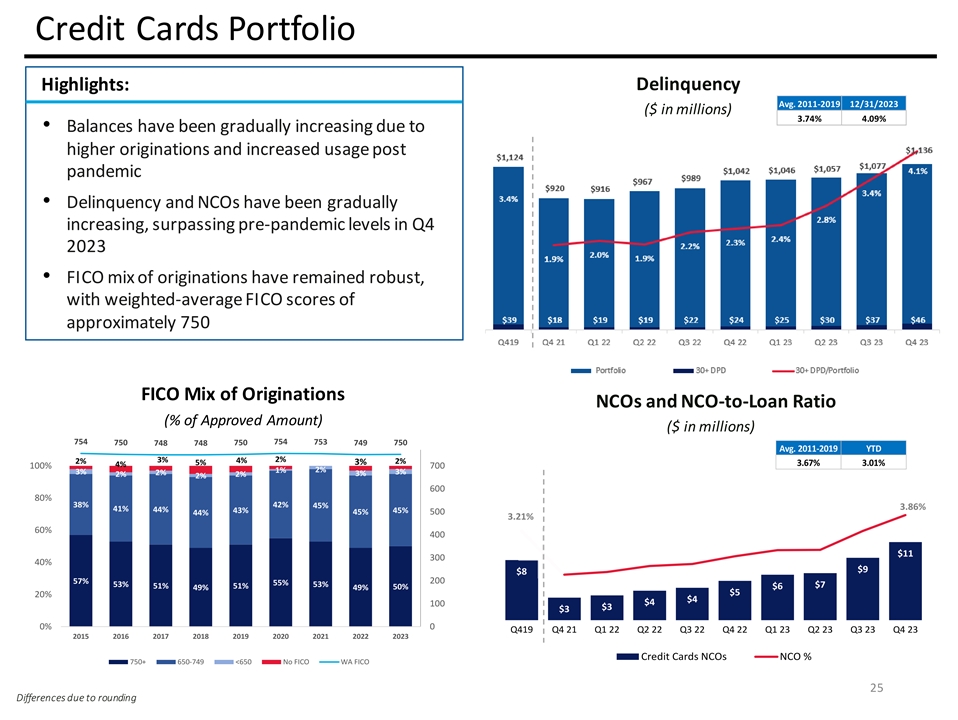
1234561378159:4 XGYZSGYZC>[QRSG@TUR@VW ~YB HIJK LJMMJNKOP
lm6:6no27p6q2r22ns163t6::u4no12674ns3t25 p4sp2114s4n654n76n34no126723t76s2v75 v6n32 w4o lx2:4nyt2nou6n3 7p6q2r22ns163t6::u 4no12674nsz7t1v6774nsv12v6n32 w4o:2q2:74n{ l w4|914s4n654n7p6q212 w64n231rt75z }45p}24sp5236q216s2 7o1279 6vv1|4 w652:u
]<=^G_D‘=aGYG@?CGD@> ;<=>?@A;<=BCDBED?@F?CGD HbNcdeefNghid LNjKkP HIJK LJMMJNKOP ~YBQ { { { { { { { { { { 123456137 7 ! #$%%&’&()&*+,-&+./+’/-(,$(0
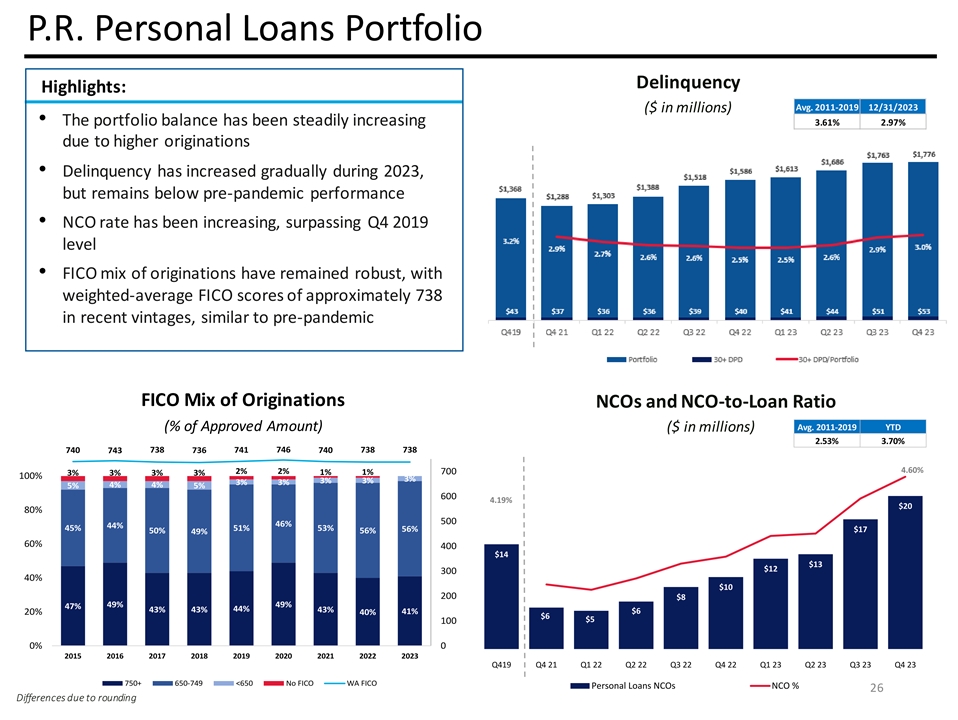
12321456789:87615;<9= efgJChifCjk lJZmgJZmFAn ZE KLMN OMPPMQNRS
opq4r5;<9=s8987t4q86s4476;48u=9v=7t5486=7w ux4;q=wq455=w=78;=76 oy49=7zx47tvq86=7t54864uw58ux899vux5=7w{ sx;54 |8=76s49}r54r87u4 |=tr45<5 |87t4 o 58;4q86s447=7t5486=7w{6x5r866=7w~ 9449 o |=<5=w=78;=76q8454 |8=74u5sx6;{}=;q }4=wq;4u8458w4
6t546<8rr5= |8;49v =754t47;=7;8w46{6= |=985;r54r87u4 |=t TU?@VJWGX@YJZJCBFJGCA >?@ABCD>?@EFGEHGBCIBFJG K[Q]^^_Q‘ab] OQcNdSZEe KLMN OMPPMQNRS ~~ ~ ~ ~ ~ ~ ~ ~ ~ ! 1456789:876 6
#$%%&’&()&*+,-&+./+’/-(,$(0
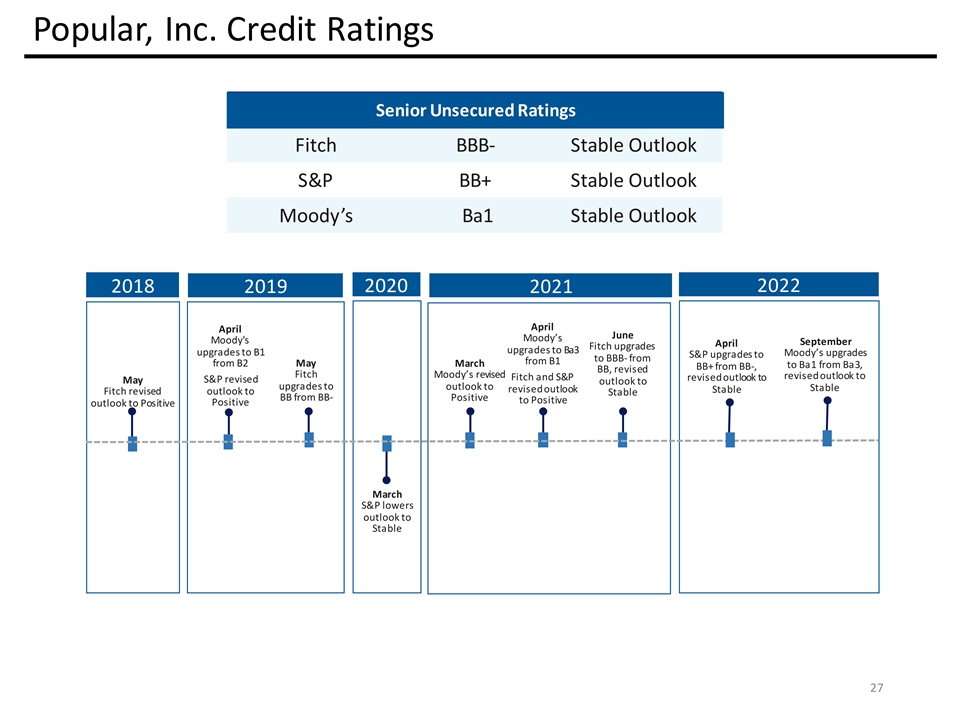
! #$ ! #$ %&’’’()*+, )-’’.)*+,
/001234’5)*+, 67676766 6758675<6765 =>? =>? L /001234 @AB >#MN =>? %& ’K ’5 /001234OPQGR1H4 )- ’’’(C D C D’5 C D’6 9 : 9 E ’5C D’K ’’.C D’’(
’’; %& /001234GHIJ4H1;, %&)- ;, )-; 9 : , ,)* ;,)* %&;, )* ’’C D’’(; ; ; ,; 9 E )-F , )* 6S

v3.23.4
| X |
- DefinitionBoolean flag that is true when the XBRL content amends previously-filed or accepted submission.
| Name: |
dei_AmendmentFlag |
| Namespace Prefix: |
dei_ |
| Data Type: |
xbrli:booleanItemType |
| Balance Type: |
na |
| Period Type: |
duration |
|
| X |
- DefinitionFor the EDGAR submission types of Form 8-K: the date of the report, the date of the earliest event reported; for the EDGAR submission types of Form N-1A: the filing date; for all other submission types: the end of the reporting or transition period. The format of the date is YYYY-MM-DD.
| Name: |
dei_DocumentPeriodEndDate |
| Namespace Prefix: |
dei_ |
| Data Type: |
xbrli:dateItemType |
| Balance Type: |
na |
| Period Type: |
duration |
|
| X |
- DefinitionThe type of document being provided (such as 10-K, 10-Q, 485BPOS, etc). The document type is limited to the same value as the supporting SEC submission type, or the word 'Other'.
| Name: |
dei_DocumentType |
| Namespace Prefix: |
dei_ |
| Data Type: |
dei:submissionTypeItemType |
| Balance Type: |
na |
| Period Type: |
duration |
|
| X |
- DefinitionAddress Line 1 such as Attn, Building Name, Street Name
| Name: |
dei_EntityAddressAddressLine1 |
| Namespace Prefix: |
dei_ |
| Data Type: |
xbrli:normalizedStringItemType |
| Balance Type: |
na |
| Period Type: |
duration |
|
| X |
- Definition
+ References
+ Details
| Name: |
dei_EntityAddressCityOrTown |
| Namespace Prefix: |
dei_ |
| Data Type: |
xbrli:normalizedStringItemType |
| Balance Type: |
na |
| Period Type: |
duration |
|
| X |
- DefinitionISO 3166-1 alpha-2 country code.
| Name: |
dei_EntityAddressCountry |
| Namespace Prefix: |
dei_ |
| Data Type: |
dei:countryCodeItemType |
| Balance Type: |
na |
| Period Type: |
duration |
|
| X |
- DefinitionCode for the postal or zip code
| Name: |
dei_EntityAddressPostalZipCode |
| Namespace Prefix: |
dei_ |
| Data Type: |
xbrli:normalizedStringItemType |
| Balance Type: |
na |
| Period Type: |
duration |
|
| X |
- DefinitionA unique 10-digit SEC-issued value to identify entities that have filed disclosures with the SEC. It is commonly abbreviated as CIK. Reference 1: http://www.xbrl.org/2003/role/presentationRef
-Publisher SEC
-Name Exchange Act
-Number 240
-Section 12
-Subsection b-2
| Name: |
dei_EntityCentralIndexKey |
| Namespace Prefix: |
dei_ |
| Data Type: |
dei:centralIndexKeyItemType |
| Balance Type: |
na |
| Period Type: |
duration |
|
| X |
- DefinitionIndicate if registrant meets the emerging growth company criteria. Reference 1: http://www.xbrl.org/2003/role/presentationRef
-Publisher SEC
-Name Exchange Act
-Number 240
-Section 12
-Subsection b-2
| Name: |
dei_EntityEmergingGrowthCompany |
| Namespace Prefix: |
dei_ |
| Data Type: |
xbrli:booleanItemType |
| Balance Type: |
na |
| Period Type: |
duration |
|
| X |
- DefinitionCommission file number. The field allows up to 17 characters. The prefix may contain 1-3 digits, the sequence number may contain 1-8 digits, the optional suffix may contain 1-4 characters, and the fields are separated with a hyphen.
| Name: |
dei_EntityFileNumber |
| Namespace Prefix: |
dei_ |
| Data Type: |
dei:fileNumberItemType |
| Balance Type: |
na |
| Period Type: |
duration |
|
| X |
- DefinitionTwo-character EDGAR code representing the state or country of incorporation.
| Name: |
dei_EntityIncorporationStateCountryCode |
| Namespace Prefix: |
dei_ |
| Data Type: |
dei:edgarStateCountryItemType |
| Balance Type: |
na |
| Period Type: |
duration |
|
| X |
- DefinitionThe exact name of the entity filing the report as specified in its charter, which is required by forms filed with the SEC. Reference 1: http://www.xbrl.org/2003/role/presentationRef
-Publisher SEC
-Name Exchange Act
-Number 240
-Section 12
-Subsection b-2
| Name: |
dei_EntityRegistrantName |
| Namespace Prefix: |
dei_ |
| Data Type: |
xbrli:normalizedStringItemType |
| Balance Type: |
na |
| Period Type: |
duration |
|
| X |
- DefinitionThe Tax Identification Number (TIN), also known as an Employer Identification Number (EIN), is a unique 9-digit value assigned by the IRS. Reference 1: http://www.xbrl.org/2003/role/presentationRef
-Publisher SEC
-Name Exchange Act
-Number 240
-Section 12
-Subsection b-2
| Name: |
dei_EntityTaxIdentificationNumber |
| Namespace Prefix: |
dei_ |
| Data Type: |
dei:employerIdItemType |
| Balance Type: |
na |
| Period Type: |
duration |
|
| X |
- DefinitionLocal phone number for entity.
| Name: |
dei_LocalPhoneNumber |
| Namespace Prefix: |
dei_ |
| Data Type: |
xbrli:normalizedStringItemType |
| Balance Type: |
na |
| Period Type: |
duration |
|
| X |
- DefinitionBoolean flag that is true when the Form 8-K filing is intended to satisfy the filing obligation of the registrant as pre-commencement communications pursuant to Rule 13e-4(c) under the Exchange Act. Reference 1: http://www.xbrl.org/2003/role/presentationRef
-Publisher SEC
-Name Exchange Act
-Number 240
-Section 13e
-Subsection 4c
| Name: |
dei_PreCommencementIssuerTenderOffer |
| Namespace Prefix: |
dei_ |
| Data Type: |
xbrli:booleanItemType |
| Balance Type: |
na |
| Period Type: |
duration |
|
| X |
- DefinitionBoolean flag that is true when the Form 8-K filing is intended to satisfy the filing obligation of the registrant as pre-commencement communications pursuant to Rule 14d-2(b) under the Exchange Act. Reference 1: http://www.xbrl.org/2003/role/presentationRef
-Publisher SEC
-Name Exchange Act
-Number 240
-Section 14d
-Subsection 2b
| Name: |
dei_PreCommencementTenderOffer |
| Namespace Prefix: |
dei_ |
| Data Type: |
xbrli:booleanItemType |
| Balance Type: |
na |
| Period Type: |
duration |
|
| X |
- DefinitionTitle of a 12(b) registered security. Reference 1: http://www.xbrl.org/2003/role/presentationRef
-Publisher SEC
-Name Exchange Act
-Number 240
-Section 12
-Subsection b
| Name: |
dei_Security12bTitle |
| Namespace Prefix: |
dei_ |
| Data Type: |
dei:securityTitleItemType |
| Balance Type: |
na |
| Period Type: |
duration |
|
| X |
- DefinitionName of the Exchange on which a security is registered. Reference 1: http://www.xbrl.org/2003/role/presentationRef
-Publisher SEC
-Name Exchange Act
-Number 240
-Section 12
-Subsection d1-1
| Name: |
dei_SecurityExchangeName |
| Namespace Prefix: |
dei_ |
| Data Type: |
dei:edgarExchangeCodeItemType |
| Balance Type: |
na |
| Period Type: |
duration |
|
| X |
- DefinitionBoolean flag that is true when the Form 8-K filing is intended to satisfy the filing obligation of the registrant as soliciting material pursuant to Rule 14a-12 under the Exchange Act. Reference 1: http://www.xbrl.org/2003/role/presentationRef
-Publisher SEC
-Name Exchange Act
-Section 14a
-Number 240
-Subsection 12
| Name: |
dei_SolicitingMaterial |
| Namespace Prefix: |
dei_ |
| Data Type: |
xbrli:booleanItemType |
| Balance Type: |
na |
| Period Type: |
duration |
|
| X |
- DefinitionTrading symbol of an instrument as listed on an exchange.
| Name: |
dei_TradingSymbol |
| Namespace Prefix: |
dei_ |
| Data Type: |
dei:tradingSymbolItemType |
| Balance Type: |
na |
| Period Type: |
duration |
|
| X |
- DefinitionBoolean flag that is true when the Form 8-K filing is intended to satisfy the filing obligation of the registrant as written communications pursuant to Rule 425 under the Securities Act. Reference 1: http://www.xbrl.org/2003/role/presentationRef
-Publisher SEC
-Name Securities Act
-Number 230
-Section 425
| Name: |
dei_WrittenCommunications |
| Namespace Prefix: |
dei_ |
| Data Type: |
xbrli:booleanItemType |
| Balance Type: |
na |
| Period Type: |
duration |
|
| X |
- Details
| Name: |
us-gaap_StatementClassOfStockAxis=us-gaap_CommonStockMember |
| Namespace Prefix: |
|
| Data Type: |
na |
| Balance Type: |
|
| Period Type: |
|
|
| X |
- Details
| Name: |
us-gaap_StatementClassOfStockAxis=us-gaap_CumulativePreferredStockMember |
| Namespace Prefix: |
|
| Data Type: |
na |
| Balance Type: |
|
| Period Type: |
|
|
Popular (NASDAQ:BPOP)
Historical Stock Chart
From Sep 2024 to Oct 2024

Popular (NASDAQ:BPOP)
Historical Stock Chart
From Oct 2023 to Oct 2024
