false
0001823144
0001823144
2023-11-09
2023-11-09
0001823144
us-gaap:CommonStockMember
2023-11-09
2023-11-09
0001823144
CMPO:RedeemableWarrantSeachWholeWarrantExercisableForOneShareOfClassACommonStockMember
2023-11-09
2023-11-09
iso4217:USD
xbrli:shares
iso4217:USD
xbrli:shares
UNITED STATES
SECURITIES AND EXCHANGE
COMMISSION
WASHINGTON, D.C. 20549
FORM 8-K
CURRENT REPORT
Pursuant to Section 13
or 15(d)
of the Securities Exchange
Act of 1934
Date of Report
(Date of earliest event reported): November 9, 2023
CompoSecure, Inc.
(Exact Name of Registrant
as Specified in its Charter)
| Delaware |
|
001-39687 |
|
85-2749902 |
(State or Other Juris-
diction of Incorporation) |
|
(Commission
File Number) |
|
(IRS Employer
Identification No.) |
|
309 Pierce Street
Somerset, New Jersey |
|
08873 |
| (Address of Principal Executive Offices) |
|
(Zip Code) |
Registrant’s telephone number, including
area code: ( 908 518-0500)
Not Applicable
(Former Name or Former
Address, if Changed Since Last Report)
Check the appropriate box below if the Form 8-K filing is intended
to simultaneously satisfy the filing obligation of the registrant under any of the following provisions (see General Instruction
A.2. below):
| ¨ |
Written communications pursuant to Rule 425 under the Securities Act (17 CFR 230.425) |
| ¨ |
Soliciting material pursuant to Rule 14a-12 under the Exchange Act (17 CFR 240.14a-12) |
| ¨ |
Pre-commencement communications pursuant to Rule 14d-2(b) under the Exchange Act (17 CFR 240.14d-2(b)) |
| ¨ |
Pre-commencement communications pursuant to Rule 13e-4(c) under the Exchange Act (17 CFR 240.13e-4(c)) |
Securities registered pursuant to Section 12(b) of the Act:
| Title
of each class |
|
Trading
Symbol(s) |
|
Name
of each exchange on which registered |
| Class
A Common Stock, $0.0001 par value |
|
CMPO |
|
Nasdaq Global Market |
| |
|
|
|
|
| Redeemable
warrants, each whole warrant exercisable for one share of Class A Common Stock |
|
CMPOW |
|
Nasdaq Global Market |
Indicate by check mark whether the registrant is an emerging growth
company as defined in Rule 405 of the Securities Act of 1933 (§ 230.405 of this chapter) or Rule 12b-2 of the Securities
Exchange Act of 1934 (§ 240.12b-2 of this chapter).
Emerging growth company x
If an emerging growth company, indicate by check mark if the registrant
has elected not to use the extended transition period for complying with any new or revised financial accounting standards provided pursuant
to Section 13(a) of the Exchange Act.
| Item 2.02 |
Results of Operation and Financial Condition |
On
November 9, 2023, CompoSecure, Inc. (the “Company”) issued a press release announcing its financial results for
the quarter ended September 30, 2023 and provided an investor presentation to accompany the press release. Copies of the press release
and the investor presentation are furnished herewith as Exhibits 99.1 and 99.2, respectively.*
| Item
7.01 |
Regulation FD Disclosure |
The
information included under Item 2.02 of this Current Report on Form 8-K is incorporated into this Item 7.01 by reference.*
(d) Exhibits
* The information in Items 2.02 and 7.01 of this Form 8-K shall
not be deemed “filed” for purposes of Section 18 of the Securities Exchange Act of 1934, as amended (the “Exchange
Act”) or otherwise subject to the liabilities of that section, nor shall it be deemed incorporated by reference in any filing under
the Securities Act of 1933 or the Exchange Act, except as expressly set forth by specific reference in such a filing.
SIGNATURE
Pursuant to the requirements of the Securities
Exchange Act of 1934, the registrant has duly caused this report to be signed on its behalf by the undersigned hereunto duly authorized.
| |
COMPOSECURE, INC. |
| |
|
| Date: November 9,
2023 |
By: |
/s/Timothy Fitzsimmons |
| |
|
Timothy Fitzsimmons |
| |
|
Chief Financial Officer |
Exhibit 99.1

CompoSecure Reports
Third Quarter 2023 Financial Results
Revises Full Year Outlook,
Which Lowers Net Sales Target to $386-$392 million While Capturing Low End of Previously Issued Adjusted EBITDA Outlook
SOMERSET,
N.J., November 9, 2023 – CompoSecure, Inc. (Nasdaq: CMPO), a leader in metal payment cards, security,
and authentication solutions, today announced its financial and operating results for the third quarter ended September 30, 2023.
“During the quarter, we exceeded our
record US revenue from the year-ago period overcoming global economic uncertainty that impacted our international business, which was
down albeit on a smaller revenue base,” said Jon Wilk, President and CEO of CompoSecure.
“Consumer
demand for premium metal cards remains strong based on card issuer feedback and industry sentiment. At the same time, select customers
are more tightly managing inventory levels, which impacted order volumes in Q3 and into Q4. As a result, we are revising our full year
2023 outlook which lowers our sales guidance and captures the low end of our previously issued Adjusted EBITDA guidance.
Mr. Wilk added: “We are on track
to achieve the most successful year in our company's history in terms of Net Sales, Adjusted EBITDA, and Operating Cash Flow, following
a record year of growth and profitability in 2022. We continue to optimize our balance sheet and prudently manage operating expenses while
investing in growth, including incrementally reducing our outstanding debt this quarter to further improve our leverage ratio.”
Q3 2023 Financial Highlights (vs. Q3 2022)
| · | Net Sales: Net Sales were $96.9 million compared to $103.3 million. The decrease was driven by lower international sales, which
is a more variable market due to global economic uncertainty, customer mix and a smaller sales base. Domestic sales increased modestly
compared to the record year-ago period. |
| · | Gross Profit: Gross Profit was $48.9 million or 50.5% of Net Sales, compared to $61.8 million or 59.8%. The decrease was primarily
due to lower production efficiencies from new and innovative card constructions, as well as an impact from inflationary pressure on wages
and materials. |
| · | Net Income/EPS: Net Income increased 74% to $38.0 million compared to $21.9 million. The increase was primarily driven by prudent
operating expense controls, as reflected by a reduction in selling, general and administrative expenses, as well as changes to the fair
value of warrant liabilities, earnout consideration liability and derivative liability. Net Income per share attributable to class A common
stockholders was $0.39 (Basic) and $0.34 (Diluted), compared to $0.18 (Basic) and (Diluted) in the year-ago period. |
| · | Adjusted Net Income/Adjusted EPS: Adjusted Net Income (a non-GAAP measure) increased 10% to $21.7 million compared to $19.8
million in the year-ago period. Adjusted EPS (a non-GAAP measure), which includes both class A and class B shares, was $0.27 (Basic) and
$0.24 (Diluted) compared to $0.26 (Basic) and $0.22 (Diluted) in the year-ago period (see reconciliation
of non-GAAP measures shown in table below). |
| · | Adjusted EBITDA: Adjusted EBITDA (a non-GAAP measure) increased 9% to $35.5 million compared to $32.7 million, with the increase
driven in-part by the aforementioned operating expense controls. |
| · | Balance Sheet: At September 30, 2023, the Company’s secured debt leverage ratio decreased to 1.48x compared to 2.92x
at September 30, 2022. |
Recent Operational Highlights
| · | Customers launched several new metal card programs this quarter including Amex Hilton Aspire, Amex SAS
Elite and Axis Magnus, to name a few. |
| · | Arculus Authenticate
hardware passkeys received official designation as a Microsoft FIDO2 security key vendor
and is now compatible within the Microsoft ecosystem, offering users a reliable and user-friendly
secure passwordless authentication solution |
| · | Arculus Cold Storage enhancements included: |
| · | Custom tokens across three additional chains—Binance Smart Chain, Ethereum, and Polygon; now supporting 95% of crypto tokens
by market cap. |
| · | Expanded Arculus integration with MetaMask, bolstering security by enabling the Arculus card as a signing device for safe offline
private key storage. |
| · | Cross-chain DeFi capabilities via WalletConnect across major chains—Binance Smart Chain, Ethereum, Polygon, Avalanche. |
2023 Financial Outlook
The Company is revising its guidance for full
year 2023 results, and now expects net sales to be in the range of $386-$392 million (previously $400-$425 million) and adjusted EBITDA
in the range of $141-$146 million (previously $145-$155 million).
Conference Call
The Company will host a conference call and
live audio webcast today at 5:00 p.m. Eastern time to discuss its financial and operational results, followed by a question-and-answer
period.
Date: Thursday, November 9, 2023
Time: 5:00 p.m. Eastern time
Dial-in
registration link: here
Live
webcast registration link: here
If you have any difficulty registering or
connecting with the conference call, please contact Elevate IR at (720) 330-2829.
A
live webcast and replay of the conference call will be available on the investor relations section of the Company’s website at
https://ir.composecure.com/news-events/events.
About CompoSecure
Founded
in 2000, CompoSecure (Nasdaq: CMPO) is a technology partner to market leaders, fintechs and consumers enabling trust for millions of
people around the globe. The company combines elegance, simplicity and security to deliver exceptional experiences and peace of mind
in the physical and digital world. CompoSecure’s innovative payment card technology and metal cards with Arculus security and authentication
capabilities deliver unique, premium branded experiences, enable people to access and use their financial and digital assets, and ensure
trust at the point of a transaction. For more information, please visit www.CompoSecure.com and www.GetArculus.com.
Forward-Looking Statements
This press release contains
forward-looking statements as defined by the Private Securities Litigation Reform Act of 1995. These statements are based on the beliefs
and assumptions of management. Although the Company believes that its plans, intentions, and expectations reflected in or suggested by
these forward-looking statements are reasonable, the Company cannot assure you that it will achieve or realize these plans, intentions,
or expectations. Forward-looking statements are inherently subject to risks, uncertainties, and assumptions. Generally, statements that
are not historical facts, including statements concerning the Company’s possible or assumed future actions, business strategies,
events, or results of operations, are forward-looking statements. In some instances, these statements may be preceded by, followed by
or include the words “believes,” “estimates,” “expects,” “projects,” “forecasts,”
“may,” “will,” “should,” “seeks,” “plans,” “scheduled,” “anticipates”
or “intends” or the negatives of these terms or variations of them or similar terminology. Forward-looking statements are
not guarantees of performance. You should not put undue reliance on these statements which speak only as of the date hereof. You should
understand that the following important factors, among others, could affect the Company’s future results and could cause those results
or other outcomes to differ materially from those expressed or implied in the Company’s forward-looking statements: the ability
of the Company to grow and manage growth profitably, maintain relationships with customers, compete within its industry and retain its
key employees; the possibility that the Company may be adversely impacted by other global economic, business, competitive and/or other
factors; the outcome of any legal proceedings that may be instituted against the Company or others; future exchange and interest rates;
and other risks and uncertainties, including those under “Risk Factors” in filings that have been made or will be
made with the Securities and Exchange Commission. The Company undertakes no obligations to update or revise publicly any forward-looking
statements, whether as a result of new information, future events or otherwise, except as required by law.
Use of Non-GAAP Financial Measures
This press release includes certain non-GAAP
financial measures that are not prepared in accordance with accounting principles generally accepted in the United States (“GAAP”)
and that may be different from non-GAAP financial measures used by other companies. The Company believes EBITDA, Adjusted EBITDA, Adjusted
Net Income and Adjusted EPS are useful to investors in evaluating the Company’s financial performance. The Company uses these measures
internally to establish forecasts, budgets and operational goals to manage and monitor its business, as well as evaluate its underlying
historical performance and to measure incentive compensation, as we believe that these non-GAAP financial measures depict the true performance
of the business by encompassing only relevant and controllable events, enabling the Company to evaluate and plan more effectively for
the future. Due to the forward-looking nature of the financial guidance included above, specific quantification of the charges excluded
from the non-GAAP financial measures included in such financial guidance, including with respect to depreciation, amortization, interest,
and taxes, that would be required to reconcile the non GAAP financial measures included in such financial guidance to GAAP measures are
not available, so it is not feasible to provide accurate forecasted non-GAAP reconciliations without unreasonable effort. Consequently,
no disclosure of estimated comparable GAAP measures is included, and no reconciliation of the forward looking non-GAAP financial measures
is included. In addition, the Company’s debt agreements contain covenants that use a variation of these measures for purposes of
determining debt covenant compliance. The Company believes that investors should have access to the same set of tools that its management
uses in analyzing operating results. EBITDA, Adjusted EBITDA, Adjusted Net Income and Adjusted EPS should not be considered as measures
of financial performance under U.S. GAAP, and the items excluded from EBITDA, Adjusted EBITDA, Adjusted Net Income and Adjusted EPS are
significant components in understanding and assessing the Company’s financial performance. Accordingly, these key business metrics
have limitations as an analytical tool. They should not be considered as an alternative to net income or any other performance measures
derived in accordance with U.S. GAAP or as an alternative to cash flows from operating activities as a measure of the Company’s
liquidity and may be different from similarly titled non-GAAP measures used by other companies. Please refer to the tables below for the
reconciliation of GAAP measures to these non-GAAP measures for the quarter ended September 30, 2023.
Corporate Contact
Anthony Piniella
Head of Communications, CompoSecure
(917) 208-7724
apiniella@composecure.com
Investor Relations Contact
Sean Mansouri, CFA
Elevate IR
(720) 330-2829
CMPO@elevate-ir.com
CompoSecure, Inc.
Condensed Consolidated Balance Sheet Data
(in
thousands)
| | |
September 30, 2023 | | |
December 31, 2022 | |
| | |
(unaudited) | | |
| |
| ASSETS | |
| | | |
| | |
| Cash and cash equivalents | |
$ | 23,817 | | |
$ | 13,642 | |
| Accounts Receivable, net | |
| 48,533 | | |
| 37,272 | |
| Inventories | |
| 51,988 | | |
| 42,374 | |
| Prepaid expenses and other current assets | |
| 3,911 | | |
| 3,824 | |
| Property and equipment, net | |
| 23,076 | | |
| 22,655 | |
| Right of use assets operating, net | |
| 7,950 | | |
| 8,932 | |
| Deferred tax asset | |
| 27,693 | | |
| 25,569 | |
| Derivative asset - interest rate swap | |
| 8,055 | | |
| 8,651 | |
| Deposits and other assets | |
| 24 | | |
| 24 | |
| TOTAL ASSETS | |
$ | 195,047 | | |
$ | 162,943 | |
| | |
| | | |
| | |
| LIABILITIES AND STOCKHOLDERS' EQUITY | |
| | | |
| | |
| Current portion of long-term debt | |
$ | 10,333 | | |
$ | 14,372 | |
| Current portion of lease liabilities | |
| 1,910 | | |
| 1,846 | |
| Current portion of tax receivable agreement liability | |
| 1,668 | | |
| 2,367 | |
| Accounts payable | |
| 14,065 | | |
| 7,127 | |
| Accrued expenses | |
| 14,218 | | |
| 10,154 | |
| Commission payable | |
| 3,847 | | |
| 3,317 | |
| Bonus payable | |
| 6,828 | | |
| 8,177 | |
| Long-term debt, net of deferred finance costs | |
| 202,839 | | |
| 216,276 | |
| Convertible notes, net of debt discount | |
| 127,708 | | |
| 127,348 | |
| Derivative liability - convertible notes | |
| 650 | | |
| 285 | |
| Warrant liability | |
| 14,570 | | |
| 16,341 | |
| Earnout consideration liability | |
| 4,550 | | |
| 15,090 | |
| Lease liabilities, operating | |
| 6,751 | | |
| 7,766 | |
| Tax receivable agreement liability | |
| 23,953 | | |
| 24,475 | |
| Total stockholders' (deficit) | |
| (238,843 | ) | |
| (291,998 | ) |
| TOTAL LIABILITIES AND STOCKHOLDERS' EQUITY | |
$ | 195,047 | | |
$ | 162,943 | |
CompoSecure,
Inc.
Consolidated
Statements of Operations
(in
thousands, except per share amounts)
(unaudited)
| | |
Three Months Ended September 30, | | |
Nine Months Ended September 30, | |
| | |
2023 | | |
2022 | | |
2023 | | |
2022 | |
| Net sales | |
$ | 96,886 | | |
$ | 103,305 | | |
$ | 290,729 | | |
$ | 284,687 | |
| | |
| | | |
| | | |
| | | |
| | |
| Operating expenses: | |
| | | |
| | | |
| | | |
| | |
| Cost of sales | |
| 47,990 | | |
| 41,547 | | |
| 134,542 | | |
| 115,318 | |
| Selling, General and administrative | |
| 20,095 | | |
| 36,116 | | |
| 67,627 | | |
| 79,325 | |
| Total operating expenses | |
| 68,085 | | |
| 77,663 | | |
| 202,169 | | |
| 194,643 | |
| | |
| | | |
| | | |
| | | |
| | |
| Income from operations | |
| 28,801 | | |
| 25,642 | | |
| 88,560 | | |
| 90,044 | |
| | |
| | | |
| | | |
| | | |
| | |
| Total other income (expense), net | |
| 10,197 | | |
| (3,355 | ) | |
| (6,408 | ) | |
| 23,153 | |
| Income before income taxes | |
| 38,998 | | |
| 22,287 | | |
| 82,152 | | |
| 113,197 | |
| Income tax (expense) benefit | |
| (949 | ) | |
| (393 | ) | |
| (656 | ) | |
| (3,738 | ) |
| Net income | |
| 38,049 | | |
| 21,894 | | |
| 81,496 | | |
| 109,459 | |
| | |
| | | |
| | | |
| | | |
| | |
| Net income attributable to non-controlling interests | |
| 30,574 | | |
| 19,077 | | |
| 65,653 | | |
| 93,973 | |
| Net income attributable to CompoSecure, Inc | |
$ | 7,475 | | |
$ | 2,817 | | |
$ | 15,843 | | |
$ | 15,486 | |
| | |
| | | |
| | | |
| | | |
| | |
| Net income per share attributable to Class A common stockholders -basic | |
$ | 0.39 | | |
$ | 0.18 | | |
$ | 0.86 | | |
$ | 1.02 | |
| Net income per share attributable to Class A common stockholders - diluted | |
$ | 0.34 | | |
$ | 0.18 | | |
$ | 0.75 | | |
$ | 0.94 | |
| | |
| | | |
| | | |
| | | |
| | |
| Weighted average shared used to compute net income per share attributable to Class A common stockholders - basic (in thousands) | |
| 19,075 | | |
| 15,433 | | |
| 18,420 | | |
| 15,141 | |
| Weighted average shared used to compute net income per share attributable to Class A common stockholders - diluted (in thousands) | |
| 35,765 | | |
| 19,662 | | |
| 35,362 | | |
| 32,815 | |
CompoSecure, Inc.
Consolidated Statements of Cash Flows
(in thousands)
(unaudited)
| | |
Nine Months Ended September 30, | |
| | |
2023 | | |
2022 | |
| CASH FLOWS FROM OPERATING ACTIVITES: | |
| | | |
| | |
| Net income | |
$ | 81,496 | | |
$ | 109,459 | |
| Adjustments to reconcile net income to net cash provided by operating activities | |
| | | |
| | |
| Depreciation | |
| 6,249 | | |
| 6,577 | |
| Stock-based compensation expense | |
| 13,052 | | |
| 7,736 | |
| Amortization of deferred finance costs | |
| 1,262 | | |
| 1,798 | |
| Change in fair value of earnout consideration liability | |
| (10,540 | ) | |
| (21,676 | ) |
| Revaluation of warrant liability | |
| (1,771 | ) | |
| (16,363 | ) |
| Change in fair value of derivative liability | |
| 364 | | |
| (185 | ) |
| Deferred tax (benefit) expense | |
| (1,485 | ) | |
| 3,191 | |
| Changes in assets and liabilities | |
| | | |
| | |
| Accounts receivable | |
| (11,261 | ) | |
| (17,871 | ) |
| Inventories | |
| (9,614 | ) | |
| (13,322 | ) |
| Prepaid expenses and other assets | |
| (87 | ) | |
| (225 | ) |
| Accounts payable | |
| 6,938 | | |
| 5,568 | |
| Deposits and other assets | |
| - | | |
| (14 | ) |
| Accrued expenses | |
| 4,065 | | |
| 1,403 | |
| Other liabilities | |
| (789 | ) | |
| 15,885 | |
| Net cash provided by operating activities | |
| 77,879 | | |
| 81,961 | |
| CASH FLOWS FROM INVESTING ACTIVITIES: | |
| | | |
| | |
| Acquisition of property and equipment | |
| (6,669 | ) | |
| (7,221 | ) |
| Net cash used in investing activities | |
| (6,669 | ) | |
| (7,221 | ) |
| CASH FLOWS FROM FINANCING ACTIVITIES: | |
| | | |
| | |
| Proceeds from employee stock purchase plan and exercise of equity awards | |
| 1,024 | | |
| 2 | |
| Payments for taxes related to net share settlement of equity awards | |
| (3,126 | ) | |
| - | |
| Payment of line of credit | |
| - | | |
| (5,000 | ) |
| Payment of Tax receivable agreement liability | |
| (2,193 | ) | |
| - | |
| Deferred finance costs related to debt modification | |
| (256 | ) | |
| - | |
| Payment of term loan | |
| (18,122 | ) | |
| (16,878 | ) |
| Distributions | |
| (38,362 | ) | |
| (35,545 | ) |
| Payment of issuance cost related to business combination | |
| - | | |
| (23,833 | ) |
| Net cash used in financing activities | |
| (61,035 | ) | |
| (81,254 | ) |
| Net increase (decrease) in cash and cash equivalents | |
| 10,175 | | |
| (6,514 | ) |
| Cash and cash equivalents, beginning of period | |
| 13,642 | | |
| 21,944 | |
| Cash and cash equivalents, end of period | |
$ | 23,817 | | |
$ | 15,430 | |
| | |
| | | |
| | |
| Supplementary disclosure of cash flow information | |
| | | |
| | |
| Cash paid for interest expense | |
$ | 18,296 | | |
$ | 14,937 | |
| Supplemental disclosure of non-cash financing activity: | |
| | | |
| | |
| Derivative asset - interest rate swap | |
$ | 8,055 | | |
$ | 9,392 | |
CompoSecure,
Inc.
Non-GAAP
Adjusted EBITDA Reconciliation
(in
thousands)
(unaudited)
| | |
Three Months Ended September 30, | | |
Nine Months Ended September 30, | |
| | |
2023 | | |
2022 | | |
2023 | | |
2022 | |
| | |
| | |
| | |
| | |
| |
| Net income | |
$ | 38,049 | | |
$ | 21,894 | | |
$ | 81,496 | | |
$ | 109,459 | |
| Add: | |
| | | |
| | | |
| | | |
| | |
| Depreciation | |
| 2,078 | | |
| 2,010 | | |
| 6,249 | | |
| 6,577 | |
| Interest expense, net (1) | |
| 6,010 | | |
| 5,850 | | |
| 18,355 | | |
| 16,362 | |
| Income tax expense (benefit) | |
| 949 | | |
| 393 | | |
| 656 | | |
| 3,738 | |
| EBITDA | |
$ | 47,086 | | |
$ | 30,147 | | |
$ | 106,756 | | |
$ | 136,136 | |
| Stock-based compensation | |
| 4,637 | | |
| 3,715 | | |
| 13,052 | | |
| 7,736 | |
| Mark to market adjustments (2) | |
| (16,207 | ) | |
| (1,204 | ) | |
| (11,947 | ) | |
| (38,224 | ) |
| Adjusted EBITDA | |
$ | 35,516 | | |
$ | 32,658 | | |
$ | 107,861 | | |
$ | 105,648 | |
(1) Includes amortization
of deferred financing cost for the three and nine months ended September 30, 2023 and 2022, respectively.
(2) Includes the changes in fair value of warrant liability, derivative liabilities and earnout consideration liability for the three and nine months ended September 30, 2023 and 2022, respectively
CompoSecure, Inc.
Non-GAAP Adjusted EPS Reconciliation
(in thousands)
(unaudited)
| | |
Three Months Ended September 30, | | |
Nine Months Ended September 30, | |
| | |
2023 | | |
2022 | | |
2023 | | |
2022 | |
| | |
| | |
| | |
| | |
| |
| | |
(in thousands) except per share amounts | |
| Basic and Diluted: | |
| | | |
| | | |
| | | |
| | |
| Net income | |
$ | 38,049 | | |
$ | 21,894 | | |
$ | 81,496 | | |
$ | 109,459 | |
| Add: provision for income taxes | |
| 949 | | |
| 393 | | |
| 656 | | |
| 3,738 | |
| Income before Income taxes | |
| 38,998 | | |
| 22,287 | | |
| 82,152 | | |
| 113,197 | |
| Income tax expense (1) | |
| (5,868 | ) | |
| (5,266 | ) | |
| (17,639 | ) | |
| (17,432 | ) |
| Adjusted net income before adjustments | |
| 33,130 | | |
| 17,021 | | |
| 64,513 | | |
| 95,765 | |
| (Less): mark-to-market adjustments (2) | |
| (16,058 | ) | |
| (957 | ) | |
| (12,311 | ) | |
| (38,040 | ) |
| Add: stock-based compensation | |
| 4,637 | | |
| 3,715 | | |
| 13,052 | | |
| 7,736 | |
| Adjusted net income | |
$ | 21,709 | | |
$ | 19,779 | | |
$ | 65,254 | | |
$ | 65,461 | |
| Common shares outstanding used in computing earnings per
share, basic: | |
| | | |
| | | |
| | | |
| | |
| Class A and Class B common shares (3) | |
| 79,033 | | |
| 76,020 | | |
| 78,378 | | |
| 75,728 | |
| Common shares outstanding used in computing earnings per share, diluted: | |
| | | |
| | | |
| | | |
| | |
| Warrants (Public and Private) (4) | |
| 8,094 | | |
| 8,094 | | |
| 8,094 | | |
| 8,094 | |
| Equity awards | |
| 3,690 | | |
| 4,229 | | |
| 3,942 | | |
| 4,674 | |
| Total Shares outstanding used in computing adjusted earnings per
share - diluted | |
| 90,817 | | |
| 88,343 | | |
| 90,414 | | |
| 88,496 | |
| | |
| | | |
| | | |
| | | |
| | |
| Adjusted net income per share- basic | |
$ | 0.27 | | |
$ | 0.26 | | |
$ | 0.83 | | |
$ | 0.86 | |
| Adjusted net income per share- diluted | |
$ | 0.24 | | |
$ | 0.22 | | |
$ | 0.72 | | |
$ | 0.74 | |
1) Calculated
using the Company's blended tax rate.
2) Includes the
changes in fair value of warrant liability and earnout consideration liability.
3) Assumes both
Class A shares and Class B shares participate in earnings and are outstanding at the end of the period.
4) Assumes treasury
stock method, valuation at assumed fair market value of $18.00.
5) The Company did not include the effect of Exchangeable Notes to its total shares outstanding used in diluted adjusted net income per share.
Exhibit 99.2

| Q3 2023
Earnings Presentation
November 9, 2023 |
| 2 Disclaimers
Forward Looking Statements
This presentation contains forward-looking statements as defined by the Private Securities Litigation Reform Act of 1995. These statements are based on the beliefs and assumptions of management.
Although the Company believes that its plans, intentions, and expectations reflected in or suggested by these forward-looking statements are reasonable, the Company cannot assure you that it will
achieve or realize these plans, intentions, or expectations. Forward-looking statements are inherently subject to risks, uncertainties, and assumptions. Generally, statements that are not historical
facts, including statements concerning the Company’s possible or assumed future actions, business strategies, events, or results of operations, are forward-looking statements. In some instances,
these statements may be preceded by, followed by or include the words “believes,” “estimates,” “expects,” “projects,” “forecasts,” “may,” “will,” “should,” “seeks,” “plans,” “scheduled,” “anticipates” or
“intends” or the negatives of these terms or variations of them or similar terminology. Forward-looking statements are not guarantees of performance. You should not put undue reliance on these
statements which speak only as of the date hereof. You should understand that the following important factors, among others, could affect the Company’s future results and could cause those results
or other outcomes to differ materially from those expressed or implied in the Company’s forward-looking statements: the ability of the Company to grow and manage growth profitably, maintain
relationships with customers, compete within its industry and retain its key employees; the possibility that the Company may be adversely impacted by global economic, business, competitive and/or
other factors; the outcome of any legal proceedings that may be instituted against the Company or others; future exchange and interest rates; and other risks and uncertainties indicated in this
report, including those under “Risk Factors” in filings that have been made or will be made with the SEC. The Company undertakes no obligations to update or revise publicly any forward-looking
statements, whether as a result of new information, future events or otherwise, except as required by law.
Non-GAAP Financial Measures
This presentation includes certain non-GAAP financial measures that are not prepared in accordance with accounting principles generally accepted in the United States (“GAAP”) and that may be
different from non-GAAP financial measures used by other companies. The Company believes EBITDA, Adjusted EBITDA, Adjusted Net Income and Adjusted EPS are useful to investors in evaluating
the Company’s financial performance. The Company uses these measures internally to establish forecasts, budgets and operational goals to manage and monitor its business, as well as evaluate its
underlying historical performance and to measure incentive compensation, as we believe that these non-GAAP financial measures depict the true performance of the business by encompassing only
relevant and controllable events, enabling the Company to evaluate and plan more effectively for the future. Due to the forward-looking nature of the financial guidance included below, specific
quantification of the charges excluded from the non-GAAP financial measures included in such financial guidance, including with respect to depreciation, amortization, interest, and taxes, that would
be required to reconcile the non GAAP financial measures included in such financial guidance to GAAP measures are not available, so it is not feasible to provide accurate forecasted non-GAAP
reconciliations without unreasonable effort. Consequently, no disclosure of estimated comparable GAAP measures is included, and no reconciliation of the forward-looking non-GAAP financial
measures is included. In addition, the Company’s debt agreements contain covenants that use a variation of these measures for purposes of determining debt covenant compliance. The Company
believes that investors should have access to the same set of tools that its management uses in analyzing operating results. EBITDA, Adjusted EBITDA, Adjusted Net Income and Adjusted EPS should
not be considered as measures of financial performance under U.S. GAAP, and the items excluded from EBITDA, Adjusted EBITDA, Adjusted Net Income and Adjusted EPS are significant components
in understanding and assessing the Company’s financial performance. Accordingly, these key business metrics have limitations as an analytical tool. They should not be considered as an alternative to
net income or any other performance measures derived in accordance with U.S. GAAP or as an alternative to cash flows from operating activities as a measure of the Company’s liquidity and may be
different from similarly titled non-GAAP measures used by other companies. Please refer to the tables below for the reconciliation of net income to EBITDA, Adjusted EBITDA, Adjusted Net Income and
Adjusted EPS.
Industry and Market Information
Statements in this presentation concerning our industry and the markets in which we operate, including our general expectations and competitive position, business opportunity and market size,
growth and share, are based on information from independent industry organizations and other third-party sources, data from our internal research and management estimates. Management
estimates are derived from publicly available information and the information and data referred to above and are based on assumptions and calculations made by us based upon our interpretation of
such information and data. The information and data referred to above are imprecise and may prove to be inaccurate because the information cannot always be verified with complete certainty due to
the limitations on the availability and reliability of raw data, the voluntary nature of the data gathering process and other limitations and uncertainties. As a result, please be aware that the data and
statistical information in this presentation may differ from information provided by our competitors or from information found in current or future studies conducted by market research institutes,
consultancy firms or independent sources. |
| Summary
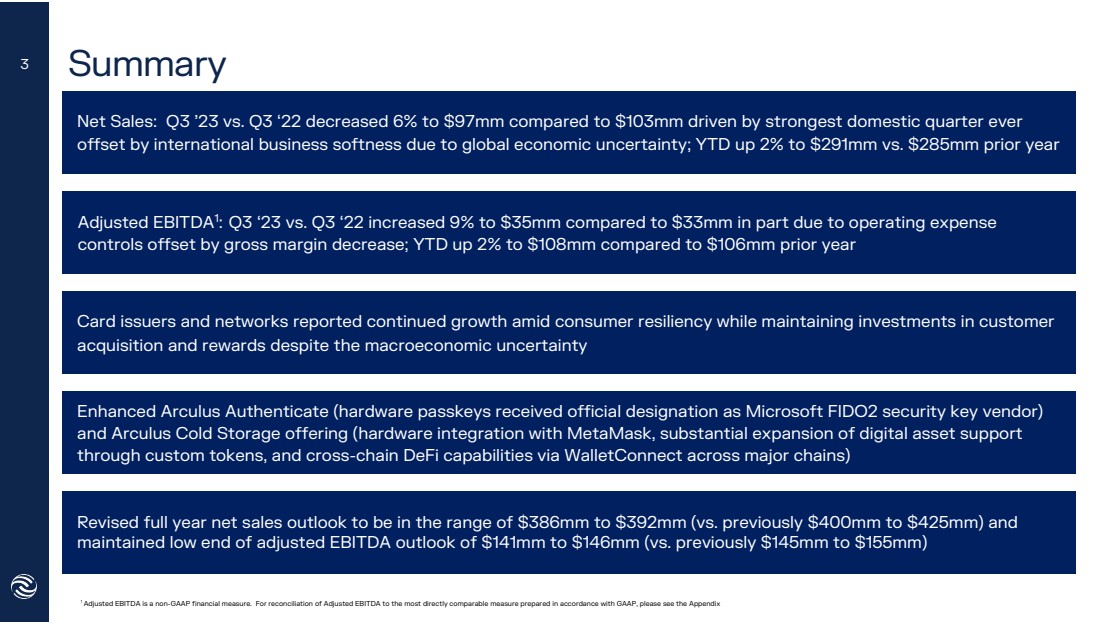
Enhanced Arculus Authenticate (hardware passkeys received official designation as Microsoft FIDO2 security key vendor)
and Arculus Cold Storage offering (hardware integration with MetaMask, substantial expansion of digital asset support
through custom tokens, and cross-chain DeFi capabilities via WalletConnect across major chains)
Revised full year net sales outlook to be in the range of $386mm to $392mm (vs. previously $400mm to $425mm) and
maintained low end of adjusted EBITDA outlook of $141mm to $146mm (vs. previously $145mm to $155mm)
Card issuers and networks reported continued growth amid consumer resiliency while maintaining investments in customer
acquisition and rewards despite the macroeconomic uncertainty
Net Sales: Q3 ’23 vs. Q3 ‘22 decreased 6% to $97mm compared to $103mm driven by strongest domestic quarter ever
offset by international business softness due to global economic uncertainty; YTD up 2% to $291mm vs. $285mm prior year
1 Adjusted EBITDA is a non-GAAP financial measure. For reconciliation of Adjusted EBITDA to the most directly comparable measure prepared in accordance with GAAP, please see the Appendix
3
Adjusted EBITDA1
:
Q3 ‘23 vs. Q3 ‘22 increased 9% to $35mm compared to $33mm in part due to operating expense
controls offset by gross margin decrease; YTD up 2% to $108mm compared to $106mm prior year |

| 4 Key Highlights
Payment Card
Ø Record quarterly domestic net sales in Company’s history
Ø New metal card programs
• American Express Hilton Aspire
• American Express SAS Elite
• Axis Magnus
Ø Continued progress across new product innovations – Lux Glass, Dynamic EVC, Biometrics, and LED
Industry Conferences
Ø Strong presence at Finovate Fall (September in New York) and Money 20/20 USA (October in Las Vegas)
Ø Planning to attend Singapore FinTech Festival in November – Company’s first Asia-Pacific event |
| 5 Key Highlights
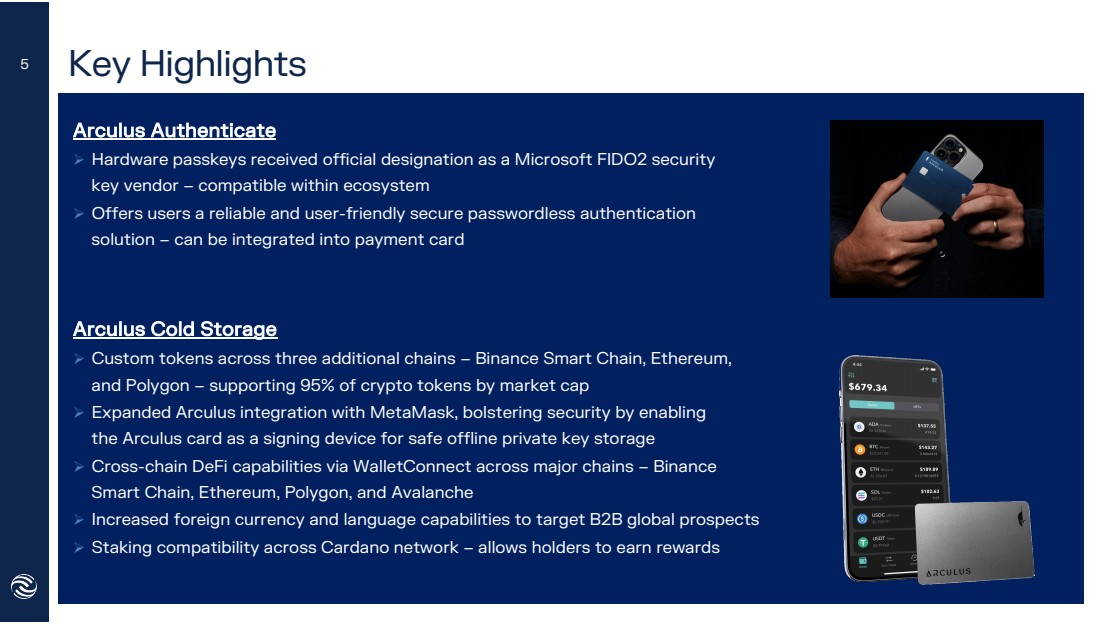
Arculus Authenticate
Ø Hardware passkeys received official designation as a Microsoft FIDO2 security
key vendor – compatible within ecosystem
Ø Offers users a reliable and user-friendly secure passwordless authentication
solution – can be integrated into payment card
Arculus Cold Storage
Ø Custom tokens across three additional chains – Binance Smart Chain, Ethereum,
and Polygon – supporting 95% of crypto tokens by market cap
Ø Expanded Arculus integration with MetaMask, bolstering security by enabling
the Arculus card as a signing device for safe offline private key storage
Ø Cross-chain DeFi capabilities via WalletConnect across major chains – Binance
Smart Chain, Ethereum, Polygon, and Avalanche
Ø Increased foreign currency and language capabilities to target B2B global prospects
Ø Staking compatibility across Cardano network – allows holders to earn rewards |
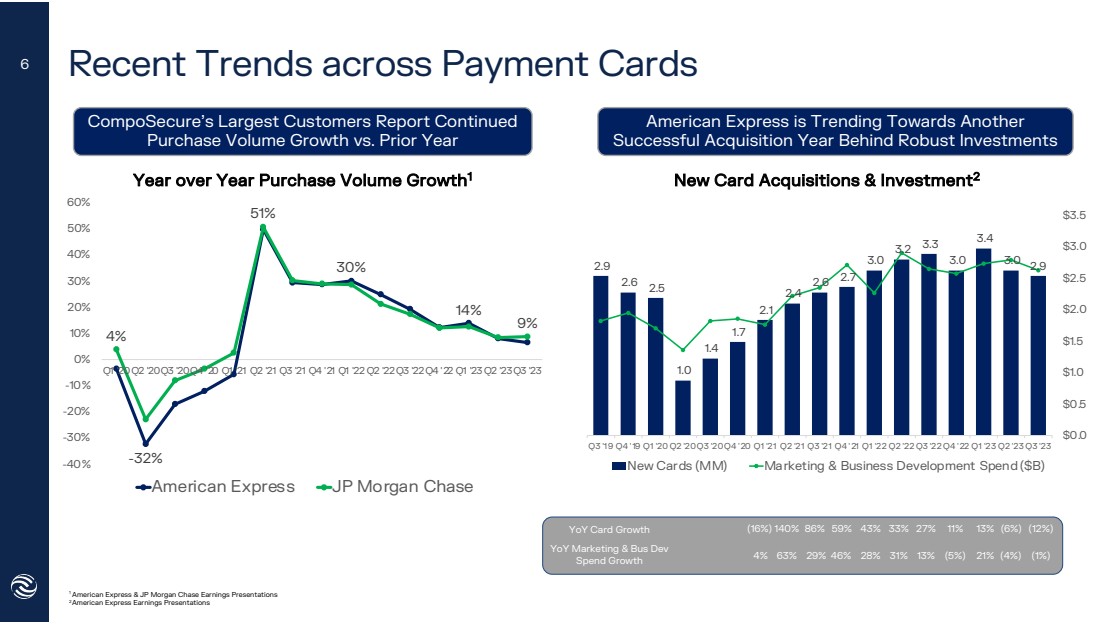
| -32%
30%
14%
4%
51%
9%
-40%
-30%
-20%
-10%
0%
10%
20%
30%
40%
50%
60%
Q1 '20Q2 '20Q3 '20Q4 '20 Q1 '21 Q2 '21 Q3 '21 Q4 '21 Q1 '22 Q2 '22Q3 '22Q4 '22 Q1 '23 Q2 '23Q3 '23
American Express JP Morgan Chase
Recent Trends across Payment Cards
1 American Express & JP Morgan Chase Earnings Presentations
2American Express Earnings Presentations
CompoSecure’s Largest Customers Report Continued
Purchase Volume Growth vs. Prior Year
Year over Year Purchase Volume Growth1
6
American Express is Trending Towards Another
Successful Acquisition Year Behind Robust Investments
YoY Card Growth
4% 63% 29% 46% 28% YoY Marketing & Bus Dev
Spend Growth
(16%) 140% 86% 59% 43%
31%
33%
13%
27%
(5%)
11%
21%
13%
New Card Acquisitions & Investment2
2.9
2.6 2.5
1.0
1.4
1.7
2.1
2.4
2.6 2.7
3.0
3.2 3.3
3.0
3.4
3.0 2.9
-
0.5
1.0
1.5
2.0
2.5
3.0
3.5
4.0
Q3 '19 Q4 '19 Q1 '20 Q2 '20Q3 '20Q4 '20 Q1 '21 Q2 '21 Q3 '21 Q4 '21 Q1 '22 Q2 '22 Q3 '22 Q4 '22 Q1 '23 Q2 '23 Q3 '23
$0.0
$0.5
$1.0
$1.5
$2.0
$2.5
$3.0
$3.5
New Cards (MM) Marketing & Business Development Spend ($B)
(4%)
(6%)
(1%)
(12%) |

| Card Issuer and Payment Network Sentiment
Source: Q3 ‘23 Earnings Transcripts
“We feel really good about the quality of our new card acquisitions, which I
talked about earlier, and I continue to see great demand for our products
across a wide range of attractive investment opportunities.
Given this strong set of opportunities, I would expect to increase our
marketing spend in the balance of this year, and we're confident that our
sophisticated acquisition engine will continue to do so in an efficient way.
We've invested approximately $5.5 billion this year. We'll probably step that
up next year. So, we're very confident in our card acquisition.” – Steve Squeri
(Chairman & CEO)
7
“We continue to see attractive growth opportunities in our Domestic Card
business. Our opportunities are enhanced by our technology transformation.
And our marketing continues to deliver strong new account growth across
the domestic card business. As a result, we are leaning into marketing to
drive resilient growth and enhance our domestic card franchise.
As always, we're keeping a close eye on competitor actions and potential
marketplace risks. We expect fourth quarter marketing will be seasonally
higher.” – Richard Fairbank (Chairman & CEO)
“On a macroeconomic front, there are a few factors we focus on.
First, the labor market remains strong, which is a key driver of
consumer spending. However, we continue to monitor aspects such
as credit availability and savings behaviors. Second, although
inflation levels have moderated, they remain elevated.
As central banks continue to actively manage monetary policy, we
expect the impacts to vary across countries and sectors. Also,
geopolitical uncertainty remains a concern, further underscored by
the recent events in the Middle East. We are monitoring these
moving pieces and stand ready to manage the business accordingly.”
– Michael Miebach (CEO) |

| Financial
Overview |
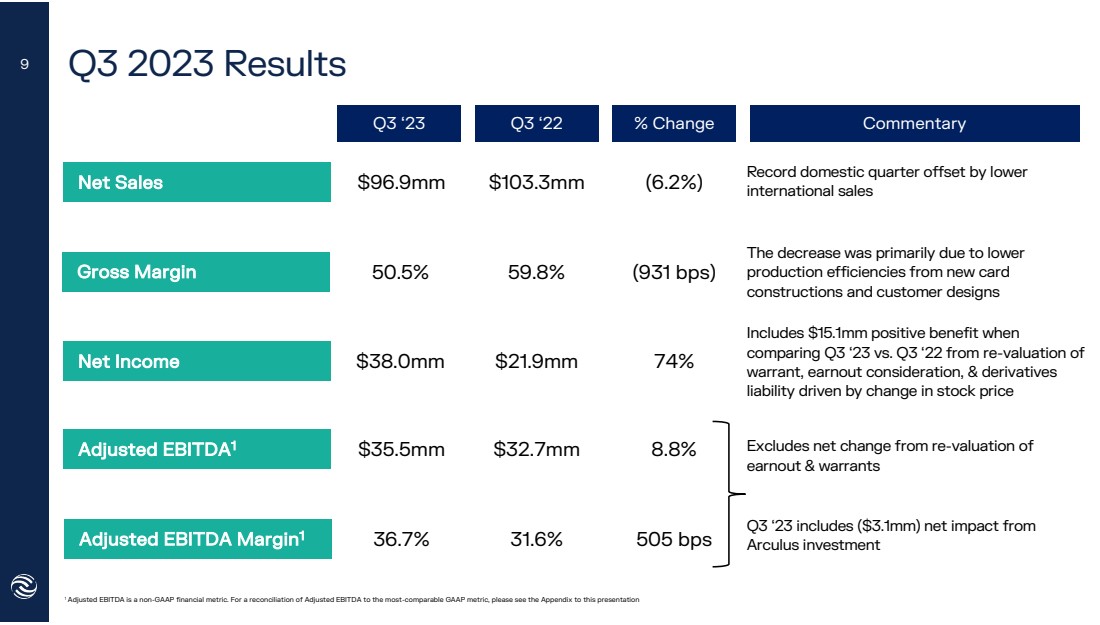
| Q3 2023 Results
$35.5mm
Q3 ‘23 Q2 YTD
‘22
Net Sales $96.9mm
36.7%
$38.0mm
50.5%
$103.3mm
$21.9mm
59.8%
$32.7mm
31.6%
(6.2%) Record domestic quarter offset by lower
international sales
74%
(931 bps)
8.8%
505 bps
Net Income
Gross Margin
Adjusted EBITDA1
Adjusted EBITDA Margin1
Q3 ‘22 % Change Commentary
1 Adjusted EBITDA is a non-GAAP financial metric. For a reconciliation of Adjusted EBITDA to the most-comparable GAAP metric, please see the Appendix to this presentation
The decrease was primarily due to lower
production efficiencies from new card
constructions and customer designs
Includes $15.1mm positive benefit when
comparing Q3 ‘23 vs. Q3 ‘22 from re-valuation of
warrant, earnout consideration, & derivatives
liability driven by change in stock price
Excludes net change from re-valuation of
earnout & warrants
Q3 ‘23 includes ($3.1mm) net impact from
Arculus investment
9 |
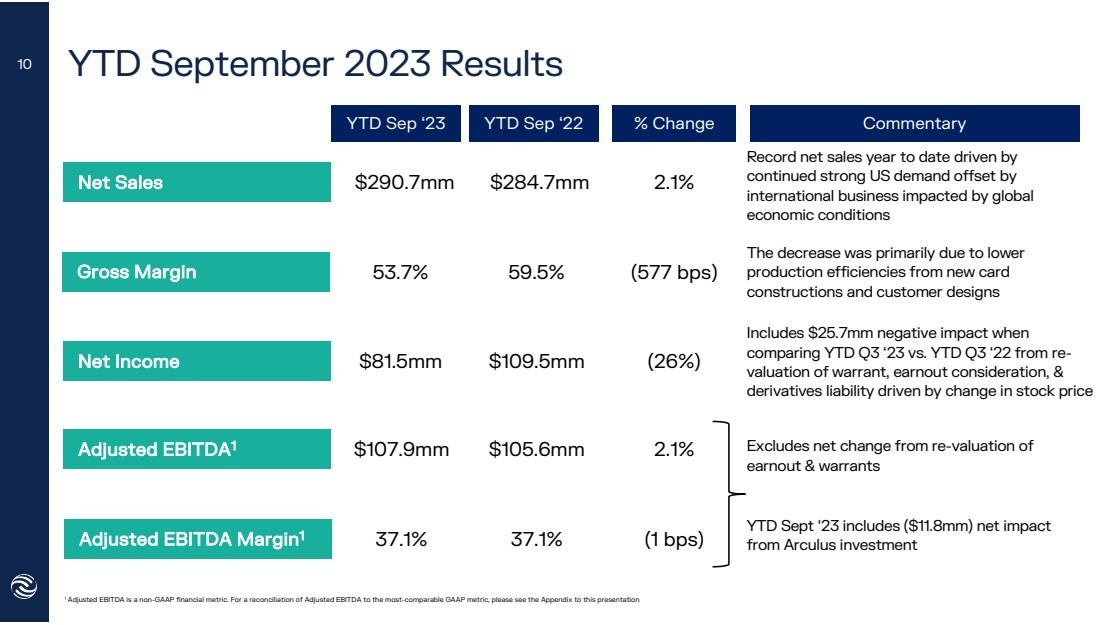
| YTD September 2023 Results
$107.9mm
YTD Sep ‘23 Q2 YTD
‘22
Net Sales $290.7mm
37.1%
$81.5mm
53.7%
$284.7mm
$109.5mm
59.5%
$105.6mm
37.1%
2.1%
Record net sales year to date driven by
continued strong US demand offset by
international business impacted by global
economic conditions
(26%)
(577 bps)
2.1%
(1 bps)
Net Income
Gross Margin
Adjusted EBITDA1
Adjusted EBITDA Margin1
YTD Sep ‘22 % Change Commentary
1 Adjusted EBITDA is a non-GAAP financial metric. For a reconciliation of Adjusted EBITDA to the most-comparable GAAP metric, please see the Appendix to this presentation
Excludes net change from re-valuation of
earnout & warrants
YTD Sept ‘23 includes ($11.8mm) net impact
from Arculus investment
10
The decrease was primarily due to lower
production efficiencies from new card
constructions and customer designs
Includes $25.7mm negative impact when
comparing YTD Q3 ‘23 vs. YTD Q3 ‘22 from re-valuation of warrant, earnout consideration, &
derivatives liability driven by change in stock price |
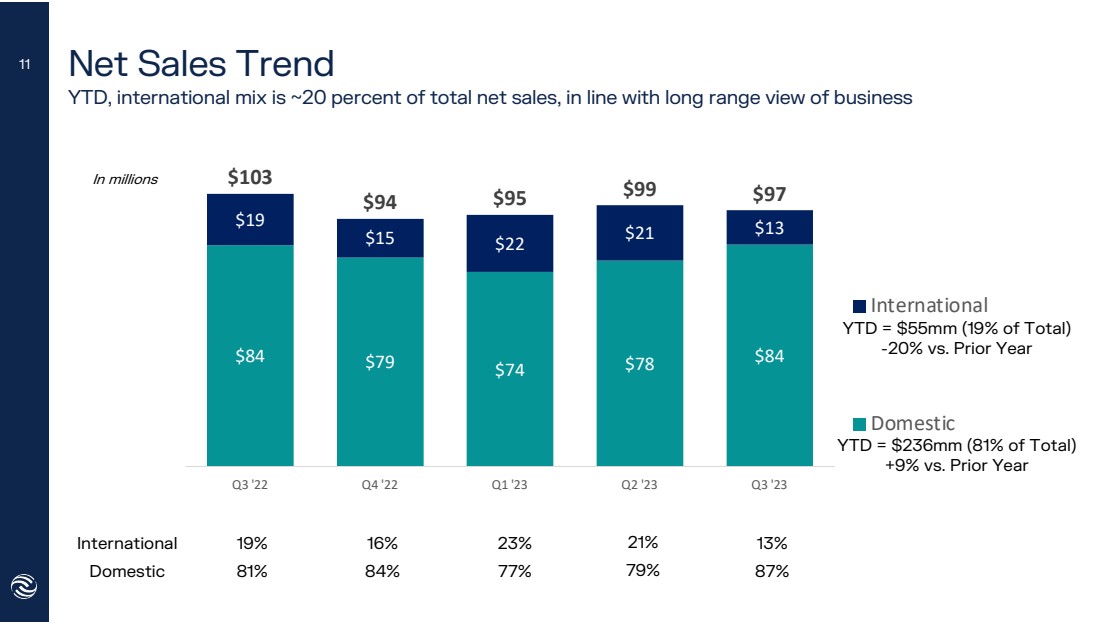
| $84 $79 $74 $78 $84
$19
$15 $22 $21 $13
$103
$94 $95 $99 $97
Q3 '22 Q4 '22 Q1 '23 Q2 '23 Q3 '23
International
Domestic
Net Sales Trend
YTD, international mix is ~20 percent of total net sales, in line with long range view of business
In millions
International
Domestic
13%
87%
21
%
79
%
19%
81%
16%
84%
11
23
%
77
%
YTD = $55mm (19% of Total) -20% vs. Prior Year
YTD = $236mm (81% of Total)
+9% vs. Prior Year |
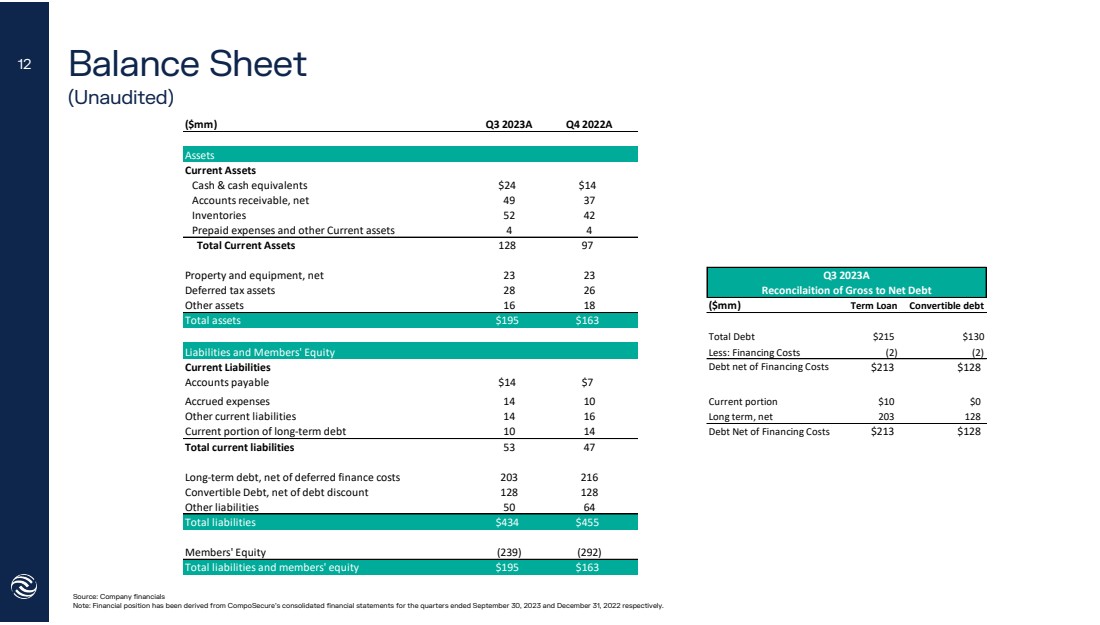
| Balance Sheet
(Unaudited)
Source: Company financials
Note: Financial position has been derived from CompoSecure’s consolidated financial statements for the quarters ended September 30, 2023 and December 31, 2022 respectively.
12
($mm) Q3 2023A Q4 2022A
Assets
Current Assets
Cash & cash equivalents $24 $14
Accounts receivable, net 49 37
Inventories 52 42
Prepaid expenses and other Current assets 4 4
Total Current Assets 128 97
Property and equipment, net 23 23
Deferred tax assets 28 26
Other assets 16 18 ($mm) Term Loan Convertible debt
Total assets $195 $163
Total Debt $215 $130
Liabilities and Members' Equity Less: Financing Costs (2) (2)
Current Liabilities Debt net of Financing Costs $213 $128
Accounts payable $14 $7
Accrued expenses 14 10 Current portion $10 $0
Other current liabilities 14 16 Long term, net 203 128
Current portion of long-term debt 10 14 Debt Net of Financing Costs $213 $128
Total current liabilities 53 47
Long-term debt, net of deferred finance costs 203 216
Convertible Debt, net of debt discount 128 128
Other liabilities 50 64
Total liabilities $434 $455
Members' Equity (239) (292)
Total liabilities and members' equity $195 $163
Q3 2023A
Reconcilaition of Gross to Net Debt |
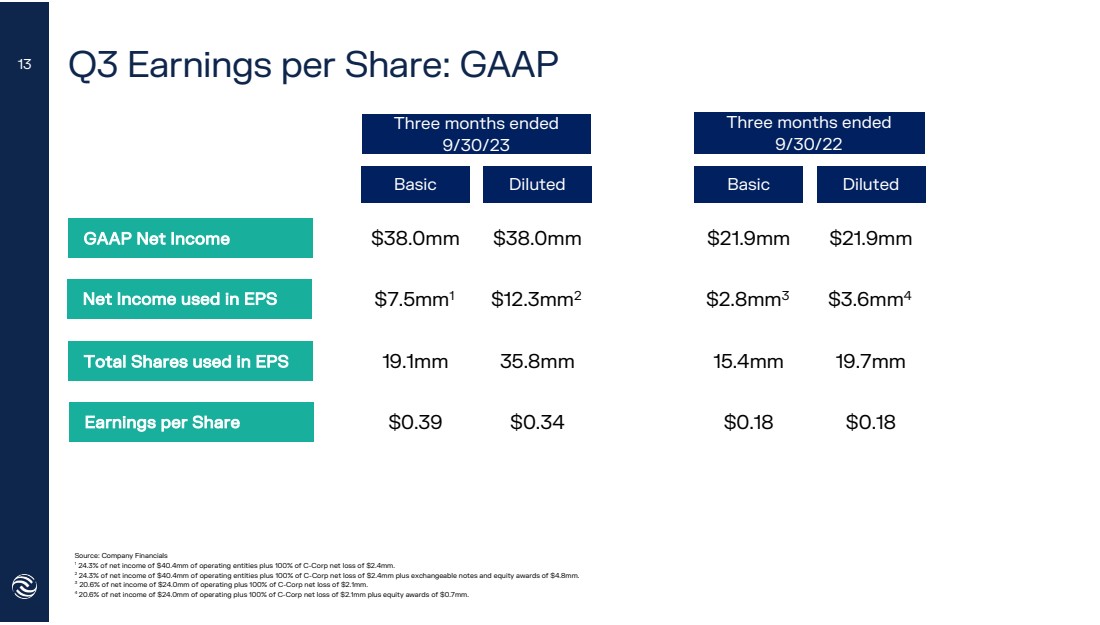
| Q3 Earnings per Share: GAAP
19.1mm
Basic
Q2 YTD
‘22
GAAP Net Income $38.0mm
$0.39
$7.5mm1
Three months ended
9/30/23
Three months ended
9/30/22
$38.0mm
$12.3mm2
35.8mm
$0.34
$21.9mm $21.9mm
$2.8mm3 $3.6mm4
15.4mm 19.7mm
$0.18 $0.18
Net Income used in EPS
Total Shares used in EPS
Earnings per Share
Diluted Basic Diluted
Source: Company Financials
1 24.3% of net income of $40.4mm of operating entities plus 100% of C-Corp net loss of $2.4mm.
2 24.3% of net income of $40.4mm of operating entities plus 100% of C-Corp net loss of $2.4mm plus exchangeable notes and equity awards of $4.8mm. 3 20.6% of net income of $24.0mm of operating plus 100% of C-Corp net loss of $2.1mm.
4 20.6% of net income of $24.0mm of operating plus 100% of C-Corp net loss of $2.1mm plus equity awards of $0.7mm.
13 |

| YTD Earnings per Share: GAAP
18.4mm
Basic
Q2 YTD
‘22
GAAP Net Income $81.5mm
$0.86
$15.8mm1
Nine months ended
9/30/23
Nine months ended
9/30/22
$81.5mm
$26.5mm2
35.4mm
$0.75
$109.5mm $109.5mm
$15.5mm3 $30.9mm4
15.1mm 32.8mm
$1.02 $0.94
Net Income used in EPS
Total Shares used in EPS
Earnings per Share
Diluted Basic Diluted
Source: Company Financials
1 24.3% of net income of $86.8mm of operating plus 100% of C-Corp net loss of $5.3mm.
2 24.3% of net income of $86.8mm of operating plus 100% of C-Corp net loss of $5.3mm plus exchangeable notes and equity awards of $10.7mm. 3 20.6% of net income of $118.4mm of operating plus 100% of C-Corp net loss of $9.0mm.
4 20.6% of net income of $118.4mm of operating plus 100% of C-Corp net loss of $9.0mm plus exchangeable notes and equity awards of $15.4mm.
14 |
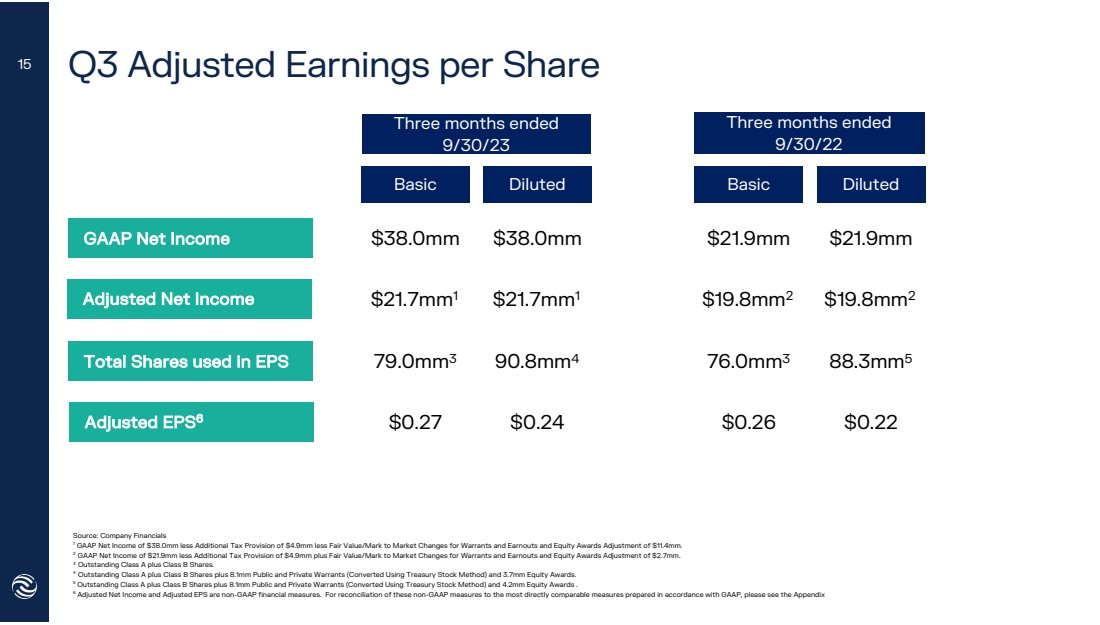
| Q3 Adjusted Earnings per Share
Source: Company Financials
1 GAAP Net Income of $38.0mm less Additional Tax Provision of $4.9mm less Fair Value/Mark to Market Changes for Warrants and Earnouts and Equity Awards Adjustment of $11.4mm.
2 GAAP Net Income of $21.9mm less Additional Tax Provision of $4.9mm plus Fair Value/Mark to Market Changes for Warrants and Earnouts and Equity Awards Adjustment of $2.7mm.
3 Outstanding Class A plus Class B Shares.
4 Outstanding Class A plus Class B Shares plus 8.1mm Public and Private Warrants (Converted Using Treasury Stock Method) and 3.7mm Equity Awards.
5 Outstanding Class A plus Class B Shares plus 8.1mm Public and Private Warrants (Converted Using Treasury Stock Method) and 4.2mm Equity Awards .
6 Adjusted Net Income and Adjusted EPS are non-GAAP financial measures. For reconciliation of these non-GAAP measures to the most directly comparable measures prepared in accordance with GAAP, please see the Appendix
79.0mm3
Basic
Q2 YTD
‘22
GAAP Net Income $38.0mm
$0.27
$21.7mm1
Three months ended
9/30/23
Three months ended
9/30/22
$38.0mm
$21.7mm1
90.8mm4
$0.24
$21.9mm $21.9mm
$19.8mm2 $19.8mm2
76.0mm3 88.3mm5
$0.26 $0.22
Adjusted Net Income
Total Shares used in EPS
Adjusted EPS6
Diluted Basic Diluted
15 |

| YTD Adjusted Earnings per Share
Source: Company Financials
1 GAAP Net Income of $81.5mm less Additional Tax Provision of $17.0mm plus Fair Value/Mark to Market Changes for Warrants and Earnouts and Equity Awards Adjustment of $0.7mm.
2 GAAP Net Income of $109.5mm less Additional Tax Provision of $13.7mm less Fair Value/Mark to Market Changes for Warrants and Earnouts and Equity Awards Adjustment of $30.3mm.
3 Outstanding Class A plus Class B Shares.
4 Outstanding Class A plus Class B Shares plus 8.1mm Public and Private Warrants (Converted Using Treasury Stock Method) and 3.9mm Equity Awards .
5 Outstanding Class A plus Class B Shares plus 8.1mm Public and Private Warrants (Converted Using Treasury Stock Method) and 4.7mm Equity Awards .
6 Adjusted Net Income and Adjusted EPS are non-GAAP financial measures. For reconciliation of these non-GAAP measures to the most directly comparable measures prepared in accordance with GAAP, please see the Appendix
78.4mm3
Basic
Q2 YTD
‘22
GAAP Net Income $81.5mm
$0.83
$65.3mm1
Nine months ended
9/30/23
Nine months ended
9/30/22
$81.5mm
$65.3mm1
90.4mm4
$0.72
$109.5mm $109.5mm
$65.5mm2 $65.5mm2
75.7mm3 88.5mm5
$0.86 $0.74
Adjusted Net Income
Total Shares used in EPS
Adjusted EPS6
Diluted Basic Diluted
16 |
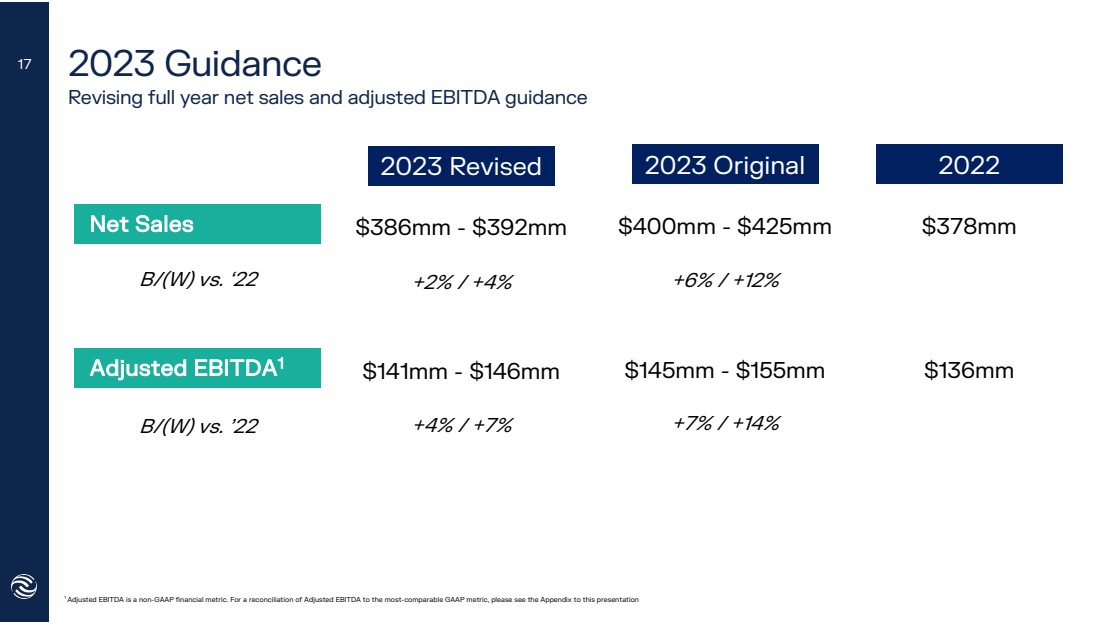
| 2023 Guidance
Revising full year net sales and adjusted EBITDA guidance
Net Sales
Adjusted EBITDA1
2022
$378mm
$136mm
1 Adjusted EBITDA is a non-GAAP financial metric. For a reconciliation of Adjusted EBITDA to the most-comparable GAAP metric, please see the Appendix to this presentation
$400mm - $425mm
$145mm - $155mm
2023 Original
B/(W) vs. ‘22 +6% / +12%
B/(W) vs. ’22 +7% / +14%
17
$386mm - $392mm
$141mm - $146mm
2023 Revised
+2% / +4%
+4% / +7% |
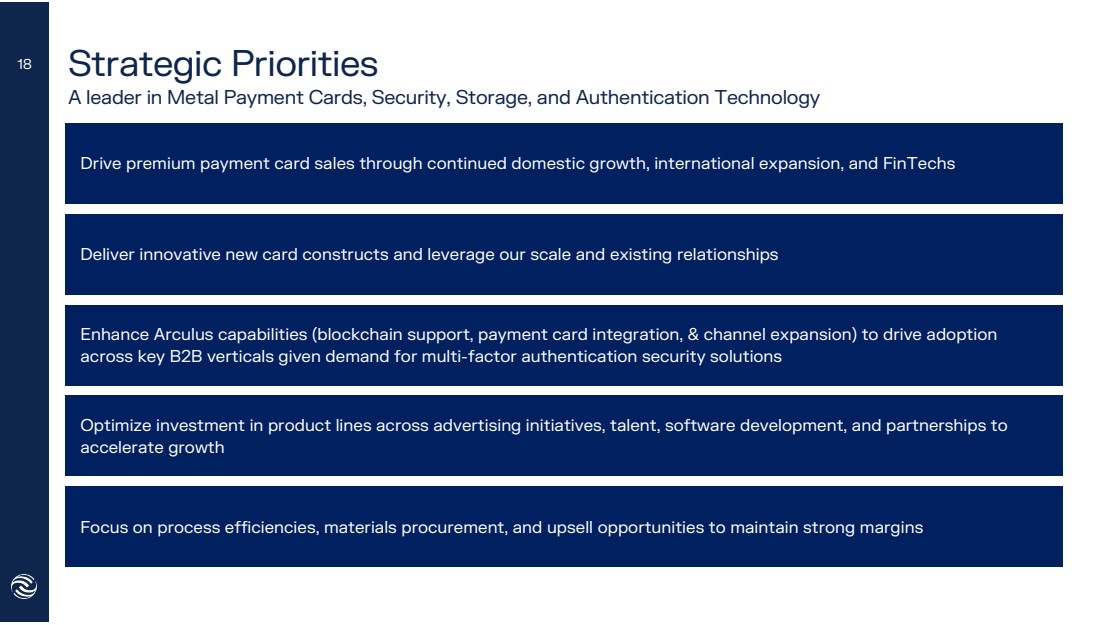
| Strategic Priorities
A leader in Metal Payment Cards, Security, Storage, and Authentication Technology
Drive premium payment card sales through continued domestic growth, international expansion, and FinTechs
Deliver innovative new card constructs and leverage our scale and existing relationships
Enhance Arculus capabilities (blockchain support, payment card integration, & channel expansion) to drive adoption
across key B2B verticals given demand for multi-factor authentication security solutions
Optimize investment in product lines across advertising initiatives, talent, software development, and partnerships to
accelerate growth
Focus on process efficiencies, materials procurement, and upsell opportunities to maintain strong margins
18 |

| Investor Relations Contact
ir.composecure.com
Sean Mansouri
720-330-2829
ir@composecure.com
19
19 |

| Appendix |
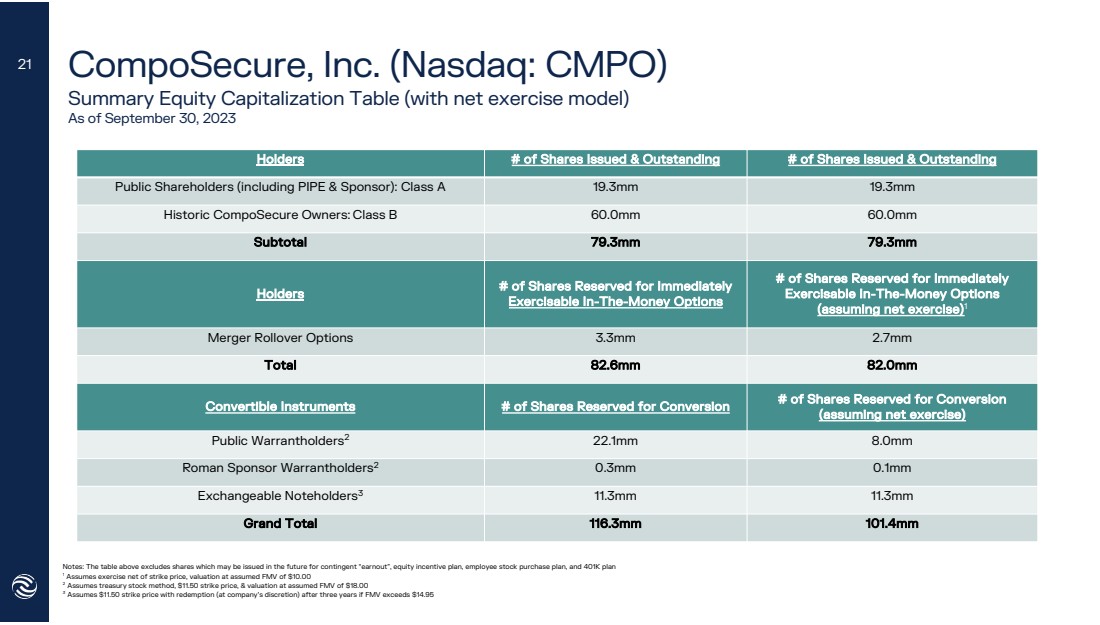
| CompoSecure, Inc. (Nasdaq: CMPO)
Summary Equity Capitalization Table (with net exercise model)
As of September 30, 2023
Holders # of Shares Issued & Outstanding # of Shares Issued & Outstanding
Public Shareholders (including PIPE & Sponsor): Class A 19.3mm 19.3mm
Historic CompoSecure Owners: Class B 60.0mm 60.0mm
Subtotal 79.3mm 79.3mm
Holders # of Shares Reserved for Immediately
Exercisable In-The-Money Options
# of Shares Reserved for Immediately
Exercisable In-The-Money Options
(assuming net exercise)1
Merger Rollover Options 3.3mm 2.7mm
Total 82.6mm 82.0mm
Convertible Instruments # of Shares Reserved for Conversion # of Shares Reserved for Conversion
(assuming net exercise)
Public Warrantholders2 22.1mm 8.0mm
Roman Sponsor Warrantholders2 0.3mm 0.1mm
Exchangeable Noteholders3 11.3mm 11.3mm
Grand Total 116.3mm 101.4mm
Notes: The table above excludes shares which may be issued in the future for contingent “earnout”, equity incentive plan, employee stock purchase plan, and 401K plan
1 Assumes exercise net of strike price, valuation at assumed FMV of $10.00
2 Assumes treasury stock method, $11.50 strike price, & valuation at assumed FMV of $18.00
3 Assumes $11.50 strike price with redemption (at company’s discretion) after three years if FMV exceeds $14.95
21 |
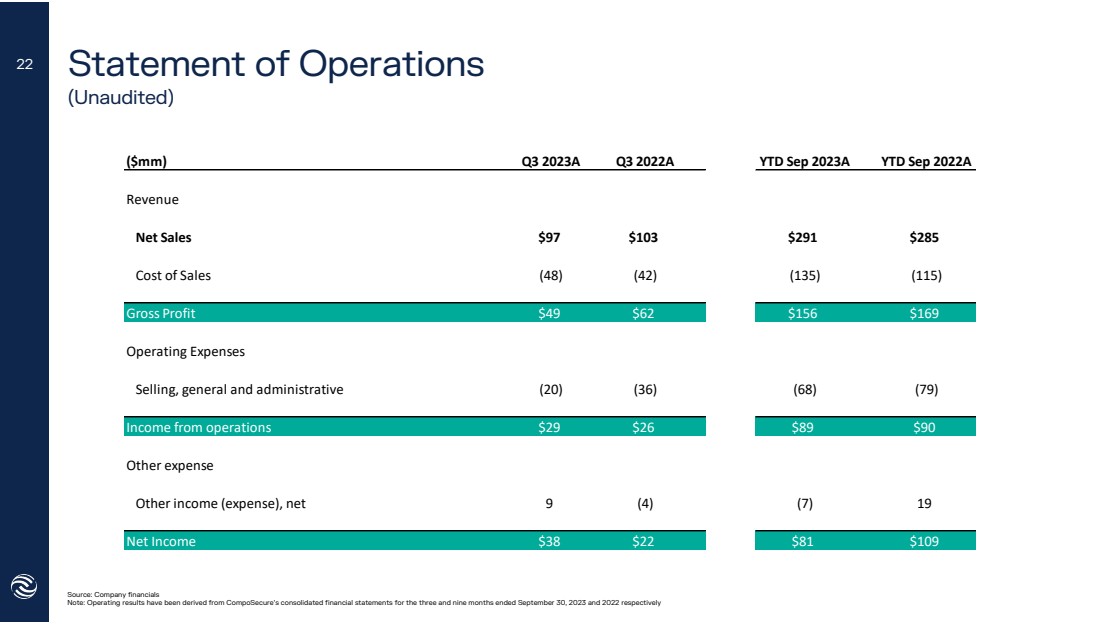
| Statement of Operations
(Unaudited)
Source: Company financials
Note: Operating results have been derived from CompoSecure’s consolidated financial statements for the three and nine months ended September 30, 2023 and 2022 respectively
22
($mm) Q3 2023A Q3 2022A YTD Sep 2023A YTD Sep 2022A
Revenue
Net Sales $97 $103 $291 $285
Cost of Sales (48) (42) (135) (115)
Gross Profit $49 $62 $156 $169
Operating Expenses
Selling, general and administrative (20) (36) (68) (79)
Income from operations $29 $26 $89 $90
Other expense
Other income (expense), net 9 (4) (7) 19
Net Income $38 $22 $81 $109 |
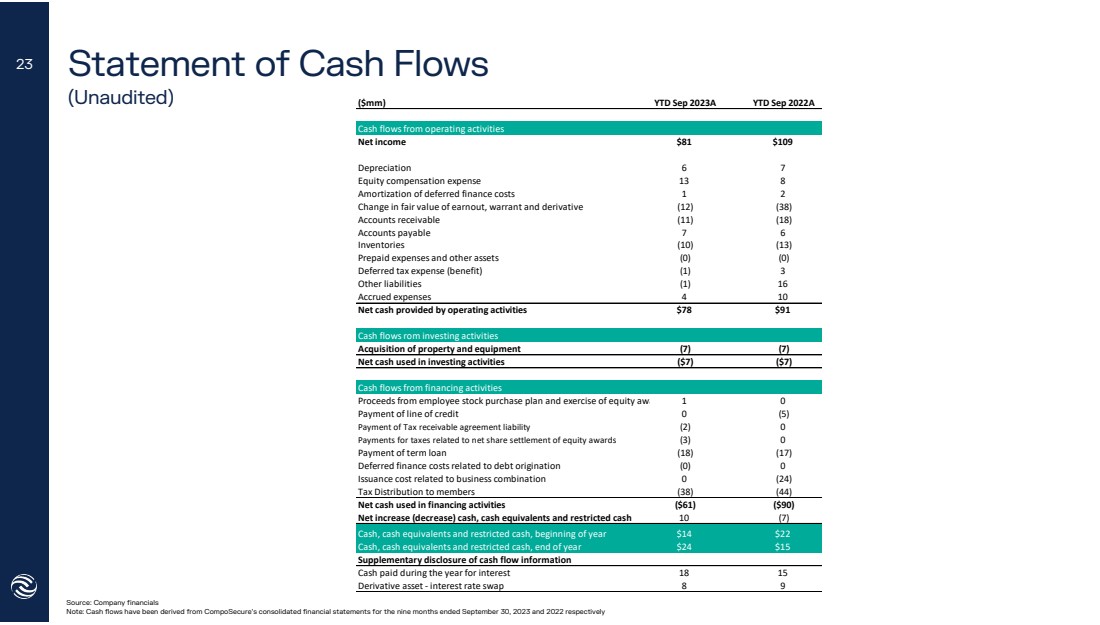
| Statement of Cash Flows
(Unaudited)
Source: Company financials
Note: Cash flows have been derived from CompoSecure’s consolidated financial statements for the nine months ended September 30, 2023 and 2022 respectively
23
($mm) YTD Sep 2023A YTD Sep 2022A
Cash flows from operating activities
Net income $81 $109
Depreciation 6 7
Equity compensation expense 13 8
Amortization of deferred finance costs 1 2
Change in fair value of earnout, warrant and derivative (12) (38)
Accounts receivable (11) (18)
Accounts payable 7 6
Inventories (10) (13)
Prepaid expenses and other assets (0) (0)
Deferred tax expense (benefit) (1) 3
Other liabilities (1) 16
Accrued expenses 4 10
Net cash provided by operating activities $78 $91
Cash flows rom investing activities
Acquisition of property and equipment (7) (7)
Net cash used in investing activities ($7) ($7)
Cash flows from financing activities
Proceeds from employee stock purchase plan and exercise of equity awards 1 0
Payment of line of credit 0 (5)
Payment of Tax receivable agreement liability (2) 0
Payments for taxes related to net share settlement of equity awards (3) 0
Payment of term loan (18) (17)
Deferred finance costs related to debt origination (0) 0
Issuance cost related to business combination 0 (24)
Tax Distribution to members (38) (44)
Net cash used in financing activities ($61) ($90)
Net increase (decrease) cash, cash equivalents and restricted cash 10 (7)
Cash, cash equivalents and restricted cash, beginning of year $14 $22
Cash, cash equivalents and restricted cash, end of year $24 $15
Supplementary disclosure of cash flow information
Cash paid during the year for interest 18 15
Derivative asset - interest rate swap 8 9 |
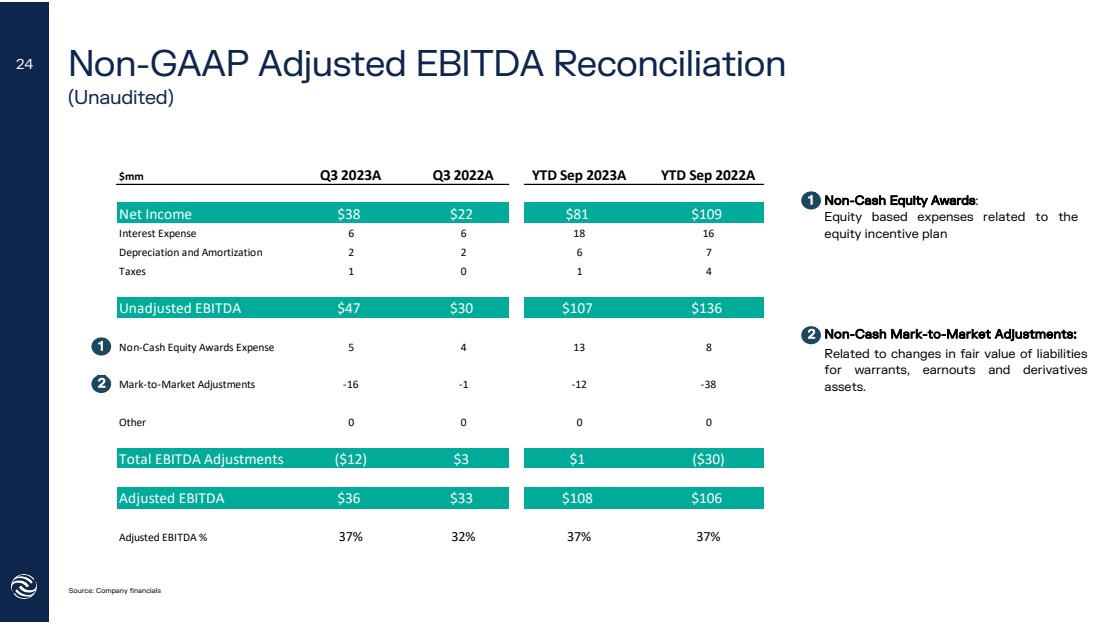
| Non-GAAP Adjusted EBITDA Reconciliation
(Unaudited)
Source: Company financials
Non-Cash Equity Awards:
Equity based expenses related to the
equity incentive plan
Non-Cash Mark-to-Market Adjustments:
Related to changes in fair value of liabilities
for warrants, earnouts and derivatives
assets.
1
2
1
2
24
$mm Q3 2023A Q3 2022A YTD Sep 2023A YTD Sep 2022A
Net Income $38 $22 $81 $109
Interest Expense 6 6 18 16
Depreciation and Amortization 2 2 6 7
Taxes 1 0 1 4
Unadjusted EBITDA $47 $30 $107 $136
Non-Cash Equity Awards Expense 5 4 13 8
Mark-to-Market Adjustments -16 -1 -12 -38
Other 0 0 0 0
Total EBITDA Adjustments ($12) $3 $1 ($30)
Adjusted EBITDA $36 $33 $108 $106
Adjusted EBITDA % 37% 32% 37% 37% |
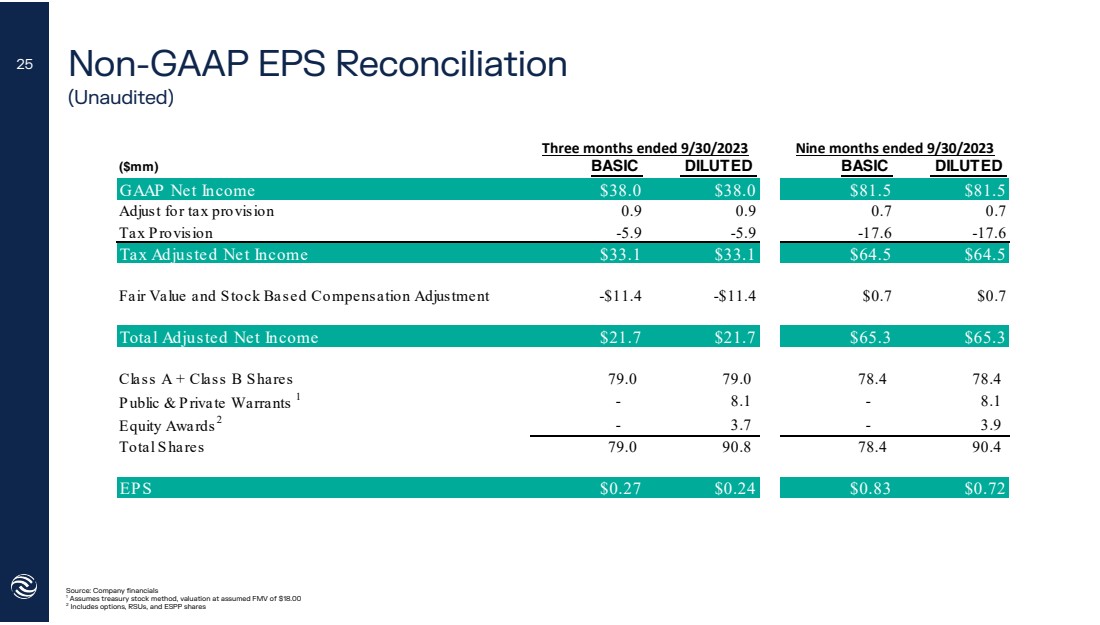
| Non-GAAP EPS Reconciliation
(Unaudited)
Source: Company financials
1 Assumes treasury stock method, valuation at assumed FMV of $18.00
2 Includes options, RSUs, and ESPP shares
25
($mm) BASIC DILUTED BASIC DILUTED
GAAP Net Income $38.0 $38.0 $81.5 $81.5
Adjust for tax provision 0.9 0.9 0.7 0.7
Tax Provision -5.9 -5.9 -17.6 -17.6
Tax Adjusted Net Income $33.1 $33.1 $64.5 $64.5
Fair Value and Stock Based Compensation Adjustment -$11.4 -$11.4 $0.7 $0.7
Total Adjusted Net Income $21.7 $21.7 $65.3 $65.3
Class A + Class B Shares 79.0 79.0 78.4 78.4
Public & Private Warrants 1 - 8.1 - 8.1
Equity Awards 2 - 3.7 - 3.9
Total Shares 79.0 90.8 78.4 90.4
EPS $0.27 $0.24 $0.83 $0.72
Three months ended 9/30/2023 Nine months ended 9/30/2023 |
Cover
|
Nov. 09, 2023 |
| Document Type |
8-K
|
| Amendment Flag |
false
|
| Document Period End Date |
Nov. 09, 2023
|
| Entity File Number |
001-39687
|
| Entity Registrant Name |
CompoSecure, Inc.
|
| Entity Central Index Key |
0001823144
|
| Entity Tax Identification Number |
85-2749902
|
| Entity Incorporation, State or Country Code |
DE
|
| Entity Address, Address Line One |
309 Pierce Street
|
| Entity Address, City or Town |
Somerset
|
| Entity Address, State or Province |
NJ
|
| Entity Address, Postal Zip Code |
08873
|
| City Area Code |
908
|
| Local Phone Number |
518-0500)
|
| Written Communications |
false
|
| Soliciting Material |
false
|
| Pre-commencement Tender Offer |
false
|
| Pre-commencement Issuer Tender Offer |
false
|
| Entity Emerging Growth Company |
true
|
| Elected Not To Use the Extended Transition Period |
false
|
| Common Stock [Member] |
|
| Title of 12(b) Security |
Class
A Common Stock, $0.0001 par value
|
| Trading Symbol |
CMPO
|
| Security Exchange Name |
NASDAQ
|
| Redeemable warrants, each whole warrant exercisable for one share of Class A Common Stock [Member] |
|
| Title of 12(b) Security |
Redeemable
warrants, each whole warrant exercisable for one share of Class A Common Stock
|
| Trading Symbol |
CMPOW
|
| Security Exchange Name |
NASDAQ
|
| X |
- DefinitionBoolean flag that is true when the XBRL content amends previously-filed or accepted submission.
| Name: |
dei_AmendmentFlag |
| Namespace Prefix: |
dei_ |
| Data Type: |
xbrli:booleanItemType |
| Balance Type: |
na |
| Period Type: |
duration |
|
| X |
- DefinitionFor the EDGAR submission types of Form 8-K: the date of the report, the date of the earliest event reported; for the EDGAR submission types of Form N-1A: the filing date; for all other submission types: the end of the reporting or transition period. The format of the date is YYYY-MM-DD.
| Name: |
dei_DocumentPeriodEndDate |
| Namespace Prefix: |
dei_ |
| Data Type: |
xbrli:dateItemType |
| Balance Type: |
na |
| Period Type: |
duration |
|
| X |
- DefinitionThe type of document being provided (such as 10-K, 10-Q, 485BPOS, etc). The document type is limited to the same value as the supporting SEC submission type, or the word 'Other'.
| Name: |
dei_DocumentType |
| Namespace Prefix: |
dei_ |
| Data Type: |
dei:submissionTypeItemType |
| Balance Type: |
na |
| Period Type: |
duration |
|
| X |
- DefinitionAddress Line 1 such as Attn, Building Name, Street Name
| Name: |
dei_EntityAddressAddressLine1 |
| Namespace Prefix: |
dei_ |
| Data Type: |
xbrli:normalizedStringItemType |
| Balance Type: |
na |
| Period Type: |
duration |
|
| X |
- Definition
+ References
+ Details
| Name: |
dei_EntityAddressCityOrTown |
| Namespace Prefix: |
dei_ |
| Data Type: |
xbrli:normalizedStringItemType |
| Balance Type: |
na |
| Period Type: |
duration |
|
| X |
- DefinitionCode for the postal or zip code
| Name: |
dei_EntityAddressPostalZipCode |
| Namespace Prefix: |
dei_ |
| Data Type: |
xbrli:normalizedStringItemType |
| Balance Type: |
na |
| Period Type: |
duration |
|
| X |
- DefinitionName of the state or province.
| Name: |
dei_EntityAddressStateOrProvince |
| Namespace Prefix: |
dei_ |
| Data Type: |
dei:stateOrProvinceItemType |
| Balance Type: |
na |
| Period Type: |
duration |
|
| X |
- DefinitionA unique 10-digit SEC-issued value to identify entities that have filed disclosures with the SEC. It is commonly abbreviated as CIK. Reference 1: http://www.xbrl.org/2003/role/presentationRef
-Publisher SEC
-Name Exchange Act
-Number 240
-Section 12
-Subsection b-2
| Name: |
dei_EntityCentralIndexKey |
| Namespace Prefix: |
dei_ |
| Data Type: |
dei:centralIndexKeyItemType |
| Balance Type: |
na |
| Period Type: |
duration |
|
| X |
- DefinitionIndicate if registrant meets the emerging growth company criteria. Reference 1: http://www.xbrl.org/2003/role/presentationRef
-Publisher SEC
-Name Exchange Act
-Number 240
-Section 12
-Subsection b-2
| Name: |
dei_EntityEmergingGrowthCompany |
| Namespace Prefix: |
dei_ |
| Data Type: |
xbrli:booleanItemType |
| Balance Type: |
na |
| Period Type: |
duration |
|
| X |
- DefinitionCommission file number. The field allows up to 17 characters. The prefix may contain 1-3 digits, the sequence number may contain 1-8 digits, the optional suffix may contain 1-4 characters, and the fields are separated with a hyphen.
| Name: |
dei_EntityFileNumber |
| Namespace Prefix: |
dei_ |
| Data Type: |
dei:fileNumberItemType |
| Balance Type: |
na |
| Period Type: |
duration |
|
| X |
- DefinitionTwo-character EDGAR code representing the state or country of incorporation.
| Name: |
dei_EntityIncorporationStateCountryCode |
| Namespace Prefix: |
dei_ |
| Data Type: |
dei:edgarStateCountryItemType |
| Balance Type: |
na |
| Period Type: |
duration |
|
| X |
- DefinitionThe exact name of the entity filing the report as specified in its charter, which is required by forms filed with the SEC. Reference 1: http://www.xbrl.org/2003/role/presentationRef
-Publisher SEC
-Name Exchange Act
-Number 240
-Section 12
-Subsection b-2
| Name: |
dei_EntityRegistrantName |
| Namespace Prefix: |
dei_ |
| Data Type: |
xbrli:normalizedStringItemType |
| Balance Type: |
na |
| Period Type: |
duration |
|
| X |
- DefinitionThe Tax Identification Number (TIN), also known as an Employer Identification Number (EIN), is a unique 9-digit value assigned by the IRS. Reference 1: http://www.xbrl.org/2003/role/presentationRef
-Publisher SEC
-Name Exchange Act
-Number 240
-Section 12
-Subsection b-2
| Name: |
dei_EntityTaxIdentificationNumber |
| Namespace Prefix: |
dei_ |
| Data Type: |
dei:employerIdItemType |
| Balance Type: |
na |
| Period Type: |
duration |
|
| X |
- DefinitionLocal phone number for entity.
| Name: |
dei_LocalPhoneNumber |
| Namespace Prefix: |
dei_ |
| Data Type: |
xbrli:normalizedStringItemType |
| Balance Type: |
na |
| Period Type: |
duration |
|
| X |
- DefinitionBoolean flag that is true when the Form 8-K filing is intended to satisfy the filing obligation of the registrant as pre-commencement communications pursuant to Rule 13e-4(c) under the Exchange Act. Reference 1: http://www.xbrl.org/2003/role/presentationRef
-Publisher SEC
-Name Exchange Act
-Number 240
-Section 13e
-Subsection 4c
| Name: |
dei_PreCommencementIssuerTenderOffer |
| Namespace Prefix: |
dei_ |
| Data Type: |
xbrli:booleanItemType |
| Balance Type: |
na |
| Period Type: |
duration |
|
| X |
- DefinitionBoolean flag that is true when the Form 8-K filing is intended to satisfy the filing obligation of the registrant as pre-commencement communications pursuant to Rule 14d-2(b) under the Exchange Act. Reference 1: http://www.xbrl.org/2003/role/presentationRef
-Publisher SEC
-Name Exchange Act
-Number 240
-Section 14d
-Subsection 2b
| Name: |
dei_PreCommencementTenderOffer |
| Namespace Prefix: |
dei_ |
| Data Type: |
xbrli:booleanItemType |
| Balance Type: |
na |
| Period Type: |
duration |
|
| X |
- DefinitionTitle of a 12(b) registered security. Reference 1: http://www.xbrl.org/2003/role/presentationRef
-Publisher SEC
-Name Exchange Act
-Number 240
-Section 12
-Subsection b
| Name: |
dei_Security12bTitle |
| Namespace Prefix: |
dei_ |
| Data Type: |
dei:securityTitleItemType |
| Balance Type: |
na |
| Period Type: |
duration |
|
| X |
- DefinitionName of the Exchange on which a security is registered. Reference 1: http://www.xbrl.org/2003/role/presentationRef
-Publisher SEC
-Name Exchange Act
-Number 240
-Section 12
-Subsection d1-1
| Name: |
dei_SecurityExchangeName |
| Namespace Prefix: |
dei_ |
| Data Type: |
dei:edgarExchangeCodeItemType |
| Balance Type: |
na |
| Period Type: |
duration |
|
| X |
- DefinitionBoolean flag that is true when the Form 8-K filing is intended to satisfy the filing obligation of the registrant as soliciting material pursuant to Rule 14a-12 under the Exchange Act. Reference 1: http://www.xbrl.org/2003/role/presentationRef
-Publisher SEC
-Name Exchange Act
-Section 14a
-Number 240
-Subsection 12
| Name: |
dei_SolicitingMaterial |
| Namespace Prefix: |
dei_ |
| Data Type: |
xbrli:booleanItemType |
| Balance Type: |
na |
| Period Type: |
duration |
|
| X |
- DefinitionTrading symbol of an instrument as listed on an exchange.
| Name: |
dei_TradingSymbol |
| Namespace Prefix: |
dei_ |
| Data Type: |
dei:tradingSymbolItemType |
| Balance Type: |
na |
| Period Type: |
duration |
|
| X |
- DefinitionBoolean flag that is true when the Form 8-K filing is intended to satisfy the filing obligation of the registrant as written communications pursuant to Rule 425 under the Securities Act. Reference 1: http://www.xbrl.org/2003/role/presentationRef
-Publisher SEC
-Name Securities Act
-Number 230
-Section 425
| Name: |
dei_WrittenCommunications |
| Namespace Prefix: |
dei_ |
| Data Type: |
xbrli:booleanItemType |
| Balance Type: |
na |
| Period Type: |
duration |
|
| X |
- Details
| Name: |
us-gaap_StatementClassOfStockAxis=us-gaap_CommonStockMember |
| Namespace Prefix: |
|
| Data Type: |
na |
| Balance Type: |
|
| Period Type: |
|
|
| X |
- Details
| Name: |
us-gaap_StatementClassOfStockAxis=CMPO_RedeemableWarrantSeachWholeWarrantExercisableForOneShareOfClassACommonStockMember |
| Namespace Prefix: |
|
| Data Type: |
na |
| Balance Type: |
|
| Period Type: |
|
|
CompoSecure (NASDAQ:CMPO)
Historical Stock Chart
From Jun 2024 to Jul 2024

CompoSecure (NASDAQ:CMPO)
Historical Stock Chart
From Jul 2023 to Jul 2024
