Ageas first quarter 2019 result
May 15 2019 - 1:30AM

Ageas first quarter 2019 result
- Strong growth of inflows
- Good net result in line with last year’s result
- New internal Non-Life reinsurance agreements implemented
|
First quarter 2019 |
|
Net Result |
- Net result of EUR 251 million versus EUR 248
million
- General Account net result of EUR 7
million negative versus EUR 52 million negative
- Life net result down 11% to EUR 223
million versus EUR 252 million due to timing differences
on capital gains Although stable operating
performance, net result in
Non-Life down 27% from EUR 48 million to
EUR 35 million due to one-off expenses
|
|
Inflows |
- Group inflows (at 100%) of EUR 12.8
billion, up 8% Life inflows up 9% to EUR
11.1 billion and Non-Life up 3% at EUR 1.7 billion
(both at 100%)
- Group inflows (Ageas’s part) up 11% at EUR 4.9 billion
|
|
Operating Performance |
- Combined ratio at 98.3%
versus 98.8%
- Operating Margin Guaranteed at 88 bps versus
137 bps due to timing difference in the investment income
- Operating Margin Unit-Linked at 18 bps versus
32 bps due to costs related to a succesful commercial campaing in
Belgium
- Life Technical Liabilities of the consolidated entities
increased to EUR 75.9 billion
|
|
Balance Sheet |
- Shareholders’ equity of EUR 10.2 billion or
EUR 52.05 per share
- Group Solvency IIageas ratio at 194% not yet
including the benefit from the new debt issue
- General Account Total Liquid Assets at EUR 1.5
billion, out of which EUR 0.7 billion is ring-fenced for
the Fortis settlement
|
All Q1 2019 figures are compared to the Q1 2018 figures unless
otherwise stated. A complete overview of the figures can be
consulted on the Ageas website.
Ageas CEO Bart De Smet said: «
We are very pleased with the strong sales momentum recorded this
first quarter, especially in Belgium, Portugal and Asia where we
continued to strongly increase our inflows. Due to a timing
difference on capital gains and the impact of the quota share
re-insurance programme, which is for the first time reflected in
our figures, the result of our Insurance activities was somewhat
down compared to the first quarter of last year. These negative,
however temporary, elements have been partly compensated by
improved profits in Continental Europe and Asia. Our Asian
activities benefited from a recovery in the Chinese equity markets
and incorporated a positive, even though still small, contribution
from our recent investment in India. All in all we are satisfied
with this good start to the year.»
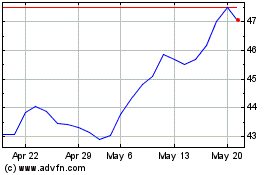
Ageas SA NV (EU:AGS)
Historical Stock Chart
From Oct 2024 to Nov 2024

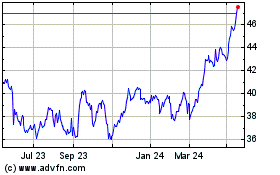
Ageas SA NV (EU:AGS)
Historical Stock Chart
From Nov 2023 to Nov 2024
