Bitcoin’s Make-or-Break Moment: What’s Holding Back the Next Big Rally?
February 19 2025 - 9:00PM
NEWSBTC
Bitcoin’s price has gradually increased, climbing from $96,000 to
nearly $97,000 as of today. Although still shy of the coveted
$100,000 mark, the leading cryptocurrency shows signs of
resilience. This recovery is unfolding against the backdrop of
mixed market signals, prompting analysts to weigh the potential for
continued bullish momentum versus the risk of a near-term pullback.
Related Reading: Bitcoin Faces Persistent Resistance at $100K,
Analyst Eyes Next Step Bitcoin’s Market Momentum at a Crossroads
One recent analysis from Onchain Edge, a contributor to
CryptoQuant’s QuickTake platform, highlights Bitcoin’s current
“critical decision zone.” Using two key indicators—the Taker
Buy/Sell Ratio and the MVRV Ratio—Onchain Edge’s findings suggest a
market that is not yet overvalued, though caution flags remain.
While the overall on-chain data leans more positive, the
contrasting signals highlight the precarious position of Bitcoin’s
current rally. From a bullish perspective, the MVRV Ratio—an
indicator that compares Bitcoin’s market value to its realized
value—stands at 2.21, well below the levels that typically signal
market tops (3.5–4.0). This suggests that Bitcoin’s current
valuation is not overstretched, leaving room for further upside.
Moreover, other indicators such as the Puell Multiple reinforce the
notion that Bitcoin has not yet reached overbought conditions.
According to the CryptoQuant analyst, if these macro indicators
hold steady and buyers return in force, Bitcoin could continue its
upward trajectory, potentially reclaiming six-figure territory
before any substantial correction sets in. Possible Bearish Signals
on the Horizon Despite these promising signs, the Taker Buy/Sell
Ratio, which gauges market sentiment by comparing aggressive buy
and sell orders, stands at 0.96—below the 0.98 threshold often
associated with bullish strength. Onchain Edge reveals that
historically, levels around this range have preceded market
corrections, as was the case during peaks in March and November of
2021. Should Bitcoin fail to break above resistance, this ratio
could hint at a short-term top. A sustained failure to climb past
current levels may trigger a temporary pullback, providing a
cooling-off period before any subsequent rally. As Bitcoin hovers
near this pivotal price point, the market remains finely balanced
between cautious optimism and potential downside risk. Onchain Edge
concludes that maintaining a level above $95,000, combined with a
resurgence in buying activity, could pave the way for a move to new
highs. Related Reading: Bitcoin Meets Fiscal Reality: Fidelity’s
Timmer Predicts What’s Next Conversely, a decline below critical
support might lead to a healthy correction before the market
regains upward momentum. While the bull cycle appears intact, the
coming days may determine whether Bitcoin’s current rally has
enough fuel to continue, or if a pause is on the horizon. Featured
image created with DALL-E, Chart from TradingView
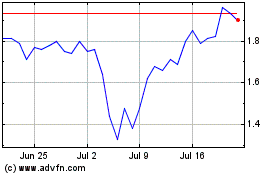
Optimism (COIN:OPUSD)
Historical Stock Chart
From Jan 2025 to Feb 2025

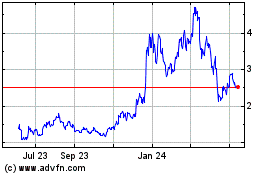
Optimism (COIN:OPUSD)
Historical Stock Chart
From Feb 2024 to Feb 2025
