Ballantyne Strong, Inc. (NYSE Amex: BTN):
Conference call:
Today, Friday, August 7, 2009 at 10:00 a.m. ET
Webcast / Replay URL:
www.earnings.com or
http://www.ballantyne-strong.com/IREvents.aspx
The replay will be available on the Internet for 90 days.
Dial-in number:
800-734-8507 (no pass code required)
Ballantyne Strong, Inc. (NYSE Amex: BTN), formally known as
Ballantyne of Omaha, Inc., a provider of motion picture projection,
digital cinema and cinema screen equipment and cinema services,
today reported improved financial results for the second quarter
(Q2) ended June 30, 2009.
Q2 2009 net revenues rose 44% to $19.6 million from net revenues
of $13.6 million in Q2 2008. Net income increased to $0.9 million,
or $0.07 per diluted share, in Q2 2009 compared to a net loss of
$0.1 million, or ($0.01) per diluted share, a year-ago.
Digital projection equipment sales increased to $10.0 million in
Q2 2009 compared to $2.6 million a year ago, reflecting global
demand for systems used to deliver a 3-D cinema experience. In
addition, sales of cinema screens rose to $3.1 million versus $1.1
million in Q2 2008, largely reflecting continued strong demand for
specialty “silver” screens used for 3-D digital cinema. A
year-over-year increase in cinema service revenues also contributed
to the improved sales results.
Q2 2009 gross profit increased to $4.3 million, or 21.7% of net
revenues, compared to Q2 2008’s gross profit of $2.0 million, or
15.0% of net revenues. The increase in gross profit reflected
higher cinema screen and digital projection sales as well as a
margin improvement in the Company’s cinema service business.
SG&A in Q2 2009 increased to $2.6 million compared to $2.4
million in the year ago period yet declined as a percentage of
revenue to 13.5% in Q2 2009 from 17.4% in Q2 2008. The decline as a
percentage of revenues resulted from the impact of higher sales
volume on fixed expenses. The increase in expenses primarily
reflects higher insurance costs due to increased business volume,
higher non-cash stock compensation expense and expenses related to
the Company’s office in Beijing, China which was not open a
year-ago.
Six Month Results
For the six-month period ended June 30, 2009, net revenues rose
32% to $36.7 million compared to $27.8 million a year ago. Gross
profit in the first half of 2009 was $7.6 million, or 20.8% of net
revenues, compared to first half 2008 gross profit of $4.4 million,
or 15.7% of net revenues. Net income for the first six months of
2009 was $1.5 million, or $0.10 per diluted share, compared to a
net loss of $0.4 million, or $(0.03) per diluted share, in the
first half of 2008.
John P. Wilmers, President and Chief Executive Officer of
Ballantyne, commented, “Following our improved performance last
quarter, Ballantyne again delivered additional growth in revenue
and net income. Our results so far in 2009 reflect growing industry
demand for digital cinema projection products and services,
particularly as exhibitors seek to capitalize on the growing
availability of, and consumer demand for, 3-D content. The strength
of our digital projection equipment sales in the quarter reflect
the sale of 100 digital projectors to China Film Group, coupled
with active demand from a number of independent chains in the US as
well as increased sales in Latin America. In addition, our
Strong/MDI screen business delivered substantial growth in the
period, reflecting ongoing 3-D related demand.
“We are confident that the industry’s transition to digital
projection equipment will continue throughout 2009. We believe
Ballantyne is well positioned to participate in this global trend
given our wide array of high quality products and our reputation
for the best in customer service. We are also excited about the
substantial services opportunity as digital cinema deployments
continue to ramp up. Our services group has one of the largest and
best trained teams of digital projection technicians in North
America, putting us in a leadership position to support large and
small customers with their installation, service and maintenance
needs.”
Balance Sheet Update:
As previously reported, during Q2 2009 Ballantyne redeemed all
of its remaining outstanding AAA-rated Auction Rate Securities
(ARS) at par value, yielding total cash proceeds of approximately
$9.4 million. Reflecting these proceeds, coupled with $0.6 million
of ARS redemptions at par value from other means, Ballantyne’s cash
and cash equivalents rose to $21.2 million from $11.4 million at
the end of fiscal year 2008.
About Ballantyne Strong, Inc.
Ballantyne is a provider of motion picture projection, digital
cinema projection and specialty lighting equipment and services.
The Company supplies major theater chains, top arenas, television
and motion picture production studios, theme parks and
architectural sites around the world. For more information visit
www.ballantyne-strong.com.
Except for the historical information in this press release, it
includes forward-looking statements that involve risks and
uncertainties, including but not limited to, quarterly fluctuations
in results; customer demand for the Company’s products; the
development of new technology for alternate means of motion picture
presentation; domestic and international economic conditions; the
management of growth; and other risks detailed from time to time in
the Company’s Securities and Exchange Commission filings. Actual
results may differ materially from management’s expectations.
Ballantyne Strong, Inc. and
Subsidiaries
Consolidated Statements of
Operations
(unaudited)
Three Months EndedJune
30,
Six Months EndedJune
30,
2009
2008
2009
2008
Net revenues $ 19,602,707 $ 13,643,104 $ 36,746,160 $
27,840,276 Cost of revenues 15,350,114
11,593,249 29,114,497 23,480,540
Gross profit 4,252,593 2,049,855 7,631,663 4,359,736 Selling
& administrative Expenses: Selling 767,791 742,718 1,436,190
1,530,520 General & administrative 1,875,652
1,634,972 3,952,312 3,660,268
Total SG&A expense
2,643,443 2,377,690 5,388,502 5,190,788 Gain on sale of assets -
258,170 - 258,170 Loss on disposal of assets (1,943 )
- (1,943 ) (1,285 ) Income (loss) from
operations 1,607,207 (69,665 ) 2,241,218 (574,167 ) Interest
income 29,404 129,350 70,534 275,536 Interest expense (9,328 )
(9,163 ) (17,441 ) (17,698 ) Equity in loss of Joint Venture
(233,625 ) (184,909 ) (418,137 ) (297,900 ) Other income (expense)
net (68,333 ) 19,882 112,904
46,674 Income (loss) before income taxes 1,325,325
(114,505 ) 1,989,078 (567,555 ) Income tax (expense) benefit
(391,404 ) 5,576 (513,438 ) 193,038
Net income (loss) $ 933,921 $ (120,081 ) $ 1,475,640
$ (374,517 ) Earnings (loss) per share Basic $ 0.07
$ (0.01 ) $ 0.11 $ (0.03 ) Diluted $ 0.07 $
(0.01 ) $ 0.10 $ (0.03 ) Weighted average shares
outstanding: Basic 13,995,286 13,890,882
13,991,766 13,874,661 Diluted
14,138,239 13,890,882 14,127,450
13,874,661
Selected Balance Sheet
Items:
June 30, 2009
December 31,2008
(unaudited) Cash and cash equivalents $ 21,168,964 $
11,424,984 Restricted cash 702,158 701,498 Accounts receivable and
unbilled revenue, net 13,585,393 7,038,258 Inventories, net
8,950,484 9,476,687 Long-term investments in securities, net -
8,883,420 Total current liabilities 15,739,812 10,960,830 Total
stockholders’ equity $ 41,354,455 $ 38,834,639
Selected Cash Flow Statement
Items (unaudited):
Six Months Ended
June 30,
2009
2008
Net income (loss) $ 1,475,640 $ (374,517 ) Depreciation and
amortization 923,206 1,265,601 Equity in loss in Digital Link II
Joint Venture 418,137 297,900 Net cash provided by (used in)
operating activities 73,328 (439,845 ) Capital expenditures
(457,146 ) (492,115 ) Proceeds from redemptions of investment
securities 10,025,000 1,225,000 Net cash provided by investing
activities 9,576,617 936,880 Net increase in cash & cash
equivalents 9,743,980 643,728 Cash & cash equivalents at
beginning of period 11,424,984 4,220,355 Cash & cash
equivalents at end of period $ 21,168,964 $ 4,864,083
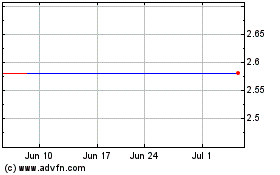
Ballantyne Strong (AMEX:BTN)
Historical Stock Chart
From Jun 2024 to Jul 2024

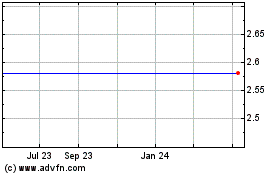
Ballantyne Strong (AMEX:BTN)
Historical Stock Chart
From Jul 2023 to Jul 2024
