Vertex AI Price Forecast: Bitcoin Has 60% Chance Of Hitting $100,000, Key Predictions Unveiled
April 25 2024 - 10:00PM
NEWSBTC
On-chain analytics firm Spot On Chain’s team of analysts, using
Google Cloud’s Vertex artificial intelligence (AI), has conducted
an in-depth analysis to forecast the future price of Bitcoin
(BTC). Their latest report provides valuable insights into
the leading cryptocurrency’s short-, medium-, and long-term
outlook. Bitcoin Price Forecasts According to Spot On Chain’s
report, Bitcoin prices are expected to fluctuate between $56,000
and $70,000 during May, June, and July 2024. This projected
range indicates the potential for market volatility, with a 48%
probability assigned to the scenario where BTC prices may dip below
$60,000. Moreover, the report advises a cautious approach,
acknowledging the possibility of short-term fluctuations or
corrections in the price. Related Reading: SEC Anticipated To
Reject Spot Ethereum ETFs In Upcoming Decision, ETH Price Takes 5%
Hit Spot On Chain’s analysis reveals a significant movement in the
latter half of 2024, with a compelling 63% probability of Bitcoin
reaching $100,000. This mid-term projection reflects a
prevailing bullish sentiment in the market, further fueled by
anticipated rate cuts after the Federal Open Market Committee’s
(FOMC) December 2023 meeting. These rate cuts aim to bring
the federal funds rate down to 4.6% and are expected to boost
demand for risk-on assets such as stocks and Bitcoin. Looking ahead
to the first half of 2025, Spot On Chain’s modeling indicates a
strong probability that Bitcoin will cross the $150,000 threshold.
Specifically, a 42% probability is assigned to this scenario,
indicating a bullish outlook for Bitcoin’s price trajectory. What’s
more, looking at the entire year of 2025, the probability of
Bitcoin exceeding $150,000 rises to an eye-popping 70%. Based on
historical data and patterns in previous cycles, Bitcoin reached a
new all-time high approximately 6 to 12 months after the Halving
event. Price Consolidation On The Horizon? Crypto analyst
Retk Capital has also provided insights into the current Bitcoin
price action, shedding light on key resistance levels and the
potential for a consolidation phase before an anticipated parabolic
upside. According to Retk Capital’s analysis, Bitcoin has
consistently been rejected from the $65,600 resistance level,
failing to regain it as a support level. This resistance zone
has significantly impeded Bitcoin’s upward movement in recent days,
as seen on the cryptocurrency’s daily BTC/USD chart below.
Related Reading: HBAR Prices Crashes 35% As BlackRock Denies Any
Ties To Hedera Retk Capital further highlights that Bitcoin has
been witnessing downside wicks into a pool of liquidity at
approximately $60,600. This occurrence has been observed over
multiple weeks, indicating the presence of buyers in that price
range. If Bitcoin experiences further downward movement, the
analyst believes that there is a possibility that it may approach
this area once again. The analyst further notes: Price dropping
without context can be emotionally challenging. However,
understanding that this downside is part of the consolation within
a technical range-bound structure that will precede Parabolic
Upside makes this experience much more comforting. As of this
writing, BTC is trading at $63,900, down nearly 8% over the past
two weeks and the same percentage over the past 30 days. Featured
image from Shutterstock, chart from TradingView.com
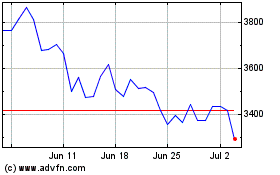
Ethereum (COIN:ETHUSD)
Historical Stock Chart
From Apr 2024 to May 2024

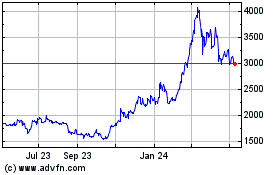
Ethereum (COIN:ETHUSD)
Historical Stock Chart
From May 2023 to May 2024
