0000730263 False 0000730263 2024-03-06 2024-03-06 iso4217:USD xbrli:shares iso4217:USD xbrli:shares
UNITED STATES
SECURITIES AND EXCHANGE COMMISSION
Washington, D.C. 20549
_________________
FORM 8-K
_________________
CURRENT REPORT
Pursuant to Section 13 or 15(d)
of the Securities Exchange Act of 1934
Date of Report (Date of earliest event reported): March 6, 2024
_______________________________
THOR Industries, Inc.
(Exact name of registrant as specified in its charter)
_______________________________
| Delaware | 1-9235 | 93-0768752 |
| (State or Other Jurisdiction of Incorporation) | (Commission File Number) | (I.R.S. Employer Identification No.) |
601 East Beardsley Avenue
Elkhart, Indiana 46514-3305
(Address of Principal Executive Offices) (Zip Code)
(574) 970-7460
(Registrant's telephone number, including area code)
N/A
(Former name or former address, if changed since last report)
_______________________________
Check the appropriate box below if the Form 8-K filing is intended to simultaneously satisfy the filing obligation of the registrant under any of the following provisions:
| ☐ | Written communications pursuant to Rule 425 under the Securities Act (17 CFR 230.425) |
| ☐ | Soliciting material pursuant to Rule 14a-12 under the Exchange Act (17 CFR 240.14a-12) |
| ☐ | Pre-commencement communications pursuant to Rule 14d-2(b) under the Exchange Act (17 CFR 240.14d-2(b)) |
| ☐ | Pre-commencement communications pursuant to Rule 13e-4(c) under the Exchange Act (17 CFR 240.13e-4(c)) |
Securities registered pursuant to Section 12(b) of the Act:
| Title of each class | Trading Symbol(s) | Name of each exchange on which registered |
| Common Stock (Par value $.10 Per Share) | THO | New York Stock Exchange |
Indicate by check mark whether the registrant is an emerging growth company as defined in Rule 405 of the Securities Act of 1933 (§230.405 of this chapter) or Rule 12b-2 of the Securities Exchange Act of 1934 (§240.12b-2 of this chapter).
Emerging growth company ☐
If an emerging growth company, indicate by check mark if the registrant has elected not to use the extended transition period for complying with any new or revised financial accounting standards provided pursuant to Section 13(a) of the Exchange Act. ☐
Item 2.02. Results of Operations and Financial Condition.
On March 6, 2024, THOR Industries, Inc. (the “Company”) issued a press release announcing certain financial results for the second quarter ended January 31, 2024. A copy of the Company’s press release is attached hereto as Exhibit 99.1 and is incorporated by reference herein. The Company also posted an updated investor slide presentation and a list of investor questions and answers to the “Investors” section of its website. A copy of the Company’s slide presentation and investor questions and answers are attached hereto as Exhibit 99.2 and 99.3, respectively, and are incorporated by reference herein.
Item 7.01. Regulation FD Disclosure.
The press release attached hereto as Exhibit 99.1 provides earnings guidance with updated information on industry and Company projections for the Company’s fiscal year 2024. The slide presentation attached hereto as Exhibit 99.2, and incorporated by reference herein, also provides earnings guidance as well as updated information on industry wholesale shipments and retail market share. The Company also posted an updated list of investor questions and answers to the “Investors” section of its website. A copy of the Company's investor questions and answers is attached hereto as Exhibit 99.3 and is incorporated by reference herein.
In accordance with general instruction B.2 to Form 8-K, the information set forth in Items 2.02 and 7.01 of this Form 8-K (including Exhibits 99.1, 99.2 and 99.3) shall be deemed “furnished” and not “filed” with the Securities and Exchange Commission for purposes of Section 18 of the Securities Exchange Act of 1934, as amended, and shall not be incorporated by reference into any filing thereunder or under the Securities Act of 1933, as amended.
Item 9.01. Financial Statements and Exhibits.
SIGNATURE
Pursuant to the requirements of the Securities Exchange Act of 1934, the registrant has duly caused this report to be signed on its behalf by the undersigned hereunto duly authorized.
| | THOR Industries, Inc. |
| | | |
| | | |
| Date: March 6, 2024 | By: | /s/ Colleen Zuhl |
| | | Colleen Zuhl |
| | | Senior Vice President and Chief Financial Officer |
| | | |
EXHIBIT 99.1
THOR Industries Announces Second Quarter Fiscal 2024 Results
ANTICIPATES STRONGER PERFORMANCE IN THE SECOND HALF OF FISCAL 2024 WHILE LOWERING FISCAL 2024 GUIDANCE TO REFLECT COMPANY’S PRUDENT FOCUS ON OPERATIONAL EXECUTION AHEAD OF MARKET RECOVERY
Fiscal Second Quarter 2024 Highlights
- Consolidated net sales for the second quarter were $2.21 billion.
- Consolidated gross profit margin for the second quarter was 12.3%.
- Net income attributable to THOR Industries, Inc. and diluted earnings per share for the second quarter of fiscal 2024 were $7.2 million and $0.13, respectively, inclusive of a $14.7 million charge related to the November 15, 2023 refinancing of the Company’s debt facilities.
- The Company revised its full-year fiscal 2024 consolidated net sales and diluted earnings per share guidance to a consolidated net sales range of $10.0 billion to $10.5 billion and diluted earnings per share in the range of $5.00 to $5.50.
ELKHART, Ind., March 06, 2024 (GLOBE NEWSWIRE) -- THOR Industries, Inc. (NYSE: THO) today announced financial results for its second fiscal quarter ended January 31, 2024.
“Our fiscal second quarter, similar to the prior-year period, presented a challenging operating environment as seasonally lower retail demand and cautious dealer sentiment impacted our results. As macro conditions continue to pressure the top-line, our teams proactively navigated through the retail offseason to improve the competitive positioning of our operating companies and independent dealer partners. Notably, we continued to work with our North American independent dealer partners to closely match wholesale production with the pace of retail sales and we enacted promotional programs to assist independent dealers in moving prior-model-year units and stimulate retail demand. With the rapid increase in interest rates over the past year, dealers face elevated floorplan financing costs that have put substantial pressure on their operations. As a result, we currently believe that even though the levels and mix of channel inventory are well-positioned ahead of the retail selling season, dealers will remain focused on limiting inventory levels as they manage interest expense,” said Bob Martin, President and CEO of THOR Industries.
“Over the long term, we remain encouraged as attendance figures at recent retail RV shows and consumer interest in the lifestyle remain strong. Our teams will continue to monitor evolving market trends as we progress through the upcoming selling season, and we remain highly confident in our operating teams and flexible business model to deliver value for our independent dealer partners and end consumers,” added Martin.
Second-Quarter Financial Results
Consolidated net sales were $2.21 billion in the second quarter of fiscal 2024, compared to $2.35 billion for the second quarter of fiscal 2023.
Consolidated gross profit margin for the second quarter of fiscal 2024 was 12.3%, an increase of 20 basis points when compared to the second quarter of fiscal 2023.
Net income attributable to THOR Industries, Inc. and diluted earnings per share for the second quarter of fiscal 2024 were $7.2 million and $0.13, respectively, compared to $27.1 million and $0.50, respectively, for the second quarter of fiscal 2023. In the second quarter of fiscal 2024, as a result of the amendments and associated maturity date extensions and interest rate margin reductions related to the November 15, 2023 refinancing of the Company’s debt facilities, the Company recognized total expense of $14.7 million. Approximately $7.5 million of this expense is classified as interest expense in the Company’s Condensed Consolidated Statements of Income and Comprehensive Income and primarily represents extinguishment charges, and the remaining $7.2 million of this expense is classified as administrative expense and primarily represents third-party costs attributed to the modified debt facilities.
THOR’s consolidated results were primarily driven by the results of its individual reportable segments as noted below.
Segment Results
North American Towable RVs
| ($ in thousands) | Three Months Ended January 31, | | %
| | Six Months Ended January 31, | | %
|
| | | 2024 | | | 2023 | | | Change | | | 2024 | | | 2023 | | Change |
| Net Sales | $ | 730,968 | | $ | 829,751 | | | (11.9 | ) | | $ | 1,676,422 | | $ | 2,147,557 | | (21.9 | ) |
| Gross Profit | $ | 53,897 | | $ | 52,863 | | | 2.0 | | | $ | 171,908 | | $ | 248,729 | | (30.9 | ) |
| Gross Profit Margin % | | 7.4 | | | 6.4 | | | | | | 10.3 | | | 11.6 | | |
| Income (Loss) Before Income Taxes | $ | 661 | | $ | (7,119 | ) | | 109.3 | | | $ | 49,910 | | $ | 103,888 | | (52.0 | ) |
| | As of January 31, | | %
|
| ($ in thousands) | | 2024 | | | 2023 | | Change |
| Order Backlog | $ | 836,202 | | $ | 1,152,991 | | (27.5 | ) |
- North American Towable RV net sales were down 11.9% for the second quarter of fiscal 2024 compared to the prior-year period, driven by a 10.2% increase in unit shipments offset by a 22.1% decrease in the overall net price per unit. The decrease in the overall net price per unit was primarily due to the combined impact of a shift in product mix toward travel trailers and more moderately-priced units along with price compared to the prior-year period.
- North American Towable RV gross profit margin was 7.4% for the second quarter of fiscal 2024, compared to 6.4% in the prior-year period. The increase in gross profit margin was primarily driven by a decrease in the material cost percentage, due to the combined favorable impacts of product mix changes and cost-savings initiatives, partially offset by higher labor and manufacturing overhead percentages.
- North American Towable RV income before income taxes for the second quarter of fiscal 2024 was $0.7 million, compared to a loss before income taxes of $7.1 million in the second quarter of fiscal 2023. This improvement was driven primarily by lower amortization costs and larger gains on the sales of fixed assets in the current year period.
North American Motorized RVs
| ($ in thousands) | Three Months Ended January 31, | | %
| | Six Months Ended January 31, | | %
|
| | | 2024 | | | 2023 | | Change | | | 2024 | | | 2023 | | Change |
| Net Sales | $ | 570,424 | | $ | 738,583 | | (22.8 | ) | | $ | 1,281,583 | | $ | 1,862,102 | | (31.2 | ) |
| Gross Profit | $ | 60,721 | | $ | 107,212 | | (43.4 | ) | | $ | 140,113 | | $ | 292,947 | | (52.2 | ) |
| Gross Profit Margin % | | 10.6 | | | 14.5 | | | | | 10.9 | | | 15.7 | | |
| Income Before Income Taxes | $ | 26,460 | | $ | 61,544 | | (57.0 | ) | | $ | 63,512 | | $ | 185,977 | | (65.8 | ) |
| | As of January 31, | | %
|
| ($ in thousands) | | 2024 | | | 2023 | | Change |
| Order Backlog | $ | 1,072,687 | | $ | 1,848,124 | | (42.0 | ) |
- North American Motorized RV net sales decreased 22.8% for the second quarter of fiscal 2024 compared to the prior-year period. The decrease was primarily due to an 18.4% reduction in unit shipments, partly due to independent dealer restocking in the prior-year period, as well as a 4.4% decrease resulting from changes in product mix and net price per unit as current-year shipments trended toward more moderately-priced units and included elevated sales discounts compared to the prior-year period.
- North American Motorized RV gross profit margin was 10.6% for the second quarter of fiscal 2024, compared to 14.5% in the prior-year period. The decrease in the gross profit margin for the second quarter of fiscal 2024 was primarily driven by an increase in sales discounts and chassis costs as well as an increase in manufacturing overhead cost as a percentage of net sales due to the reduction in net sales.
- North American Motorized RV income before income taxes for the second quarter of fiscal 2024 decreased to $26.5 million compared to $61.5 million in the prior-year period, driven by the decrease in net sales and the decline in the gross margin percentage.
European RVs
| ($ in thousands) | Three Months Ended January 31, | | %
| | Six Months Ended January 31, | | %
|
| | | 2024 | | | 2023 | | Change | | | 2024 | | | 2023 | | Change |
| Net Sales | $ | 782,294 | | $ | 646,938 | | 20.9 | | $ | 1,490,495 | | $ | 1,151,240 | | 29.5 |
| Gross Profit | $ | 119,325 | | $ | 91,430 | | 30.5 | | $ | 242,153 | | $ | 160,295 | | 51.1 |
| Gross Profit Margin % | | 15.3 | | | 14.1 | | | | | 16.2 | | | 13.9 | | |
| Income Before Income Taxes | $ | 38,057 | | $ | 12,015 | | 216.7 | | $ | 66,824 | | $ | 5,547 | | 1,104.7 |
| | As of January 31, | | %
|
| ($ in thousands) | | 2024 | | | 2023 | | Change |
| Order Backlog | $ | 2,746,307 | | $ | 3,055,738 | | (10.1 | ) |
- European RV net sales increased 20.9% for the second quarter of fiscal 2024 compared to the prior-year period, driven by a 3.9% increase in unit shipments and a 17.0% increase in the overall net price per unit due to the total combined impact of changes in foreign currency, product mix and price. The overall net price per unit increase of 17.0% includes a 4.1% increase due to the impact of foreign currency exchange rate changes.
- European RV gross profit margin was 15.3% of net sales for the second quarter of fiscal 2024 compared to 14.1% in the prior-year period. This improvement in the gross profit margin for the quarter was primarily driven by net selling price increases, product mix changes and a reduction in labor costs as a percentage of net sales.
- European RV income before income taxes for the second quarter of fiscal 2024 was $38.1 million compared to income before income taxes of $12.0 million during the second quarter of fiscal 2023. The improvement was primarily driven by the increase in net sales.
Management Commentary
“Similar to last year, our fiscal second quarter financial results were impacted by cautious wholesale ordering patterns by our North American independent dealers in response to challenging seasonal market conditions and the elevated interest rate environment. Against this backdrop, our operating teams maintained a prudent focus on operational execution that prioritizes through-cycle profitability while also actively assisting independent dealers in managing their respective inventory positions. We have implemented a disciplined operating approach in a softer demand environment that involves producing the right mix of products at price points that resonate with today’s more budget-conscious consumer. In addition, we are working with our supplier partners to identify opportunities to reduce costs where possible,” said Todd Woelfer, Senior Vice President and Chief Operating Officer.
“In North America, we took deliberate actions of maintaining production discipline balanced with increased dealer assistance to help address the current macro environment. During the fiscal second quarter, we continued to sustain production levels that mirror the pace of retail sales, resulting in modest restocking of approximately 4,000 units, far below historical restocking levels for our fiscal second quarter. Our teams provided increased incentive support to our independent dealers aimed at helping pull prior-model-year product through and to assist dealers facing cash flow constraints. Additionally, through the quarter, we continued to leverage our variable cost model as we achieved greater footprint consolidation and operational efficiencies. As a result of these actions, we are well positioned to work with our independent dealers to endure current market conditions and emerge in a stronger position with the resumption of long-term market growth trends,” continued Woelfer.
“In Europe, fiscal second quarter net sales increased 20.9% while income before income taxes increased by more than 200% compared to the prior-year period. While we consider independent dealer inventories of European products to be restocked to appropriate levels exiting the second quarter of fiscal 2024, we are extremely pleased with the continued efforts of our European teams to drive continued operational efficiencies to sustain a strong profitability profile and work towards recapturing market share of motorized product as a result of improved chassis availability. This positioned our European companies to provide acceptable levels of inventories to our European dealers,” concluded Woelfer.
“Despite navigating through a challenging quarter, we continue to actively manage our balance sheet to maintain a strong financial position. During the quarter, the Company entered into an amendment to its term-loan credit facility to extend its maturity from February 2026 to November 2030 and reduce the applicable margin used to determine the interest rate on USD loans by 0.25% while concurrently amending its ABL agreement to extend the maturity from September 2026 to November 2028. This proactive refinancing secured access to long-term financing with favorable pricing terms and largely unchanged covenants and provisions while also ensuring adequate capital availability. As of January 31, 2024, we had liquidity of approximately $1.3 billion, including approximately $340.2 million in cash on hand and approximately $938.0 million available under our asset-based revolving credit facility. Looking ahead to the second half of fiscal 2024, and consistent with historical trends, we expect to generate strong net cash flow from operations driven by operating results in addition to reduced net working capital levels. Our financial strength and strong cash generation profile will continue to provide significant financial flexibility and support our efforts to advance and capitalize on our long-term strategic plan,” said Colleen Zuhl, Senior Vice President and Chief Financial Officer.
Outlook
“We are cautious heading into the prime retail selling season as we believe North American dealers will maintain tight control over inventory levels until retail demand firms. The macro environment remains under pressure from elevated interest rates that impact the cash flow of our independent dealers as well as consumers’ desire to make large discretionary purchases. Given this backdrop, we will maintain a prudent focus on solid operational execution through disciplined production, product portfolio optimization and cost management as we move into the second half of the fiscal year,” said Martin.
“Although the near-term environment is challenging, we expect improving market conditions as we progress through calendar 2024. We continue to be very optimistic about the strong underlying interest for the RV lifestyle and consumer demand for our robust RV product offering. As the global leader in the RV industry, our ability to continually innovate and adapt in an ever-evolving market landscape positions us to succeed. Furthermore, our strong balance sheet and cash generation ability, underpinned by our variable cost model, enable us to advance on our strategic initiatives to drive long-term growth,” added Martin.
Fiscal 2024 Guidance
The Company’s fiscal 2024 guidance has been revised to reflect challenging market conditions expected to persist into the second half of fiscal 2024. Based on current North American order intake levels through the end of February, the Company is lowering its consolidated net sales and diluted earnings per share guidance ranges to reflect a lowered fiscal year 2024 North American industry wholesale shipment range of between 330,000 and 340,000 units, which is more conservative than our previous shipment range of between 350,000 and 365,000 units.
For fiscal 2024, the Company’s updated full-year guidance now includes:
- Consolidated net sales in the range of $10.0 billion to $10.5 billion (previously $10.5 billion to $11.0 billion)
- Consolidated gross profit margin in the range of 14.0% to 14.5% (previously 14.5% to 15.0%)
- Diluted earnings per share in the range of $5.00 to $5.50 (previously $6.25 to $7.25)
“The combination of the delay in interest rate relief and softer return of the retail market as the macroeconomic challenges persist has delayed the return of stronger top and bottom lines from our expectations at the beginning of our fiscal year. Because we have not assumed any material relief from these macroeconomic challenges through the balance of fiscal 2024, we have revised our guidance to match our current outlook and will continue to manage the business in line with this more cautious view. While this delay will impact our earnings results in fiscal 2024, we have strong confidence in our ability to deliver on our revised fiscal 2024 outlook,” concluded Martin.
Supplemental Earnings Release Materials
THOR Industries has provided a comprehensive question and answer document, as well as a PowerPoint presentation, relating to its quarterly results and other topics.
To view these materials, go to http://ir.thorindustries.com.
About THOR Industries, Inc.
THOR Industries is the sole owner of operating companies which, combined, represent the world’s largest manufacturer of recreational vehicles.
For more information on the Company and its products, please go to www.thorindustries.com.
Forward-Looking Statements
This release includes certain statements that are “forward-looking” statements within the meaning of the U.S. Private Securities Litigation Reform Act of 1995, Section 27A of the Securities Act of 1933, as amended, and Section 21E of the Securities Exchange Act of 1934, as amended. These forward-looking statements are made based on management’s current expectations and beliefs regarding future and anticipated developments and their effects upon THOR, and inherently involve uncertainties and risks. These forward-looking statements are not a guarantee of future performance. We cannot assure you that actual results will not differ materially from our expectations. Factors which could cause materially different results include, among others: the impact of inflation on the cost of our products as well as on general consumer demand; the effect of raw material and commodity price fluctuations, and/or raw material, commodity or chassis supply constraints; the impact of war, military conflict, terrorism and/or cyber-attacks, including state-sponsored or ransom attacks; the impact of sudden or significant adverse changes in the cost and/or availability of energy or fuel, including those caused by geopolitical events, on our costs of operation, on raw material prices, on our suppliers, on our independent dealers or on retail customers; the dependence on a small group of suppliers for certain components used in production, including chassis; interest rates and interest rate fluctuations and their potential impact on the general economy and, specifically, on our profitability and on our independent dealers and consumers; the ability to ramp production up or down quickly in response to rapid changes in demand while also managing costs and market share; the level and magnitude of warranty and recall claims incurred; the ability of our suppliers to financially support any defects in their products; legislative, regulatory and tax law (including recent and pending tax-law changes implementing new, widely adopted "Pillar II" tax principles) and/or policy developments including their potential impact on our independent dealers, retail customers or on our suppliers; the costs of compliance with governmental regulation; the impact of an adverse outcome or conclusion related to current or future litigation or regulatory investigations; public perception of and the costs related to environmental, social and governance matters; legal and compliance issues including those that may arise in conjunction with recently completed transactions; lower consumer confidence and the level of discretionary consumer spending; the impact of exchange rate fluctuations; restrictive lending practices which could negatively impact our independent dealers and/or retail consumers; management changes; the success of new and existing products and services; the ability to maintain strong brands and develop innovative products that meet consumer demands; the ability to efficiently utilize existing production facilities; changes in consumer preferences; the risks associated with acquisitions, including: the pace and successful closing of an acquisition, the integration and financial impact thereof, the level of achievement of anticipated operating synergies from acquisitions, the potential for unknown or understated liabilities related to acquisitions, the potential loss of existing customers of acquisitions and our ability to retain key management personnel of acquired companies; a shortage of necessary personnel for production and increasing labor costs and related employee benefits to attract and retain production personnel in times of high demand; the loss or reduction of sales to key independent dealers, and stocking level decisions of our independent dealers; disruption of the delivery of units to independent dealers or the disruption of delivery of raw materials, including chassis, to our facilities; increasing costs for freight and transportation; the ability to protect our information technology systems from data breaches, cyber-attacks and/or network disruptions; asset impairment charges; competition; the impact of losses under repurchase agreements; the impact of the strength of the U.S. dollar on international demand for products priced in U.S. dollars; general economic, market, public health and political conditions in the various countries in which our products are produced and/or sold; the impact of changing emissions and other related climate change regulations in the various jurisdictions in which our products are produced, used and/or sold; changes to our investment and capital allocation strategies or other facets of our strategic plan; and changes in market liquidity conditions, credit ratings and other factors that may impact our access to future funding and the cost of debt.
These and other risks and uncertainties are discussed more fully in our Quarterly Report on Form 10-Q for the quarter ended January 31, 2024 and in Item 1A of our Annual Report on Form 10-K for the year ended July 31, 2023.
We disclaim any obligation or undertaking to disseminate any updates or revisions to any forward-looking statements contained in this release or to reflect any change in our expectations after the date hereof or any change in events, conditions or circumstances on which any statement is based, except as required by law.
| THOR INDUSTRIES, INC. AND SUBSIDIARIES |
| CONDENSED CONSOLIDATED STATEMENTS OF INCOME |
| FOR THETHREE AND SIX MONTHS ENDED JANUARY 31, 2024 AND 2023 |
| ($000’s except share and per share data) (Unaudited) |
| | | | | | | | | | | | | |
| | | Three Months Ended January 31, | | Six Months Ended January 31, |
| | | | 2024 | | % Net
Sales(1) | | | 2023 | | % Net
Sales(1) | | | 2024 | | % Net
Sales(1) | | | 2023 | | % Net
Sales(1) |
| | | | | | | | | | | | | |
| Net sales | | $ | 2,207,369 | | | | $ | 2,346,635 | | | | $ | 4,708,128 | | | | $ | 5,454,719 | | |
| | | | | | | | | | | | | |
| Gross profit | | $ | 270,847 | | 12.3 | % | | $ | 282,935 | | 12.1 | % | | $ | 628,779 | | 13.4 | % | | $ | 769,411 | | 14.1 | % |
| | | | | | | | | | | | | |
| Selling, general and administrative expenses | | | 220,125 | | 10.0 | % | | | 208,743 | | 8.9 | % | | | 438,021 | | 9.3 | % | | | 450,367 | | 8.3 | % |
| | | | | | | | | | | | | |
| Amortization of intangible assets | | | 32,464 | | 1.5 | % | | | 35,199 | | 1.5 | % | | | 64,808 | | 1.4 | % | | | 70,418 | | 1.3 | % |
| | | | | | | | | | | | | |
| Interest expense, net | | | 28,229 | | 1.3 | % | | | 25,633 | | 1.1 | % | | | 48,426 | | 1.0 | % | | | 48,440 | | 0.9 | % |
| | | | | | | | | | | | | |
| Other income, net | | | 16,865 | | 0.8 | % | | | 19,358 | | 0.8 | % | | | 1,952 | | — | % | | | 11,803 | | 0.2 | % |
| | | | | | | | | | | | | |
| Income before income taxes | | | 6,894 | | 0.3 | % | | | 32,718 | | 1.4 | % | | | 79,476 | | 1.7 | % | | | 211,989 | | 3.9 | % |
| | | | | | | | | | | | | |
| Income tax provision | | | 1,568 | | 0.1 | % | | | 6,912 | | 0.3 | % | | | 19,117 | | 0.4 | % | | | 48,760 | | 0.9 | % |
| | | | | | | | | | | | | |
| Net income | | | 5,326 | | 0.2 | % | | | 25,806 | | 1.1 | % | | | 60,359 | | 1.3 | % | | | 163,229 | | 3.0 | % |
| | | | | | | | | | | | | |
| Less: Net loss attributable to non-controlling interests | | | (1,891 | ) | (0.1 | )% | | | (1,274 | ) | (0.1 | )% | | | (423 | ) | — | % | | | (36 | ) | — | % |
| | | | | | | | | | | | | |
| Net income attributable to THOR Industries, Inc. | | $ | 7,217 | | 0.3 | % | | $ | 27,080 | | 1.2 | % | | $ | 60,782 | | 1.3 | % | | $ | 163,265 | | 3.0 | % |
| | | | | | | | | | | | | |
| Earnings per common share | | | | | | | | | | | | |
| Basic | | $ | 0.14 | | | | $ | 0.51 | | | | $ | 1.14 | | | | $ | 3.05 | | |
| Diluted | | $ | 0.13 | | | | $ | 0.50 | | | | $ | 1.13 | | | | $ | 3.03 | | |
| | | | | | | | | | | | | |
| Weighted-avg. common shares outstanding – basic | | | 53,322,504 | | | | | 53,518,878 | | | | | 53,309,169 | | | | | 53,587,646 | | |
| Weighted-avg. common shares outstanding – diluted | | | 53,650,583 | | | | | 53,810,910 | | | | | 53,752,150 | | | | | 53,869,830 | | |
| | | | | | | | | | | | | |
| (1)Percentages may not add due to rounding differences |
| SUMMARY CONDENSED CONSOLIDATED BALANCE SHEETS ($000’s) (Unaudited) |
| | | | | | | | | | | |
| | | January 31,
2024 | | July 31,
2023 | | | | January 31,
2024 | | July 31,
2023 |
| Cash and equivalents | | $ | 340,192 | | $ | 441,232 | | Current liabilities | | $ | 1,626,461 | | $ | 1,716,482 |
| Accounts receivable, net | | | 625,618 | | | 643,219 | | Long-term debt, net | | | 1,390,469 | | | 1,291,311 |
| Inventories, net | | | 1,776,268 | | | 1,653,070 | | Other long-term liabilities | | | 266,304 | | | 269,639 |
| Prepaid income taxes, expenses and other | | | 97,184 | | | 56,059 | | Stockholders’ equity | | | 3,942,595 | | | 3,983,398 |
| Total current assets | | | 2,839,262 | | | 2,793,580 | | | | | | |
| Property, plant & equipment, net | | | 1,382,227 | | | 1,387,808 | | | | | | |
| Goodwill | | | 1,787,761 | | | 1,800,422 | | | | | | |
| Amortizable intangible assets, net | | | 925,515 | | | 996,979 | | | | | | |
| Equity investments and other, net | | | 291,064 | | | 282,041 | | | | | | |
| Total | | $ | 7,225,829 | | $ | 7,260,830 | | | | $ | 7,225,829 | | $ | 7,260,830 |
Contact:
Michael Cieslak, CFA
mcieslak@thorindustries.com
(574) 294-7724
EXHIBIT 99.2

www.thorindustries.com SECOND QUARTER OF FISCAL 2024 FINANCIAL RESULTS

FORWARD - LOOKING STATEMENTS This presentation includes certain statements that are “forward - looking” statements within the meaning of the U . S . Private Securities Litigation Reform Act of 1995 , Section 27 A of the Securities Act of 1933 , as amended, and Section 21 E of the Securities Exchange Act of 1934 , as amended . These forward - looking statements are made based on management’s current expectations and beliefs regarding future and anticipated developments and their effects upon THOR, and inherently involve uncertainties and risks . These forward - looking statements are not a guarantee of future performance . We cannot assure you that actual results will not differ materially from our expectations . Factors which could cause materially different results include, among others : the impact of inflation on the cost of our products as well as on general consumer demand ; the effect of raw material and commodity price fluctuations, and/or raw material, commodity or chassis supply constraints ; the impact of war, military conflict, terrorism and/or cyber - attacks, including state - sponsored or ransom attacks ; the impact of sudden or significant adverse changes in the cost and/or availability of energy or fuel, including those caused by geopolitical events, on our costs of operation, on raw material prices, on our suppliers, on our independent dealers or on retail customers ; the dependence on a small group of suppliers for certain components used in production, including chassis ; interest rates and interest rate fluctuations and their potential impact on the general economy and, specifically, on our profitability and on our independent dealers and consumers ; the ability to ramp production up or down quickly in response to rapid changes in demand while also managing costs and market share ; the level and magnitude of warranty and recall claims incurred ; the ability of our suppliers to financially support any defects in their products ; legislative, regulatory and tax law (including recent and pending tax - law changes implementing new, widely adopted "Pillar II" tax principles) and/or policy developments including their potential impact on our independent dealers, retail customers or on our suppliers ; the costs of compliance with governmental regulation ; the impact of an adverse outcome or conclusion related to current or future litigation or regulatory investigations ; public perception of and the costs related to environmental, social and governance matters ; legal and compliance issues including those that may arise in conjunction with recently completed transactions ; lower consumer confidence and the level of discretionary consumer spending ; the impact of exchange rate fluctuations ; restrictive lending practices which could negatively impact our independent dealers and/or retail consumers ; management changes ; the success of new and existing products and services ; the ability to maintain strong brands and develop innovative products that meet consumer demands ; the ability to efficiently utilize existing production facilities ; changes in consumer preferences ; the risks associated with acquisitions, including : the pace and successful closing of an acquisition, the integration and financial impact thereof, the level of achievement of anticipated operating synergies from acquisitions, the potential for unknown or understated liabilities related to acquisitions, the potential loss of existing customers of acquisitions and our ability to retain key management personnel of acquired companies ; a shortage of necessary personnel for production and increasing labor costs and related employee benefits to attract and retain production personnel in times of high demand ; the loss or reduction of sales to key independent dealers, and stocking level decisions of our independent dealers ; disruption of the delivery of units to independent dealers or the disruption of delivery of raw materials, including chassis, to our facilities ; increasing costs for freight and transportation ; the ability to protect our information technology systems from data breaches, cyber - attacks and/or network disruptions ; asset impairment charges ; competition ; the impact of losses under repurchase agreements ; the impact of the strength of the U . S . dollar on international demand for products priced in U . S . dollars ; general economic, market, public health and political conditions in the various countries in which our products are produced and/or sold ; the impact of changing emissions and other related climate change regulations in the various jurisdictions in which our products are produced, used and/or sold ; changes to our investment and capital allocation strategies or other facets of our strategic plan ; and changes in market liquidity conditions, credit ratings and other factors that may impact our access to future funding and the cost of debt . These and other risks and uncertainties are discussed more fully in our Quarterly Report on Form 10 - Q for the quarter ended January 31 , 2024 and in Item 1 A of our Annual Report on Form 10 - K for the year ended July 31 , 2023 . We disclaim any obligation or undertaking to disseminate any updates or revisions to any forward - looking statements contained in this presentation or to reflect any change in our expectations after the date hereof or any change in events, conditions or circumstances on which any statement is based, except as required by law . 2

SECOND QUARTER FISCAL 2024 SUMMARY SECOND QUARTER FISCAL 2024 HIGHLIGHTS Financial performance reflects efforts to slow output to align wholesale shipments with retail demand and support independent dealers in managing inventory levels ▪ European segment continues to deliver solid year - over - year top and bottom - line growth driven by strong operating performance ▪ Positioning operating companies and independent dealers for successful spring selling season ▪ Channel inventory appropriately positioned ▪ Model year 2024 lineup aimed at meeting current demand ▪ Continued dealer focus on inventory management in the face of higher interest rates and inflationary pressures NET SALES BY SEGMENT NET SALES $2.21B (5.9)% (1) GROSS MARGIN 12.3% +20 bps (1) DILUTED EPS (2) $0.13 (74.0)% (1) Segment Net Sales Net Sales Change (1) North American Towable $731.0M (11.9)% North American Motorized $570.4M (22.8)% European $782.3M +20.9% (1) As compared to the second quarter of fiscal 2023 (2) Attributable to THOR Industries, Inc. 3

$2,874.4 $10,814.2 $6,056.9 $4,655.2 $948.1 $5,253.6 $10,442.9 $1,153.0 $784.4 $2,916.4 $4,232.5 $1,848.1 $1,072.7 $1,142.0 $2,644.2 $3,051.5 $3,055.7 $2,746.3 1/31/20 1/31/21 1/31/22 1/31/23 1/31/24 European $782.3 35.4% NA Motorized $570.4 25.8% NA Towable $731.0 33.1% Other $123.7 5.7% 115,200 78,100 112,000 87,800 1/31/20 NORTH AMERICAN INDEPENDENT DEALER INVENTORY OF THOR PRODUCTS 121,300 RV BACKLOG OF $4.66 BILLION (23.1)% (1) $17,726.9 Inventory Units (3) Includes units of Tiffin products subsequent to the December 2020 acquisition of the Tiffin Group NA Towables NA Motorized European (4) Includes Tiffin backlog subsequent to the December 2020 acquisition of the Tiffin Group (3) 1/31/24 (3) 1/31/23 $836.2 (4) SECOND QUARTER FISCAL 2024 RECAP GROSS MARGIN 12.3% +20 bps (1) DILUTED EPS (2) $0.13 (74.0)% (1) NET SALES $2.21 BILLION (5.9)% (1) (4) (3) 1/31/22 UNIT SHIPMENTS 39,476 +4.0% (1) (1) As compared to the second quarter of fiscal 2023 (2) Attributable to THOR Industries, Inc. 4 (4) (3) 1/31/21 NET SALES ($ millions) (4)

($ in Millions) Second Quarter Fiscal 2024 Net Sales YOY Change Gross Profit YOY Change Gross Profit Margin YOY Change $731.0 million (11.9)% $53.9 million 2.0% 7.4% +100 bps NORTH AMERICAN TOWABLE SEGMENT 5 Key Drivers ▪ Unit shipments increased 10 . 2 % primarily due to heightened demand for lower - cost travel trailer units, which increased 13 . 9 % over the prior - year period ▪ Disciplined wholesale production assisted independent dealers in maintaining appropriate channel inventory levels ahead of calendar 2024 selling season ▪ Overall net price per unit decreased 22 . 1 % primarily due to the combined impact of a shift in product mix toward travel trailers and more moderately - priced units ▪ Calendar year 2023 travel trailer and fifth wheel market share of 41 . 8 % ( - 20 bps y/y) ▪ Gross profit margin increase primarily driven by a decrease in the material cost percentage, due to the combined favorable impacts of product mix changes and cost - saving initiatives, partially offset by higher labor and manufacturing overhead percentages ▪ Order backlog of $ 836 . 2 million

($ in Millions) Second Quarter Fiscal 2024 Net Sales YOY Change Gross Profit YOY Change Gross Profit Margin YOY Change $570.4 million (22.8)% $60.7 million (43.4)% 10.6% (390) bps NORTH AMERICAN MOTORIZED SEGMENT 6 Key Drivers ▪ Unit shipments decreased 18 . 4 % due to a softening in current dealer and consumer demand in comparison with the demand in the prior - year quarter, which included independent dealer restocking of certain motorized products ▪ Disciplined wholesale production assisted independent dealers in maintaining appropriate channel inventory levels ahead of calendar 2024 selling season ▪ Calendar year 2023 market share of 48 . 7 % (+ 30 bps y/y) ▪ Gross profit margin decrease primarily driven by an increase in sales discounts and chassis costs as well as an increase in manufacturing overhead costs as a percentage of net sales due to the reduction in net sales ▪ Order backlog of $ 1 . 07 billion
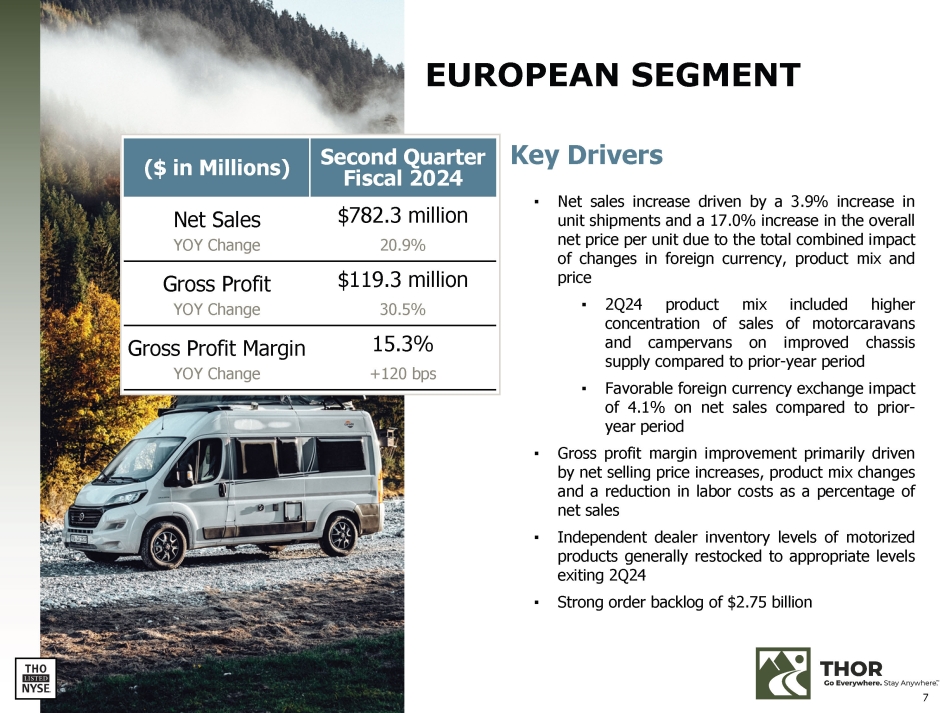
EUROPEAN SEGMENT Key Drivers ▪ Net sales increase driven by a 3 . 9 % increase in unit shipments and a 17 . 0 % increase in the overall net price per unit due to the total combined impact of changes in foreign currency, product mix and price ▪ 2Q24 product mix included higher concentration of sales and campervans on of motorcaravans improved chassis supply compared to prior - year period ▪ Favorable foreign currency exchange impact of 4 . 1 % on net sales compared to prior - year period ▪ Gross profit margin improvement primarily driven by net selling price increases, product mix changes and a reduction in labor costs as a percentage of net sales ▪ Independent dealer inventory levels of motorized products generally restocked to appropriate levels exiting 2 Q 24 ▪ Strong order backlog of $ 2 . 75 billion ($ in Millions) Second Quarter Fiscal 2024 Net Sales YOY Change Gross Profit YOY Change Gross Profit Margin YOY Change $782.3 million 20.9% $119.3 million 30.5% 15.3% +120 bps 7

NET DEBT / TTM EBITDA 1.5x NET DEBT / TTM ADJUSTED EBITDA 1.4x STRONG FINANCIAL POSITION ($ millions) $91.3 $185.3 $(103.9) $(44.2) FY24 YTD OPERATING CASH FLOW TOTAL LONG - TERM DEBT (1) ($ millions) LIQUIDITY (2) ($ millions) SELECTED FINANCIAL RATIOS (2) (3) TLB $807.6 Senior Unsecured Notes $500.0 ABL $59.6 Other $62.6 Total Long - Term Debt $1,429.8 Cash equivalents $340.2 8 Available credit under ABL $938.0 Total Liquidity $1,278.2 (1) Total gross debt obligations as of January 31, 2024 inclusive of the current portion of long - term debt (2) As of January 31, 2024 (3) See the Appendix to this presentation for reconciliation of non - GAAP measures to most directly comparable GAAP financial measures $78.9 2QFY23 FY23 YTD 2QFY24 Capital Expenditures ($ millions) $45.1 $101.0 $40.7

CAPITAL MANAGEMENT PRIORITIES AND FISCAL 2024 ACTIONS Invest in THOR’s business ▪ Capex spending of $78.9 million YTD Pay THOR's dividend ▪ Increased regular quarterly dividend to $0.48 in October 2023 ▪ Represents 14 th consecutive year of dividend increases Reduce the Company's debt obligations ▪ On November 15 , 2023 , entered into amendments to our term - loan credit facility to extend maturity from Feb . 2026 to Nov . 2030 and reduce the applicable margin used to determine the interest rate on the USD portion of the Term Loan B by 0 . 25 % ▪ Concurrently amended our ABL agreement to extend the maturity from Sept . 2026 to Nov . 2028 ▪ Committed to long - term net debt leverage ratio target of less than 1.0x; currently at 1.5x Repurchase shares on a strategic and opportunistic basis ▪ Repurchased $30.0 million YTD ▪ $461.2 million available to be repurchased as of January 31, 2024 under current authorizations Support opportunistic strategic investments 9

FULL - YEAR FISCAL 2024 GUIDANCE OUTLOOK ASSUMPTIONS ▪ Full - year fiscal 2024 outlook adjusted to reflect persisting macro pressures affecting North American independent dealers and consumers, resulting in reduced consolidated net sales and margin expectations as dealers are expected to maintain historically lean inventory levels ▪ While this will impact our earnings results in fiscal 2024 , we have strong confidence in our ability to deliver on our revised fiscal 2024 outlook ▪ North American industry wholesale shipment range between 330 , 000 and 340 , 000 units for fiscal 2024 , resulting in further destocking of channel inventory ( previous range of between 350 , 000 and 365 , 000 units ) ▪ While lowering wholesale shipment expectations, 2 H 24 reflects unit shipment growth and improved profitability within North American Towable segment on a year - over - year basis ▪ Continued strong financial performance in our European segment driven by sustained efforts of our management team, favorable price - cost realization and operational efficiencies ▪ Will face tougher year - over - year comparisons in 2 H 24 as we lap restocking volumes in 2 H 23 $ 10.0 – $ 10.5 B (previously $10.5 - $11.0B) NET SALES GROSS PROFIT MARGIN DILUTED EARNINGS PER SHARE 14.0 % – 14.5 % (previously 14.5% - 15.0%) $ 5.00 – $ 5.50 (previously $6.25 - $7.25) OTHER FULL - YEAR MODELING ASSUMPTIONS ▪ SG&A expense as a % of sales: >8.0% ▪ Capital expenditures: $180.0 million ▪ Amortization of intangible assets expense: $129.5 million ▪ Tax rate: between 22% and 24% (1) 10 (1) Before consideration of any discrete tax items

KEY TAKEAWAYS Managed production and wholesale shipments to reflect current cautious dealer outlook to better position THOR and its North American dealers with lean inventories of appropriate product ahead of the calendar 2024 selling season Continued strong financial performance in our European segment driven by sustained efforts of our management team, favorable price - cost realization, operational efficiencies and successful restocking of motorized products North American operating companies pursuing initiatives to enhance operations and through - cycle profitability, including brand and footprint rationalization, product portfolio optimization and cost management Full - year fiscal 2024 outlook adjusted, to reflect macro pressures affecting North American independent dealers and consumers, resulting in reduced consolidated net sales and margin expectations as dealers are expected to maintain historically lean inventory levels 11

APPENDIX 12

The Global RV Industry Leader THOR SNAPSHOT (1) (1) As of July 31, 2023 Founded 1980 Headquarters Elkhart, Indiana Countries with Distribution 25+ Team Members 24,900 Countries with Manufacturing 6 Facilities Worldwide >400 Independent Dealership Locations 3,500 NET SALES BY SEGMENT (1) NET SALES BY COUNTRY (1) United States, 66.9% Germany, 16.3% Other Europe, 11.0% Canada, 5.3% Other, 0.5% North American Towable 37.8% North American Motorized 29.8% European 27.3% Other, 5.1% EUROPEAN OTHER NORTH AMERICAN MOTORIZED NORTH AMERICAN TOWABLE 13
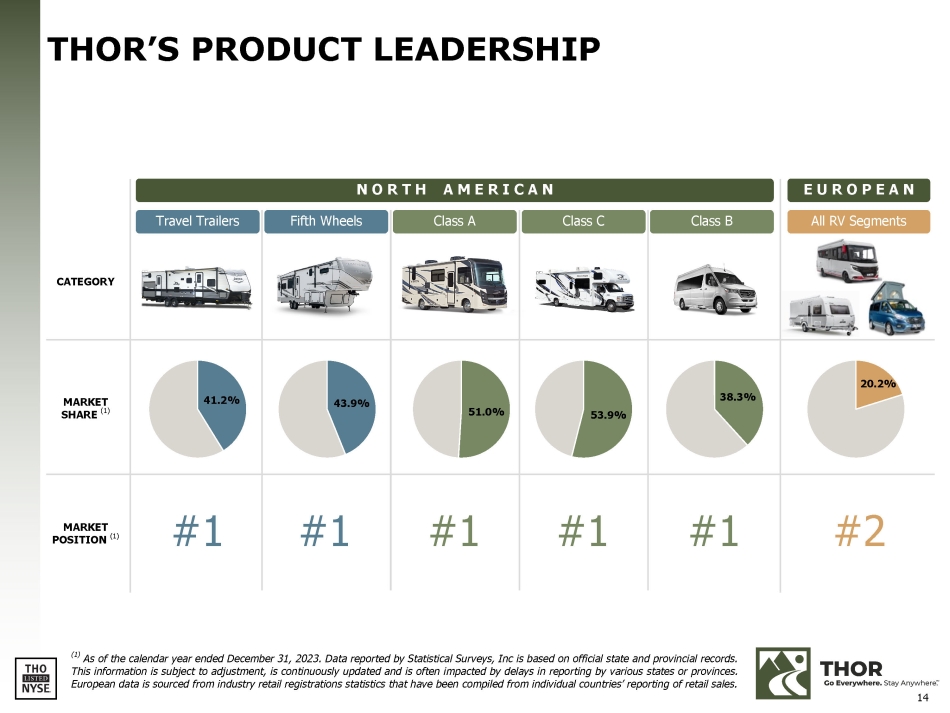
THOR’S PRODUCT LEADERSHIP ( 1 ) As of the calendar year ended December 31 , 2023 . Data reported by Statistical Surveys, Inc is based on official state and provincial records . This information is subject to adjustment, is continuously updated and is often impacted by delays in reporting by various states or provinces . European data is sourced from industry retail registrations statistics that have been compiled from individual countries’ reporting of retail sales . E U R O P E A N All RV Segments N O R T H A M E R I C A N CATEGORY Class B Class C Class A Fifth Wheels Travel Trailers 20.2% 38.3% 53.9% 51.0% 43.9% 41.2% MARKET SHARE (1) #2 #1 #1 #1 #1 #1 MARKET POSITION (1) 14

120.8 121.1 156.5 176.5 201.3 194.3 192.2 199.5 229.1 249.7 239.1 207.6 250.6 258.9 298.3 323.0 334.5 298.1 208.6 152.4 217.1 227.6 257.6 282.8 312.8 326.9 442.0 426.1 376.0 359.4 389.6 544.0 434.9 267.3 301.8 2024 2023 2022 2021 2020 2019 2018 2017 2016 2015 2014 2013 2012 2011 2010 2009 2008 2007 2006 2001 2002 2003 2004 2005 2000 1996 1997 1998 1999 1993 1994 1995 1990 1991 1992 (e) 173.1 163.1 203.4 227.8 259.5 247.2 247.5 254.6 292.7 321.2 300.1 256.8 311.0 320.9 370.0 384.5 390.4 353.5 237.0 165.6 242.3 252.4 285.7 321.1 430.7 356.7 374.2 504.6 483.7 406.1 430.4 600.2 493.3 313.2 350.1 2024 2023 2022 2021 2020 2019 2018 2017 2016 2015 2014 2013 2012 2011 2010 2009 2008 2007 2006 2005 2004 2000 2001 2002 2003 1996 1997 1998 1999 1993 1994 1995 1990 1991 1992 (e) TOWABLE RV WHOLESALE MARKET TRENDS (UNITS 000's) YTD Shipments (Units) Dec. 2023 313,174 Dec. 2022 493,268 Unit Change (180,094) % Change (36.5)% YTD Shipments (Units) Dec. 2023 267,295 Dec. 2022 434,858 Unit Change (167,563) % Change (38.5)% 52.3 41.9 46.9 51.3 58.2 52.8 55.3 55.1 63.5 71.5 61.0 49.2 60.4 62.0 71.7 61.4 55.8 55.4 28.4 13.2 25.2 24.8 28.2 38.3 44.0 47.3 54.7 62.6 57.6 46.6 40.8 56.2 58.4 45.9 48.3 1990 1991 1992 1993 1994 1995 1996 1997 1998 1999 2000 2001 2002 2003 2004 2005 2006 2007 2008 2009 2010 2011 2012 2013 2014 2015 2016 2017 2018 2019 2020 2021 2022 2023 2024 YTD Shipments (Units) % Change Unit Change Dec. 2022 Dec. 2023 (21.5)% (12,531) 58,410 45,879 Historical Data: Recreation Vehicle Industry Association (RVIA) RV INDUSTRY OVERVIEW North America RV WHOLESALE MARKET TRENDS (UNITS 000's) MOTORIZED RV WHOLESALE MARKET TRENDS (UNITS 000's) (e) Calendar year 2024 represents the most recent RVIA "most likely" estimate from their February 2024 issue of Roadsigns 15

Europe (1) Source : European Caravan Federation; Calendar years ended December 31, 2023 and 2022; European retail registration data available at www.CIVD.de % Change Total Calendar Year 2023 2022 % Change Motorcaravans Calendar Year 2023 2022 % Change Caravans Calendar Year 2023 2022 Country (0.7)% 90,985 90,365 3.0 % 66,507 68,469 (10.5)% 24,478 21,896 Germany (1.7)% 31,941 31,384 (2.7)% 24,611 23,936 1.6 % 7,330 7,448 France (1.1)% 25,707 25,412 3.3 % 11,823 12,219 (5.0)% 13,884 13,193 U.K. (11.7)% 10,206 9,011 (1.3)% 2,260 2,230 (14.7)% 7,946 6,781 Netherlands (0.9)% 8,940 8,859 1.6 % 7,165 7,279 (11.0)% 1,775 1,580 Switzerland (29.6)% 6,662 4,689 (23.5)% 3,498 2,676 (36.4)% 3,164 2,013 Sweden — % 6,487 6,484 0.1 % 5,828 5,833 (1.2)% 659 651 Italy (9.4)% 7,414 6,719 (6.8)% 6,108 5,693 (21.4)% 1,306 1,026 Belgium (5.3)% 6,902 6,536 (1.0)% 5,323 5,270 (19.8)% 1,579 1,266 Spain (14.4)% 24,105 20,631 (13.3)% 14,681 12,734 (16.2)% 9,424 7,897 All Others (4.2)% 219,349 210,090 (1.0)% 147,804 146,339 (10.9)% 71,545 63,751 Total The Company monitors retail trends in the European RV market as reported by the European Caravan Federation, whose industry data is reported to the public quarterly Industry wholesale shipment data for the European RV market is not available 201 192 146 138 135 140 143 152 162 166 174 182 198 203 210 208 189 154 150 156 147 137 140 152 168 190 202 211 236 261 219 210 144 141 170 162 151 182 217 222 219 220 253 272 274 251 274 292 324 320 310 366 289 206 228 247 264 304 333 376 416 471 465 522 493 570 449 379 North America 1990 1991 1992 1993 1994 1995 1996 1997 1998 1999 2000 2001 2002 2003 2004 2005 2006 2007 2008 2009 2010 2011 2012 2013 2014 2015 2016 2017 2018 2019 2020 2021 2022 2023 FULL - YEAR COMPARISON OF NEW VEHICLE REGISTRATIONS BY CONTINENT (UNITS 000's) (1) (2) RV INDUSTRY OVERVIEW Europe EUROPEAN INDUSTRY UNIT REGISTRATIONS BY COUNTRY (1) (2) Source : Statistical Surveys; North American retail registration data available at www.statisticalsurveys.com 16

17 Intention to RV is high Consumer satisfaction among RV owners is very strong RV Owner future purchase intent is high Interest in the RV lifestyle continues to exceed pre - pandemic levels 15 % CONSUMER TRENDS SUPPORT LONG - TERM RV INDUSTRY GROWTH Supported by Real Data from RVers 99 % 57% (1) SimilarWeb; U.S. data, only; (2) 2022 THOR North American Travel Trailer Study; (3) 2022 THOR North American Fifth Wheel Study; (4) 2023 THOR North American Class A RV Study; (5) 2022 THOR North American Class C RV Study; (6) RVshare the Road Ahead 2024 Travel Trend Report Edition 92 % of Travel Trailer Owners plan to purchase an RV in the future; intention is also high across RV types: Class A RV (93%), Camper Van (57%), Class C RV (96%), Fifth Wheel (95%) (2) (3) (4) (5) increase in RV OEM website traffic when comparing Jan 2024 to Jan 2020 RV Dealership (up 55%), Campground Booking (up 47%), and RV Rental (up 46%) websites also experienced increases (1) of Class C Owners report satisfaction with their units, while Class A RV (96%), Camper Van (97%), Travel Trailer (94%) and Fifth Wheel (96%) Owners also report strong satisfaction (2) (3) (4) (5) of U.S. travelers are planning a road trip or vacation in an RV within the next twelve months (6)

18 QUARTERLY EBITDA RECONCILIATION l Quarters TTM Fisca ($ in thousands) TTM 2QFY24 1QFY24 4QFY23 3QFY23 2QFY23 $ 271,370 $ 5,326 $ 55,033 $ 91,282 $ 119,729 $ 25,806 Net Income Add Back: 97,433 28,229 20,197 22,645 26,362 25,633 Interest Expense, Net (1) 95,470 1,568 17,549 40,631 35,722 6,912 Income Taxes 277,650 68,119 67,278 74,102 68,151 67,682 Depreciation and Amortization of Intangibles $ 741,923 $ 103,242 $ 160,057 $ 228,660 $ 249,964 $ 126,033 EBITDA Add Back: 42,275 9,246 10,452 12,905 9,672 8,543 Stock - Based Compensation Expense 8,852 (3,000) — 5,352 6,500 7,800 Change in LIFO Reserve Net (Income) Expense Related to Certain (16,939) (4,200) (10,000) (1,733) (1,006) (1,200) Contingent Liabilities 1,164 1,724 (979) 714 (295) (5,760) Non - Cash Foreign Currency Loss (Gain) Market Value Loss (Gain) on Equity 9,559 530 2,871 3,476 2,682 1,693 Investments 19,873 3,502 5,935 5,748 4,688 — Equity Method Investment Loss (Gain) 7,175 7,175 — — — — Debt Amendment Expenses (15,993) (9,533) (1,418) (5,042) — (3,984) Other Loss (Gain), Including Sales of Property, Plant and Equipment $ 797,889 $ 108,686 $ 166,918 $ 250,080 $ 272,205 $ 133,125 Adjusted EBITDA $ 10,375,014 $ 2,207,369 $ 2,500,759 $ 2,738,066 $ 2,928,820 $ 2,346,635 Net Sales 7.7 % 4.9 % 6.7 % 9.1 % 9.3 % 5.7 % Adjusted EBITDA Margin (%) Total Long - Term Debt as of January 31, 2024 (2) Less: Cash and Cash Equivalents Net Debt Net Debt / TTM EBITDA Net Debt / TTM Adjusted EBITDA $ 1,429,786 340,192 $ 1,089,594 1.5 x 1.4 x (1) Includes $7,566 of costs associated with the debt amendment as outlined in Note 12 of the 2Q24 Notes to the Condensed Consolidated Financial Statements (2) Total debt obligations as of January 31, 2024 inclusive of the current portion of long - term debt Adjusted EBITDA is a non - GAAP performance measure included to illustrate and improve comparability of the Company's results from period to period . Adjusted EBITDA is defined as net income before net interest expense, income tax expense and depreciation and amortization adjusted for certain items and other one - time items . The Company considers this non - GAAP measure in evaluating and managing the Company's operations and believes that discussion of results adjusted for these items is meaningful to investors because it provides a useful analysis of ongoing underlying operating trends . The adjusted measures are not in accordance with, nor are they a substitute for, GAAP measures, and they may not be comparable to similarly titled measures used by other companies .

www.thorindustries.com INVESTOR RELATIONS CONTACT Michael Cieslak, CFA mcieslak@thorindustries.com (574) 294 - 7724
Exhibit 99.3

SECOND QUARTER FISCAL 2024
INVESTOR QUESTIONS & ANSWERS
March 6, 2024
Forward-Looking Statements
Reference is made to the forward-looking statements disclosure provided
at the end of this document.
Executive Overview
Fiscal Second Quarter 2024 Highlights
| • | Consolidated net sales for the second quarter were $2.21 billion. |
| • | Consolidated gross profit margin for the second quarter was 12.3%. |
| • | Net income attributable to THOR Industries, Inc. and diluted earnings per share for the second quarter
of fiscal 2024 were $7.2 million and $0.13, respectively, inclusive of a $14.7 million charge related to the November 15, 2023 refinancing
of the Company’s debt facilities. |
| • | The Company revised its full-year fiscal 2024 consolidated net sales and diluted earnings per share guidance
to a consolidated net sales range of $10.0 billion to $10.5 billion and diluted earnings per share in the range of $5.00 to $5.50. |
Quick Reference to Contents
| Current Market Conditions and Outlook Assumptions |
1 |
| |
|
|
|
| Q&A |
|
| |
|
|
|
| |
|
Market Update |
3 |
| |
|
Operations Update |
4 |
| |
|
Financial Update |
6 |
| |
|
|
|
| Segment Data |
|
| |
|
|
|
| |
|
Summary of Key Quarterly Segment Data – North American Towable RVs |
8 |
| |
|
Summary of Key Quarterly Segment Data – North American Motorized RVs |
9 |
| |
|
Summary of Key Quarterly Segment Data – European RVs |
10 |
| |
|
|
|
| Forward-Looking Statements |
11 |
Current Market Conditions and Outlook Assumptions
| • | Market demand conditions in North America |
The RV industry’s calendar 2023 and early calendar 2024
retail sales have been negatively impacted by ongoing macroeconomic conditions faced by consumers and dealers, including ongoing high
inflation and interest rates. While near-term North American industry retail demand has significantly softened from the record calendar
2021 level and strong 2022 levels, we anticipate the recent softened demand to be temporary as interest in the RV lifestyle continues
to grow. We acknowledge that the temporary nature of the soft demand is directly tied to strong headwinds faced by consumers from the
current macroeconomic environment and expect that the softness will persist until those forces begin to ease. The Recreational Vehicle
Industry Association (“RVIA”) recently updated their wholesale unit shipments forecast for calendar 2024 to reflect the current
softness in market demand trends. The RVIA forecast currently projects that the industry will return to growth later in calendar 2024
with a North American wholesale shipment range of between 334,700 and 365,500 units, up from unit shipments in calendar 2023 of 313,174,
but lower than the record wholesale unit shipments in calendar 2021 of 600,240 and wholesale unit shipments in calendar 2022 of 493,268.
| • | Market demand conditions in Europe |
Similar to North America, European retail sales have been impacted
by current macroeconomic conditions. Despite persistent chassis supply constraints that limited the level of motorized product output
in calendar years 2021 through 2023, we have seen relative strength in retail registrations in Europe when compared to North America.
According to the European Caravan Foundation (“ECF”), total retail registrations in Europe for calendar 2023 only decreased
4.2% compared to calendar 2022. In Europe, we believe that independent dealer inventory levels of Erwin Hymer Group (“EHG”)
products have been restocked to normalized levels and are now generally appropriate for seasonal consumer demand moving into the peak
selling season.
Consolidated RV backlog was $4.66 billion as of January 31, 2024.
North American RV backlog was $1.91 billion as of January 31, 2024, a decrease of 36.4% compared to $3.00 billion as of January 31, 2023.
European RV backlog was $2.75 billion as of January 31, 2024, a decrease of 10.1% compared to $3.06 billion as of January 31, 2023.
| • | Near-term and long-term RV industry outlook in both North America and Europe |
The RV industry has experienced a slowdown in retail activity
as consumers have been adversely impacted by elevated unit prices, higher interest rates, and overall inflation impacting many facets
of their budgets. However, high RV utilization, strong show attendance and high repeat buyer intentions in the face of this decreasing
appetite to purchase in the short-term exhibits the resilience of consumer interest in the RV lifestyle in the long-term. While we remain
cautious and continue to expect near-term demand to be impacted by the current macroeconomic conditions, particularly in North America,
our long-term optimism remains undeterred. Based upon recent THOR and industry studies, we remain strongly optimistic about both the industry’s
and THOR’s future growth. This longer-term optimism is supported by data indicating interest in the RV lifestyle continues to exceed
pre-pandemic levels, RV utilization remaining high, consumer satisfaction among RV owners being very strong, and repeat buyer intentions
reaffirming the “stickiness” of the RV lifestyle.
Q&A
MARKET UPDATE
| 1. | How do you characterize the outlook and focus of your North American independent dealers? |
| a. | Overall, our North American independent dealers continue to be cautious in calendar 2024. Dealers, on
balance, have continued to experience year-over-year declines in retail sales activity in early calendar 2024. While retail shows and
lead generations continue to offer positive signals to independent dealers that retail demand may stabilize as we move through the selling
season, our dealers are understandably maintaining a conservative approach to inventory management entering the spring season. Given the
elevated floorplan interest costs and required curtailments, the recent focus of the dealer base has been to maximize cash flow and mitigate
the pressures caused by higher interest expense and aging of product. As such, even as our overall independent dealer base is currently
operating with historically lean inventory levels, we believe dealers will remain hesitant to hold any excess inventory until a sustained
positive inflection in retail demand takes hold. In the meantime, we expect to see the continuation of cautious ordering patterns in the
wholesale channel consisting of smaller, more frequent orders as dealers operate in a higher interest rate environment. In the longer
term, we view this as a positive development as we believe the proactive planning discussions taking place between our operating companies
and independent dealer partners will result in improved long-term profitability trends across the industry. The inherent consequence in
dealer prudence is a better position for THOR and the industry as we continue to work through the macroeconomic factors impacting our
industry. As those adverse factors clear, as they inevitably will, this prudence will position THOR to perform very well as the market
returns to growth. |
| 2. | What is your current near-term outlook on the North American retail demand environment? |
| a. | While we remain cautiously optimistic that retail demand will begin to stabilize
as we move through calendar 2024 as our industry recalibrates its pricing and product offerings to address affordability challenges and
consumers adjust to the macro environment, we are taking a more conservative approach to forecasting the balance of our fiscal
2024. North American retail activity continues to be challenged as a result of near-term macroeconomic pressures
adversely impacting consumer sentiment and demand. The combination of the delay in interest rate relief and continued year-over-year declines
in industry retail registrations to date has delayed the anticipated recovery from our expectations at the beginning of our fiscal year.
Because we do not assume any material relief from these macroeconomic pressures through the balance of fiscal 2024, our retail outlook
for fiscal 2024 currently assumes industry retail demand to be at the low end of our previously assumed range
of between 350,000 and 365,000 units. This forecast assumes narrowing year-over-year declines in retail registrations with the potential
for retail stabilization or growth as we progress through the selling season, albeit likely with some level of volatility. |
The forecast we issued at the beginning of the fiscal year anticipated
a slightly stronger retail performance in fiscal 2024. While the industry is currently showing signs of a gradual recovery, that positive
trend was delayed from our original expectations by approximately one quarter. While we acknowledge there is still a range of potential
retail sales scenarios, we remain fully confident that we will see a positive inflection in future retail demand once interest rates begin
to decline, as many expect, and near-term macroeconomic pressures subside.
OPERATIONS UPDATE
| 1. | Can you comment on second quarter production and the cadence of North American wholesale shipments
for the second half of fiscal 2024? |
| a. | As we communicated after our fiscal first quarter, the focus for the second fiscal quarter of 2024 was
to slow our production output through reduced production rates and extended holiday shutdowns to closely align wholesale shipments to
match retail demand. While orders were a bit softer than anticipated given slow retail activity on dealer lots, we did assist our independent
dealers in keeping channel inventory at historically low levels, restocking approximately only 4,000 units of THOR products in the fiscal
second quarter, a quarter that is traditionally a heavy channel replenishment period for our industry. As a result, North American dealer
inventory levels of THOR products approximated 87,800 units at January 31, 2024, up from the approximately 83,800 units at October 31,
2023 but down significantly from the approximately 121,300 units at January 31, 2023. |
Looking ahead to the back half of fiscal 2024, unit shipments
are expected to sequentially increase from the second quarter levels as we enter the spring selling season. However, even with current
dealer inventory at lean levels, our current expectation is for independent dealers to continue to further destock inventory levels as
they mitigate the impact of higher interest rates and continue to sell through non-current model year 2023 units. Furthermore, given the
continued near-term macro uncertainty, independent dealers have been intentional in their desire to maintain lean inventory levels ahead
of the model year 2025 changeover. As a result, while we expect a pronounced ramp up of wholesale shipments during the prime selling season,
we expect wholesale shipments to under-pace retail sales during the balance of our fiscal year.
For the full-year of fiscal 2024, we currently
forecast an industry wholesale shipment range of between 330,000 and 340,000 units, which implies
a further destocking of channel inventory against forecasted retail demand (previously assumed 1:1 wholesale to retail relationship).
Consistent with our approach through the current down cycle,
THOR operating companies will continue to manage production in a disciplined manner with a high level of conservatism. Our teams will
also continue to work closely with our dealer partners in monitoring retail demand to ensure we can respond quickly to shifts in market
demand and adjust our production plans appropriately.
| 2. | In North America, you have been operating in a down-cycle environment for over a full year now. Can
you speak to some of the levers and initiatives that THOR has undertaken? |
| a. | THOR’s market leadership position has been underpinned by its fast and flexible variable cost model
and long-term focus. During down cycles, THOR operates from a position of strength to adapt to evolving market conditions while staying
steadfast in its commitment to investing in its long-term growth. Below are a few of the focus areas where THOR has invested time and
effort during the current down cycle: |
Brand Rationalization and Footprint Optimization.
On a trailing twelve-month basis, North America industry wholesale shipments (excluding park models) have approximated 312,000 units,
down nearly 50% from the record levels set in calendar 2021. To adapt to a soft demand environment, THOR operating companies have proactively
reduced their manufacturing footprint as they rationalized the number of brands being produced. As a result of our companies’ collective
efforts, we have realized direct cost and overhead savings that will allow us to emerge from the current down cycle as a much leaner company
with a stronger margin profile.
As part of our brand rationalization and footprint efforts, Heartland
is a THOR company that has been going through a strategic repositioning phase as an operating company during the current down cycle. Heartland’s
performance has been impacted by the sudden decline of certain private label brands that were particularly vulnerable to the current challenging
market conditions. As it refocuses its efforts on brands that have long been associated with Heartland’s success, management has
worked to temporarily pare back Heartland’s operations to align with the current expectation that it will grow with future market
conditions. As part of this plan, Heartland has consolidated its footprint by half and has retired ten brands to date. Having recently
opened its new Sturgis, Michigan manufacturing facility, the company is also streamlining its processes aimed at becoming a leaner and
more focused company with a much-improved margin profile.
Supply Chain. While our North American OEM segments
reported year-over-year declines in net sales during the second fiscal quarter of 2024, one of our supply chain companies, namely Airxcel,
reported an increase in net sales reflective of the investments made in product development, facilities and personnel over the past year.
As a result of these efforts, Airxcel expects to generate new businesses across product lines and brands, with the majority set to begin
shipping in the spring of 2024 in conjunction with the commencement of model year 2025 production. In the meantime, Airxcel continues
to invest in production innovation with a pipeline of new core product line extensions and product categories expected to be launched
later in the calendar year.
Growing Airxcel’s business continues to be a key part to
our strategy to ensure a robust and competitive supply chain marketplace for RV OEMs. We continue to be encouraged by Airxcel’s
growth prospects moving forward.
Innovation. The THOR global innovation team was
expanded with a mission to identify, enhance, and create technical and business innovation to improve and expand the RVing experience
and create competitive advantage for our operating companies. Through in-house investments and partnerships, our global innovation team
continues to advance initiatives related to electrification, global connected vehicle platforms and digital customer experience and advanced
manufacturing engineering. We continue to believe our investments in innovation will further differentiate THOR as the market leader over
the long term.
| 3. | Can you comment on the second quarter fiscal 2024 performance and the outlook of THOR Industries’
European segment? |
| a. | The strong fiscal 2024 second quarter performance of our European segment once again demonstrated the
successful efforts of our European management team to implement strategies driving favorable price-cost realization and operational efficiencies.
In addition, improved chassis supply allowed us to complete the restocking of dealer inventory levels of motorized product. Despite overall
weak economic growth and macroeconomic uncertainty in Europe, overall European RV retail registrations decreased only 4.2% in calendar
2023 compared to calendar 2022. In Germany and France, our largest European markets, RV retail registrations decreased just 0.7% and 1.7%,
respectively, in calendar 2023. |
As we exit the second fiscal quarter, we regard dealer inventory
levels in our primary markets to be at normalized levels for the majority of our brands, and our order book remains at healthy levels
while also remaining significantly above historic normalized levels. While we expect wholesale shipments to be down on a year-over-year
basis in the second half of fiscal 2024 due to exceptionally strong comparisons from the prior year, we remain extremely pleased with
the continued efforts of our European team to strengthen its operations and profitability. Our European team continues to focus on product
innovation to gain market share and driving operating efficiencies across our manufacturing footprint in an effort to sustain the long-term
profitability profile of the European business. Additionally, similar to North America, we remain extremely optimistic around the long-term
growth opportunity in the European market. A recent study issued by GfK, the largest German market research organization, noted 14.2 million
Germans over the age of 18 can imagine going on holiday in a leisure vehicle at some point in the next five years – a figure that
represents nearly 25 percent of German adults. The study also found that in the coming year alone, 5.3 million Germans are considering
going on holiday in a caravan or motor caravan, highlighting the firm attachment consumers hold for the RV lifestyle.
FINANCIAL UPDATE
| 1. | Although second quarter fiscal 2024 North American Towable gross profit margin of 7.4% increased on
a year-over-year basis, it remains well below historical levels. What were the drivers of this result? What gross profit margin performance
do you expect to achieve in the second half of fiscal 2024? |
| a. | Similar to the prior-year period, our fiscal second
quarter presented a more challenging market environment than we had anticipated. Second quarter gross profit margin was once again
pressured by significantly lower sales levels, extended plant shutdowns and elevated
incentive support to our independent dealers. |
Our approach
to closely align wholesale production with the pace of softening retail sales through the traditionally slower winter retail season, combined
with a softer-than-expected order intake, resulted in second quarter North American Towable wholesale shipments of 21,958 units. While
the current quarter’s wholesale shipments marginally exceeded those of the prior year period, lower net sales, driven by lower model
year 2024 ASPs and a product mix trending toward lower-priced units, adversely impacted labor and overhead costs as a percentage of North
American Towable net sales in the current period. Despite the negative impact to the gross profit margin percentage, North American
Towable labor and overhead costs actually declined by $9.3 million on a year-over-year basis as manufacturing
footprint optimization and structural efficiency measures continue to take effect.
Additionally, in response to cash flow constraints confronting
dealers during the seasonally slowest retail period of the year and a competitive pricing environment, we proactively assisted our dealer
partners with elevated promotional and incentive support aimed at stimulating demand for and reducing non-current model year 2023 units
in the channel. While elevated incentive support negatively impacted second quarter gross profit margin, our proactive assistance further
right-sized the Company’s inventory mix in the field ahead of the selling season. These efforts position our operating companies
and dealer partners extremely well given the positive feedback on our model year
2024 product offering that is resonating with today’s more budget-conscious consumer.
Similar to fiscal 2023, we expect to see sequential gross margin
improvement as we look ahead to the second half of fiscal 2024. Seasonally higher production and sales levels, a healthy channel inventory
mix and a leaner cost structure position our North American Towable operating companies to realize improved bottom line performance in
the second half of fiscal 2024 compared to fiscal 2023. We are mindful that a level of incentives will be needed to support our dealers
in clearing aging model year 2023 units in a competitive pricing environment, but we expect a step-up in gross profit margin in the second
half of fiscal 2024 before a return to more normalized gross margin levels entering fiscal 2025.
| 2. | The Company revised full-year financial guidance for fiscal 2024 in its press release today. What are
the key assumptions driving your updated outlook? |
| a. | The Company revised its full-year fiscal 2024 guidance, which now includes: |
| • | Consolidated fiscal 2024 net sales in the range of $10.0 billion to $10.5 billion (previously $10.5
billion to $11.0 billion) |
| • | Consolidated gross profit margin for fiscal 2024 in the range of 14.0% to 14.5% (previously 14.5% to
15.0%) |
| • | Diluted earnings per share for fiscal 2024 in the range of $5.00 to $5.50 (previously $6.25 to $7.25) |
Consolidated Net Sales. As our independent dealer
partners and end consumers continue to navigate persistent macro pressures, namely higher interest rates, THOR remains focused on the
business in a disciplined manner that maximizes profitability across the business cycle. As a result, we lowered our full-year fiscal
2024 consolidated net sales target primarily to reflect our continued production discipline and focus on inventory management in our North
America segments. Despite our independent dealers currently operating with historically lean inventory levels, we expect to produce at
levels lower than retail demand in the near term as we believe dealers will remain hesitant to hold any excess inventory until a sustained
positive inflection in retail demand takes hold. Based on expectations of interest rate cuts in the second half of calendar 2024, and
in conjunction with the expected July 1st model year 2025 changeover for towable products, we currently feel the timing of
accelerating growth in wholesale shipments has shifted into our fiscal 2025. As a result, the Company’s North American operating
plan for fiscal 2024 was revised to reflect an industry wholesale shipment range of between 330,000 and 340,000 units with wholesale
shipments under pacing retail demand. In our European segment, our top-line continues to meet expectations given resilient retail activity
to date in our fiscal year. Despite solid retail demand, having completed restocking efforts in the second quarter of fiscal 2024, we
expect to return to a 1:1 wholesale-retail relationship and anticipate tougher year-over-year net sales comparisons in the second half
of fiscal 2024 as we lap restocking volumes in the second half of fiscal 2023.
Consolidated Gross Profit Margin. Given lower expected
unit shipments in North America, we also revised our consolidated gross profit margin to a range of 14.0% to 14.5% to reflect the impact
of lower-than-anticipated gross profit margins in the second quarter and operating leverage on reduced North America volumes in addition
to near-term continued elevated incentive support aimed at assisting North American independent dealers in clearing aging model year 2023
units in a competitive pricing environment. Finally, the aforementioned repositioning strategy at Heartland will present a modest headwind
impact to our North American Towable gross profit margin in the near term as it works to right size its business to current market demand.
In the longer term, we expect these efforts to drive stronger margins.
Similar to fiscal 2023, we expect our consolidated gross profit
margin to improve in the second half of fiscal 2024 based on improved industry fundamentals and solid operational and commercial execution.
Capital Expenditures and Innovation. While we remain
committed to making incremental investments in automation and innovation strategies to drive long-term growth, we are dialing back certain
projects with longer payback periods as well as other capital spend to reflect the shift of the market recovery. Our current estimate
of committed and internally approved capital spend for fiscal 2024 is $180 million, a decrease of $80.0 million from the original $260.0
million planned at the onset of fiscal 2024. Given the impact of operating leverage and incremental R&D expenses, we continue to expect
SG&A to exceed 8.0% of consolidated net sales.
Tax Rate. For fiscal 2024, we plan for our annual
effective income tax rate to remain essentially flat to fiscal 2023 with an estimated range between 22.0% and 24.0% before consideration
of any discrete tax items.
| 3. | The RVIA recently updated its calendar year 2024 wholesale shipment forecast for North America. Can
you reconcile the RVIA’s unit shipment forecast with your revised fiscal year 2024 wholesale shipment forecast? |
| a. | The Company’s North American operating plan for fiscal 2024 reflects an industry wholesale shipment
range of between 330,000 and 340,000 units. With a fiscal year end date of July 31, 2024, our forecast is closely aligned
with the higher end of the RVIA’s projected 12-month moving total unit shipment range of between 327,700 and 341,100 units at June
30, 2024. Similar to our forecast, the RVIA expects year-over-year unit shipment growth throughout calendar 2024 as the industry
enters its recovery and growth phase. |
Also, while we note that the exact timing of accelerating unit
shipment growth will ultimately depend on the timing of easing macroeconomic pressures, we are in agreement with the RVIA’s most
recent calendar year 2024 forecast.
Summary of Key Quarterly Segment Data – North American Towable RVs
Dollars are in thousands
| NET SALES: | |
Three Months Ended
January 31, 2024 | |
Three Months Ended
January 31, 2023 | |
% Change |
| North American Towable | |
| | | |
| | | |
| | |
| Travel Trailers | |
$ | 471,483 | | |
$ | 527,829 | | |
| (10.7 | ) |
| Fifth Wheels | |
| 259,485 | | |
| 301,922 | | |
| (14.1 | ) |
| Total North American Towable | |
$ | 730,968 | | |
$ | 829,751 | | |
| (11.9 | ) |
| # OF UNITS: | |
Three Months Ended
January 31, 2024 | |
Three Months Ended
January 31, 2023 | |
% Change |
| North American Towable | |
| | | |
| | | |
| | |
| Travel Trailers | |
| 17,652 | | |
| 15,494 | | |
| 13.9 | |
| Fifth Wheels | |
| 4,306 | | |
| 4,440 | | |
| (3.0 | ) |
| Total North American Towable | |
| 21,958 | | |
| 19,934 | | |
| 10.2 | |
| ORDER BACKLOG | |
As of
January 31, 2024 | |
As of
January 31, 2023 | |
% Change |
| North American Towable | |
$ | 836,202 | | |
$ | 1,152,991 | | |
| (27.5 | ) |
| TOWABLE RV MARKET SHARE SUMMARY (1) | |
Calendar Years Ended December 31, | |
|
|
|
|
| | |
| 2023 | | |
| 2022 | |
|
|
|
|
| U.S. Market | |
| 40.5 | % | |
| 40.9 | % |
|
|
|
|
| Canadian Market | |
| 41.7 | % | |
| 41.4 | % |
|
|
|
|
| Combined North American Market | |
| 40.6 | % | |
| 40.9 | % |
|
|
|
|
(1) Source: Statistical Surveys, Inc., Calendar years ended
December 31, 2023 and 2022.
Note: Data reported by Stat Surveys is based on official state and provincial
records. This information is subject to adjustment, is continuously updated, and is often impacted by delays in reporting by various states
or provinces.
Summary of Key Quarterly Segment Data – North American Motorized
RVs
Dollars are in thousands
| NET SALES: | |
Three Months Ended
January 31, 2024 | |
Three Months Ended
January 31, 2023 | |
% Change |
| North American Motorized | |
| | | |
| | | |
| | |
| Class A | |
$ | 178,308 | | |
$ | 244,128 | | |
| (27.0 | ) |
| Class C | |
| 275,632 | | |
| 334,911 | | |
| (17.7 | ) |
| Class B | |
| 116,484 | | |
| 159,544 | | |
| (27.0 | ) |
| Total North American Motorized | |
$ | 570,424 | | |
$ | 738,583 | | |
| (22.8 | ) |
| # OF UNITS: | |
Three Months Ended
January 31, 2024 | |
Three Months Ended
January 31, 2023 | |
% Change |
| North American Motorized | |
| | | |
| | | |
| | |
| Class A | |
| 875 | | |
| 1,194 | | |
| (26.7 | ) |
| Class C | |
| 2,539 | | |
| 2,935 | | |
| (13.5 | ) |
| Class B | |
| 1,024 | | |
| 1,309 | | |
| (21.8 | ) |
| Total North American Motorized | |
| 4,438 | | |
| 5,438 | | |
| (18.4 | ) |
| ORDER BACKLOG | |
As of
January 31, 2024 | |
As of
January 31, 2023 | |
% Change |
| North American Motorized | |
$ | 1,072,687 | | |
$ | 1,848,124 | | |
| (42.0 | ) |
| MOTORIZED RV MARKET SHARE SUMMARY (1) | |
Calendar Years Ended December 31, |
|
|
|
|
| | |
2023 | |
2022 |
|
|
|
|
| U.S. Market | |
| 48.5 | % | |
| 48.2 | % |
|
|
|
|
| Canadian Market | |
| 51.6 | % | |
| 51.1 | % |
|
|
|
|
| Combined North American Market | |
| 48.7 | % | |
| 48.4 | % |
|
|
|
|
(1) Source: Statistical Surveys, Inc., Calendar years ended
December 31, 2023 and 2022.
Note: Data reported by Stat Surveys is based on official state and provincial
records. This information is subject to adjustment, is continuously updated and is often impacted by delays in reporting by various states
or provinces.
Summary of Key Quarterly Segment Data – European RVs
Dollars are in thousands
| NET SALES: | |
Three Months Ended
January 31, 2024 | |
Three Months Ended
January 31, 2023 | |
% Change |
| European | |
| | | |
| | | |
| | |
| Motorcaravan | |
$ | 424,813 | | |
$ | 267,782 | | |
| 58.6 | |
| Campervan | |
| 244,724 | | |
| 227,136 | | |
| 7.7 | |
| Caravan | |
| 51,087 | | |
| 94,494 | | |
| (45.9 | ) |
| Other | |
| 61,670 | | |
| 57,526 | | |
| 7.2 | |
| Total European | |
$ | 782,294 | | |
$ | 646,938 | | |
| 20.9 | |
| # OF UNITS: | |
Three Months Ended
January 31, 2024 | |
Three Months Ended
January 31, 2023 | |
% Change |
| European | |
| | | |
| | | |
| | |
| Motorcaravan | |
| 5,563 | | |
| 3,632 | | |
| 53.2 | |
| Campervan | |
| 5,382 | | |
| 4,826 | | |
| 11.5 | |
| Caravan | |
| 2,135 | | |
| 4,130 | | |
| (48.3 | ) |
| Total European | |
| 13,080 | | |
| 12,588 | | |
| 3.9 | |
| ORDER BACKLOG | |
As of
January 31, 2024 | |
As of
January 31, 2023 | |
% Change |
| European | |
$ | 2,746,307 | | |
$ | 3,055,738 | | |
| (10.1 | ) |
| EUROPEAN RV MARKET SHARE SUMMARY (1) | |
Calendar Years Ended December 31, |
|
|
|
|
| | |
2023 | |
2022 |
|
|
|
|
| Motorcaravan and Campervan (2) | |
| 20.9 | % | |
| 21.1 | % |
|
|
|
|
| Caravan | |
| 18.2 | % | |
| 18.5 | % |
|
|
|
|
(1) Sources: Caravaning Industry Association e.V. (“CIVD”)
and European Caravan Federation (“ECF”), Calendar years ended December 31, 2023 and 2022.
Data from the ECF is subject to adjustment, continuously updated and is often impacted by delays in reporting by various countries (some
countries, including the United Kingdom, do not report OEM-specific data and are thus excluded from the market share calculation).
(2) The CIVD and ECF report motorcaravans and campervans together.
Note: Industry wholesale shipment data for the European RV market is not
available.
Forward-Looking Statements
This release includes certain statements that are “forward-looking”
statements within the meaning of the U.S. Private Securities Litigation Reform Act of 1995, Section 27A of the Securities Act of 1933,
as amended, and Section 21E of the Securities Exchange Act of 1934, as amended. These forward-looking statements are made based on management’s
current expectations and beliefs regarding future and anticipated developments and their effects upon THOR, and inherently involve uncertainties
and risks. These forward-looking statements are not a guarantee of future performance. We cannot assure you that actual results will not
differ materially from our expectations. Factors which could cause materially different results include, among others: the impact of inflation
on the cost of our products as well as on general consumer demand; the effect of raw material and commodity price fluctuations, and/or
raw material, commodity or chassis supply constraints; the impact of war, military conflict, terrorism and/or cyber-attacks, including
state-sponsored or ransom attacks; the impact of sudden or significant adverse changes in the cost and/or availability of energy or fuel,
including those caused by geopolitical events, on our costs of operation, on raw material prices, on our suppliers, on our independent
dealers or on retail customers; the dependence on a small group of suppliers for certain components used in production, including chassis;
interest rates and interest rate fluctuations and their potential impact on the general economy and, specifically, on our profitability
and on our independent dealers and consumers; the ability to ramp production up or down quickly in response to rapid changes in demand
while also managing costs and market share; the level and magnitude of warranty and recall claims incurred; the ability of our suppliers
to financially support any defects in their products; legislative, regulatory and tax law (including recent and pending tax-law changes
implementing new, widely adopted "Pillar II" tax principles) and/or policy developments including their potential impact on
our independent dealers, retail customers or on our suppliers; the costs of compliance with governmental regulation; the impact of an
adverse outcome or conclusion related to current or future litigation or regulatory investigations; public perception of and the costs
related to environmental, social and governance matters; legal and compliance issues including those that may arise in conjunction with
recently completed transactions; lower consumer confidence and the level of discretionary consumer spending; the impact of exchange rate
fluctuations; restrictive lending practices which could negatively impact our independent dealers and/or retail consumers; management
changes; the success of new and existing products and services; the ability to maintain strong brands and develop innovative products
that meet consumer demands; the ability to efficiently utilize existing production facilities; changes in consumer preferences; the risks
associated with acquisitions, including: the pace and successful closing of an acquisition, the integration and financial impact thereof,
the level of achievement of anticipated operating synergies from acquisitions, the potential for unknown or understated liabilities related
to acquisitions, the potential loss of existing customers of acquisitions and our ability to retain key management personnel of acquired
companies; a shortage of necessary personnel for production and increasing labor costs and related employee benefits to attract and retain
production personnel in times of high demand; the loss or reduction of sales to key independent dealers, and stocking level decisions
of our independent dealers; disruption of the delivery of units to independent dealers or the disruption of delivery of raw materials,
including chassis, to our facilities; increasing costs for freight and transportation; the ability to protect our information technology
systems from data breaches, cyber-attacks and/or network disruptions; asset impairment charges; competition; the impact of losses under
repurchase agreements; the impact of the strength of the U.S. dollar on international demand for products priced in U.S. dollars; general
economic, market, public health and political conditions in the various countries in which our products are produced and/or sold; the
impact of changing emissions and other related climate change regulations in the various jurisdictions in which our products are produced,
used and/or sold; changes to our investment and capital allocation strategies or other facets of our strategic plan; and changes in market
liquidity conditions, credit ratings and other factors that may impact our access to future funding and the cost of debt.
These and other risks and uncertainties are discussed more fully in our
Quarterly Report on Form 10-Q for the quarter ended January 31, 2024 and in Item 1A of our Annual Report on Form 10-K for the year ended
July 31, 2023.
We disclaim any obligation or undertaking to disseminate any updates or
revisions to any forward-looking statements contained in this release or to reflect any change in our expectations after the date hereof
or any change in events, conditions or circumstances on which any statement is based, except as required by law.
11
v3.24.0.1
| X |
- DefinitionBoolean flag that is true when the XBRL content amends previously-filed or accepted submission.
| Name: |
dei_AmendmentFlag |
| Namespace Prefix: |
dei_ |
| Data Type: |
xbrli:booleanItemType |
| Balance Type: |
na |
| Period Type: |
duration |
|
| X |
- DefinitionFor the EDGAR submission types of Form 8-K: the date of the report, the date of the earliest event reported; for the EDGAR submission types of Form N-1A: the filing date; for all other submission types: the end of the reporting or transition period. The format of the date is YYYY-MM-DD.
| Name: |
dei_DocumentPeriodEndDate |
| Namespace Prefix: |
dei_ |
| Data Type: |
xbrli:dateItemType |
| Balance Type: |
na |
| Period Type: |
duration |
|
| X |
- DefinitionThe type of document being provided (such as 10-K, 10-Q, 485BPOS, etc). The document type is limited to the same value as the supporting SEC submission type, or the word 'Other'.
| Name: |
dei_DocumentType |
| Namespace Prefix: |
dei_ |
| Data Type: |
dei:submissionTypeItemType |
| Balance Type: |
na |
| Period Type: |
duration |
|
| X |
- DefinitionAddress Line 1 such as Attn, Building Name, Street Name
| Name: |
dei_EntityAddressAddressLine1 |
| Namespace Prefix: |
dei_ |
| Data Type: |
xbrli:normalizedStringItemType |
| Balance Type: |
na |
| Period Type: |
duration |
|
| X |
- Definition
+ References
+ Details
| Name: |
dei_EntityAddressCityOrTown |
| Namespace Prefix: |
dei_ |
| Data Type: |
xbrli:normalizedStringItemType |
| Balance Type: |
na |
| Period Type: |
duration |
|
| X |
- DefinitionCode for the postal or zip code
| Name: |
dei_EntityAddressPostalZipCode |
| Namespace Prefix: |
dei_ |
| Data Type: |
xbrli:normalizedStringItemType |
| Balance Type: |
na |
| Period Type: |
duration |
|
| X |
- DefinitionName of the state or province.
| Name: |
dei_EntityAddressStateOrProvince |
| Namespace Prefix: |
dei_ |
| Data Type: |
dei:stateOrProvinceItemType |
| Balance Type: |
na |
| Period Type: |
duration |
|
| X |
- DefinitionA unique 10-digit SEC-issued value to identify entities that have filed disclosures with the SEC. It is commonly abbreviated as CIK. Reference 1: http://www.xbrl.org/2003/role/presentationRef
-Publisher SEC
-Name Exchange Act
-Number 240
-Section 12
-Subsection b-2
| Name: |
dei_EntityCentralIndexKey |
| Namespace Prefix: |
dei_ |
| Data Type: |
dei:centralIndexKeyItemType |
| Balance Type: |
na |
| Period Type: |
duration |
|
| X |
- DefinitionIndicate if registrant meets the emerging growth company criteria. Reference 1: http://www.xbrl.org/2003/role/presentationRef
-Publisher SEC
-Name Exchange Act
-Number 240
-Section 12
-Subsection b-2
| Name: |
dei_EntityEmergingGrowthCompany |
| Namespace Prefix: |
dei_ |
| Data Type: |
xbrli:booleanItemType |
| Balance Type: |
na |
| Period Type: |
duration |
|
| X |
- DefinitionCommission file number. The field allows up to 17 characters. The prefix may contain 1-3 digits, the sequence number may contain 1-8 digits, the optional suffix may contain 1-4 characters, and the fields are separated with a hyphen.
| Name: |
dei_EntityFileNumber |
| Namespace Prefix: |
dei_ |
| Data Type: |
dei:fileNumberItemType |
| Balance Type: |
na |
| Period Type: |
duration |
|
| X |
- DefinitionTwo-character EDGAR code representing the state or country of incorporation.
| Name: |
dei_EntityIncorporationStateCountryCode |
| Namespace Prefix: |
dei_ |
| Data Type: |
dei:edgarStateCountryItemType |
| Balance Type: |
na |
| Period Type: |
duration |
|
| X |
- DefinitionThe exact name of the entity filing the report as specified in its charter, which is required by forms filed with the SEC. Reference 1: http://www.xbrl.org/2003/role/presentationRef
-Publisher SEC
-Name Exchange Act
-Number 240
-Section 12
-Subsection b-2
| Name: |
dei_EntityRegistrantName |
| Namespace Prefix: |
dei_ |
| Data Type: |
xbrli:normalizedStringItemType |
| Balance Type: |
na |
| Period Type: |
duration |
|
| X |
- DefinitionThe Tax Identification Number (TIN), also known as an Employer Identification Number (EIN), is a unique 9-digit value assigned by the IRS. Reference 1: http://www.xbrl.org/2003/role/presentationRef
-Publisher SEC
-Name Exchange Act
-Number 240
-Section 12
-Subsection b-2
| Name: |
dei_EntityTaxIdentificationNumber |
| Namespace Prefix: |
dei_ |
| Data Type: |
dei:employerIdItemType |
| Balance Type: |
na |
| Period Type: |
duration |
|
| X |
- DefinitionLocal phone number for entity.
| Name: |
dei_LocalPhoneNumber |
| Namespace Prefix: |
dei_ |
| Data Type: |
xbrli:normalizedStringItemType |
| Balance Type: |
na |
| Period Type: |
duration |
|
| X |
- DefinitionBoolean flag that is true when the Form 8-K filing is intended to satisfy the filing obligation of the registrant as pre-commencement communications pursuant to Rule 13e-4(c) under the Exchange Act. Reference 1: http://www.xbrl.org/2003/role/presentationRef
-Publisher SEC
-Name Exchange Act
-Number 240
-Section 13e
-Subsection 4c
| Name: |
dei_PreCommencementIssuerTenderOffer |
| Namespace Prefix: |
dei_ |
| Data Type: |
xbrli:booleanItemType |
| Balance Type: |
na |
| Period Type: |
duration |
|
| X |
- DefinitionBoolean flag that is true when the Form 8-K filing is intended to satisfy the filing obligation of the registrant as pre-commencement communications pursuant to Rule 14d-2(b) under the Exchange Act. Reference 1: http://www.xbrl.org/2003/role/presentationRef
-Publisher SEC
-Name Exchange Act
-Number 240
-Section 14d
-Subsection 2b
| Name: |
dei_PreCommencementTenderOffer |
| Namespace Prefix: |
dei_ |
| Data Type: |
xbrli:booleanItemType |
| Balance Type: |
na |
| Period Type: |
duration |
|
| X |
- DefinitionTitle of a 12(b) registered security. Reference 1: http://www.xbrl.org/2003/role/presentationRef
-Publisher SEC
-Name Exchange Act
-Number 240
-Section 12
-Subsection b
| Name: |
dei_Security12bTitle |
| Namespace Prefix: |
dei_ |
| Data Type: |
dei:securityTitleItemType |
| Balance Type: |
na |
| Period Type: |
duration |
|
| X |
- DefinitionName of the Exchange on which a security is registered. Reference 1: http://www.xbrl.org/2003/role/presentationRef
-Publisher SEC
-Name Exchange Act
-Number 240
-Section 12
-Subsection d1-1
| Name: |
dei_SecurityExchangeName |
| Namespace Prefix: |
dei_ |
| Data Type: |
dei:edgarExchangeCodeItemType |
| Balance Type: |
na |
| Period Type: |
duration |
|
| X |
- DefinitionBoolean flag that is true when the Form 8-K filing is intended to satisfy the filing obligation of the registrant as soliciting material pursuant to Rule 14a-12 under the Exchange Act. Reference 1: http://www.xbrl.org/2003/role/presentationRef
-Publisher SEC
-Name Exchange Act
-Section 14a
-Number 240
-Subsection 12
| Name: |
dei_SolicitingMaterial |
| Namespace Prefix: |
dei_ |
| Data Type: |
xbrli:booleanItemType |
| Balance Type: |
na |
| Period Type: |
duration |
|
| X |
- DefinitionTrading symbol of an instrument as listed on an exchange.
| Name: |
dei_TradingSymbol |
| Namespace Prefix: |
dei_ |
| Data Type: |
dei:tradingSymbolItemType |
| Balance Type: |
na |
| Period Type: |
duration |
|
| X |
- DefinitionBoolean flag that is true when the Form 8-K filing is intended to satisfy the filing obligation of the registrant as written communications pursuant to Rule 425 under the Securities Act. Reference 1: http://www.xbrl.org/2003/role/presentationRef
-Publisher SEC
-Name Securities Act
-Number 230
-Section 425
| Name: |
dei_WrittenCommunications |
| Namespace Prefix: |
dei_ |
| Data Type: |
xbrli:booleanItemType |
| Balance Type: |
na |
| Period Type: |
duration |
|
Thor Industries (NYSE:THO)
Historical Stock Chart
From Mar 2024 to Apr 2024

Thor Industries (NYSE:THO)
Historical Stock Chart
From Apr 2023 to Apr 2024
