false
0000813762
0000813762
2023-11-13
2023-11-13
iso4217:USD
xbrli:shares
iso4217:USD
xbrli:shares
UNITED STATES SECURITIES AND EXCHANGE COMMISSION
Washington, D.C. 20549
FORM 8-K
CURRENT REPORT
Pursuant to Section 13 or 15(d) of the Securities
Exchange Act of 1934
Date of Report (Date of Earliest Event Reported):
November 13, 2023
| (Commission
File Number) |
(Exact
Name of Registrant as Specified in Its Charter)
(Address of Principal Executive Offices) (Zip Code)
(Telephone Number) |
(State or Other
Jurisdiction of
Incorporation or
Organization) |
(IRS
Employer
Identification
No.) |
| 1-9516 |
ICAHN
ENTERPRISES L.P.
16690
Collins Avenue, PH-1
Sunny
Isles Beach, FL
33160
(305)
422-4100 |
Delaware |
13-3398766 |
(Former Name or Former Address, if Changed Since
Last Report)
N/A
Check the appropriate box below if the Form 8-K
filing is intended to simultaneously satisfy the filing obligation of the registrant under any of the following provisions:
| ¨ |
Written communication pursuant to Rule 425 under the
Securities Act (17 CFR 230.425) |
| |
|
| ¨ |
Soliciting material pursuant to Rule 14a-12 under the
Exchange Act (17 CFR 240.14a-12) |
| |
|
| ¨ |
Pre-commencement communications pursuant to Rule 14d-2(b)
under the Exchange Act (17 CFR 240.14d-2(b)) |
| |
|
| ¨ |
Pre-commencement communications pursuant to Rule 13e-4(c)
under the Exchange Act (17 CFR 240.13e-4(c)) |
Securities registered pursuant to Section 12(b) of the Act:
| Title
of Each Class |
|
Trading
Symbol(s) |
|
Name
of Each Exchange on Which Registered |
| Depositary
Units of Icahn Enterprises L.P. Representing Limited Partner Interests |
|
IEP |
|
Nasdaq Global Select Market |
Indicate
by check mark whether the registrant is an emerging growth company as defined in Rule 405 of the Securities Act of 1933 or Rule 12b-2
of the Securities Exchange Act of 1934. Emerging Growth Company ¨
If
an emerging growth company, indicate by check mark if the registrant has elected not to use the extended transition period for complying
with any new or revised financial accounting standards provided pursuant to Section 13(a) of the Exchange Act. ¨
Item 7.01 Regulation FD Disclosure.
Icahn Enterprises L.P. has
attached hereto as Exhibit 99.1 a copy of updated presentation materials that it intends to use in connection with meetings with
investors, groups of investors and media and in connection with presentations and speeches to various audiences.
The information contained
in this Item 7.01 and Exhibit 99.1 is being furnished and shall not be deemed “filed” for purposes of Section 18
of the Securities Exchange Act of 1934, as amended, or otherwise subject to the liabilities of that section. In addition, the information
contained in this Item 7.01 and Exhibit 99.1 shall not be incorporated by reference into any of Icahn Enterprises L.P.’s filings
with the Securities and Exchange Commission or any other document except as shall be expressly set forth by specific reference in such
filing or document.
Item 9.01 Financial Statements and Exhibits.
(d) Exhibits
99.1 – Presentation Materials.
104 – Cover
Page Interactive Data File (formatted in Inline XBRL in Exhibit 101).
SIGNATURES
Pursuant to the requirements of the Securities Exchange
Act of 1934, the Registrant has duly caused this report to be signed on its behalf by the undersigned hereunto duly authorized.
| |
ICAHN ENTERPRISES L.P. |
|
| |
|
(Registrant) |
|
| |
|
|
|
| |
By: |
Icahn Enterprises G.P. Inc.,
its general partner
|
|
| |
|
|
|
| |
By: |
/s/ Ted Papapostolou |
|
| |
|
Ted Papapostolou |
|
| |
|
Chief Financial Officer |
|
Date: November 13, 2023
Exhibit 99.1

Icahn Enterprises L.P. Investor Presentation November 2023

2 Forward - Looking Statements and Non - GAAP Financial Measures Forward - Looking Statements This presentation contains certain statements that are, or may be deemed to be, “forward - looking statements” within the meaning of Section 27 A of the Securities Act of 1933 , as amended, and Section 21 E of the Securities Exchange Act of 1934 , as amended . All statements included herein, other than statements that relate solely to historical fact, are “forward - looking statements . ” Such statements include, but are not limited to, any statement that may predict, forecast, indicate or imply future results, performance, achievements or events, or any statement that may relate to strategies, plans or objectives for, or potential results of, future operations, financial results, financial condition, business prospects, growth strategy or liquidity, and are based upon management’s current plans and beliefs or current estimates of future results or trends . Forward - looking statements can generally be identified by phrases such as “believes,” “expects,” “potential,” “continues,” “may,” “should,” “seeks,” “predicts,” “anticipates,” “intends,” “projects,” “estimates,” “plans,” “could,” “designed,” “should be” and other similar expressions that denote expectations of future or conditional events rather than statements of fact . Our expectations, beliefs and projections are expressed in good faith, and we believe that there is a reasonable basis for them . However, there can be no assurance that these expectations, beliefs and projections will result or be achieved . There are a number of risks and uncertainties that could cause our actual results to differ materially from the forward - looking statements contained in this presentation, including risks related to economic downturns, substantial competition and rising operating costs ; the impacts from the Russia/Ukraine conflict and conflict in the Middle East, including economic volatility and the impacts of export controls and other economic sanctions ; risks related to our investment activities, including the nature of the investments made by the private funds in which we invest, declines in the fair value of our investments as a result of the COVID - 19 pandemic, losses in the private funds and loss of key employees ; risks related to our ability to continue to conduct our activities in a manner so as to not be deemed an investment company under the Investment Company Act of 1940 , as amended, or be taxed as a corporation ; risks relating to short sellers and associated litigation and regulatory inquires ; risks related to our general partner and controlling unitholder ; risks related to our energy business, including the volatility and availability of crude oil, other feed stocks and refined products, declines in global demand for crude oil, refined products and liquid transportation fuels, unfavorable refining margin (crack spread), interrupted access to pipelines, significant fluctuations in nitrogen fertilizer demand in the agricultural industry and seasonality of results ; the success of a spin - off of the fertilizer business including risks related to any decision to cease exploration of a spin - off ; risks related to our automotive activities and exposure to adverse conditions in the automotive industry, including as a result of the COVID - 19 pandemic and the Chapter 11 filing of our automotive parts subsidiary ; risks related to our food packaging activities, including competition from better capitalized competitors, inability of our suppliers to timely deliver raw materials, and the failure to effectively respond to industry changes in casings technology ; supply chain issues ; inflation, including increased costs of raw materials and shipping, including as a result of the Russia/Ukraine conflict ; interest rate increases ; labor shortages and workforce availability ; risks related to our real estate activities, including the extent of any tenant bankruptcies and insolvencies ; risks related to our home fashion operations, including changes in the availability and price of raw materials, manufacturing disruptions, and changes in transportation costs and delivery times . These and other risks and uncertainties are described in our filings with the Securities and Exchange Commission including our Annual Report on Form 10 - K and our quarterly reports on Form 10 - Q under the caption “Risk Factors” . There may be other factors not presently known to us or which we currently consider to be immaterial that may cause our actual results to differ materially from the forward - looking statements . All forward - looking statements attributable to us or persons acting on our behalf apply only as of the date of this presentation and are expressly qualified in their entirety by the cautionary statements included in this presentation . Except to the extent required by law, we undertake no obligation to update or revise forward - looking statements to reflect events or circumstances after the date such statements are made or to reflect the occurrence of unanticipated events . Non - GAAP Financial Measures This presentation contains certain non - GAAP financial measures, including EBITDA, Adjusted EBITDA and Indicative Net Asset Value . The non - GAAP financial measures contained herein have limitations as analytical tools and should not be considered in isolation or in lieu of an analysis of our results as reported under U . S . GAAP . These non - GAAP measures should be evaluated only on a supplementary basis in connection with our U . S . GAAP results, including those reported in our consolidated financial statements and the related notes thereto contained in our Annual Report on Form 10 - K for the year ended December 31 , 2022 and our subsequent quarterly reports on Form 10 - Q . A reconciliation of these non - GAAP financial measures to the most directly comparable U . S . GAAP financial measures can be found in the back of this presentation .

Company Overview 3

4 Overview of Icahn Enterprises (1) Based on November 10, 2023, closing price of $19.54 (2) Investment segment total assets represents total equity (equity attributable to IEP was $3.6 billion). (3) All Other operating segments includes Food Packaging, Home Fashion, and Pharma. • Icahn Enterprises L . P . (IEP) is a diversified holding company with operating businesses in Investment, Energy, Automotive, Real Estate, Food Packaging, Home Fashion and Pharma • IEP is majority owned and controlled by Carl Icahn • Over many years, Carl Icahn has contributed most of his businesses to and executed transactions primarily through IEP • As of September 30, 2023, Carl Icahn and his affiliates owned approximately 85% of IEP’s outstanding depositary units • As of November 10 , 2023 , IEP has a $ 4 . 00 annualized distribution, which is a 20 % yield ( 1 ) • IEP has liquidity through its investment in the Investment Funds of approximately $ 3 . 6 billion as of September 30 , 2023 Investment (2) $6,015 ($1,343) ($756) ($665) Energy 4,989 9,755 526 917 Automotive 2,009 1,918 (130) 42 Real Estate 494 135 12 25 All Other (3) 957 717 (8) 77 Holding Company 2,252 89 (444) (28) $16,716 $11,271 ($800) $368 ($Millions) As of September 30, 2023 Twelve Months Ended September 30, 2023 Assets Total Revenue Net Income (Loss) Attributable to IEP Adjusted EBITDA Attributable to IEP

5 Summary Corporate Organizational Chart Note: Percentages denote equity ownership as of September 30, 2023. Excludes intermediary and pass - through entities. CVR Energy , Inc. (NYSE: CVI) Vivus LLC Various Real Estate Holding Entities WestPoint Home LLC Icahn Enterprises G.P. Inc. Icahn Enterprises L.P. ( NasdaqGS : IEP) Icahn Enterprises Holdings L.P. 1% 1% 99% LP Interest 90 % 66 % Icahn Capital LP Viskase Companies , Inc. (OTCPK: VKSC) As of 9/30 /20 23 , Icahn Enterprises had investments with a fair market value of approximately $ 3 . 6 billion in the Investment Funds Engaged in rental commercial real estate, property development and associated club and resort activities Provider of home textile products for more than 200 years Specialty pharmaceutical company One of the worldwide leaders in cellulosic, fibrous and plastic casings for the processed meat industry Independent refiner and marketer of transportation fuels 100% 100% 100% 100% Icahn Automotive Group LLC Primarily e ngaged in the automotive repair and maintenance services business 100% Producer and distributer of nitrogen fertilizer products CVR Partners, LP (NYSE: UAN) 3 7 %
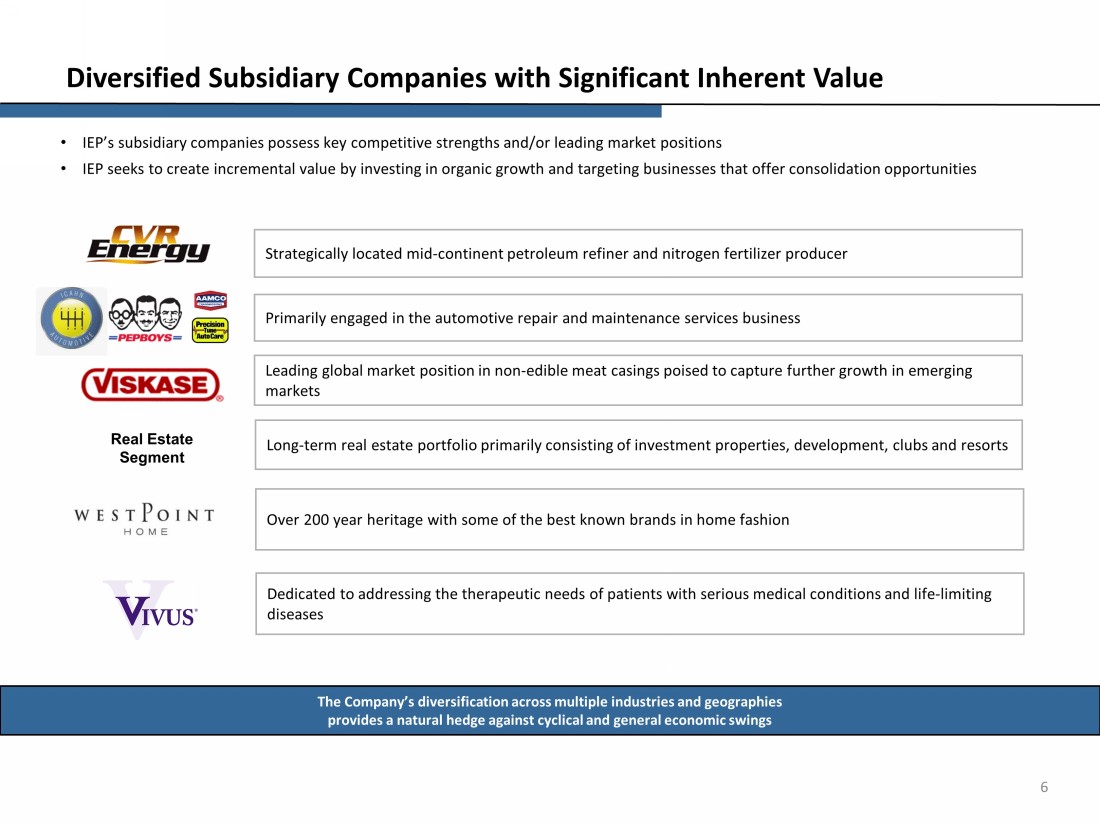
6 Diversified Subsidiary Companies with Significant Inherent Value • IEP’s subsidiary companies possess key competitive strengths and/or leading market positions • IEP seeks to create incremental value by investing in organic growth and targeting businesses that offer consolidation opportunities The Company’s diversification across multiple industries and geographies provides a natural hedge against cyclical and general economic swings Over 200 year heritage with some of the best known brands in home fashion Leading global market position in non - edible meat casings poised to capture further growth in emerging markets Strategically located mid - continent petroleum refiner and nitrogen fertilizer producer Long - term real estate portfolio primarily consisting of investment properties, development, clubs and resorts Real Estate Segment Primarily engaged in the automotive repair and maintenance services business Dedicated to addressing the therapeutic needs of patients with serious medical conditions and life - limiting diseases
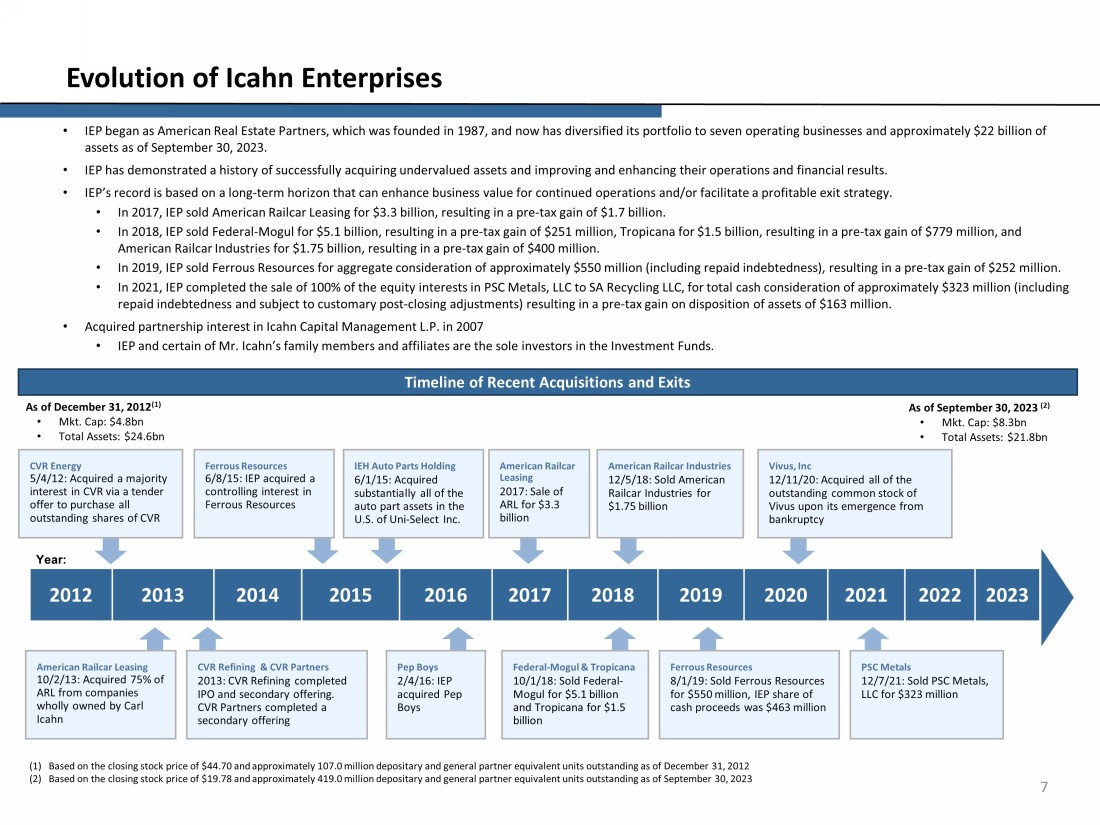
7 Evolution of Icahn Enterprises • IEP began as American Real Estate Partners, which was founded in 1987, and now has diversified its portfolio to seven operati ng businesses and approximately $22 billion of assets as of September 30, 2023. • IEP has demonstrated a history of successfully acquiring undervalued assets and improving and enhancing their operations and fin ancial results. • IEP’s record is based on a long - term horizon that can enhance business value for continued operations and/or facilitate a profit able exit strategy. • In 2017, IEP sold American Railcar Leasing for $3.3 billion, resulting in a pre - tax gain of $1.7 billion. • In 2018, IEP sold Federal - Mogul for $5.1 billion, resulting in a pre - tax gain of $251 million, Tropicana for $1.5 billion, resul ting in a pre - tax gain of $779 million, and American Railcar Industries for $1.75 billion, resulting in a pre - tax gain of $400 million. • In 2019, IEP sold Ferrous Resources for aggregate consideration of approximately $550 million (including repaid indebtedness) , r esulting in a pre - tax gain of $252 million. • In 2021, IEP completed the sale of 100% of the equity interests in PSC Metals, LLC to SA Recycling LLC, for total cash consid era tion of approximately $323 million (including repaid indebtedness and subject to customary post - closing adjustments) resulting in a pre - tax gain on disposition of assets of $ 163 million. • Acquired partnership interest in Icahn Capital Management L.P. in 2007 • IEP and certain of Mr. Icahn’s family members and affiliates are the sole investors in the Investment Funds. Timeline of Recent Acquisitions and Exits (1) Based on the closing stock price of $44.70 and approximately 107.0 million depositary and general partner equivalent units outstanding a s of December 31, 2012 (2) Based on the closing stock price of $19.78 and approximately 419.0 million depositary and general partner equivalent un its outstanding as of September 30, 2023 As of December 31, 20 12 (1) • Mkt. Cap: $4.8 bn • Total Assets: $ 24.6 bn As of September 30, 2023 ( 2 ) • Mkt. Cap: $ 8.3b n • Total Assets: $ 21.8 bn Year: 201 2 201 3 2014 2015 201 6 201 7 201 8 201 9 20 20 20 21 20 22 2023 American Railcar Leasing 10/2/13: Acquired 75% of ARL from companies wholly owned by Carl Icahn Ferrous Resources 6/8/15: IEP acquired a controlling interest in Ferrous Resources Pep Boys 2/4/16: IEP acquired Pep Boys Federal - Mogul & Tropicana 10/1/18: Sold Federal - Mogul for $5.1 billion and Tropicana for $1.5 billion Ferrous Resources 8/1/19: Sold Ferrous Resources for $550 million, IEP share of cash proceeds was $4 63 million PSC Metals 12/7/21: Sold PSC Metals, LLC for $323 million CVR Energy 5/4/12: Acquired a majority interest in CVR via a tender offer to purchase all outstanding shares of CVR CVR Refining & CVR Partners 2013: CVR Refining completed IPO and secondary offering. CVR Partners completed a secondary offering IEH Auto Parts Holding 6/1/15: Acquired substantially all of the auto part assets in the U.S. of Uni - Select Inc. American Railcar Leasing 2017: Sale of ARL for $3 .3 billion American Railcar Industries 12/5/18: Sold American Railcar Industries for $1.75 billion Vivus , Inc 12/11/20: Acquired all of the outstanding common stock of Vivus upon its emergence from bankruptcy

8 Ability to Maximize Shareholder Value Through Proven Activist Strategy • IEP seeks undervalued companies and often becomes “actively” involved in the targeted companies • Activist strategy requires significant capital, rapid execution and willingness to take control of companies • Implement changes required to improve businesses Purchase of Stock or Debt • IEP pursues its activist strategy and seeks to promulgate change . – Dealing with the board and management – Proxy fights – Tender offers – Taking control • IEP’s investment and legal team is capable of unlocking a target’s hidden value . – Financial/balance sheet restructuring – Operation turnarounds – Strategic initiatives – Corporate governance changes • Mr. Icahn and Icahn Capital have a long and successful track record of generating significant returns employing the activist str ategy • IEP’s subsidiaries often started out as investment positions in debt or equity either directly by Icahn Capital or Mr. Icahn • Active participation in the strategy and capital allocation for targeted companies • Not involved in day - to - day operations • IEP will make necessary investments to ensure subsidiary companies can compete effectively Putting Activism into Action

Overview of Operating Segments 9

Highlights and Recent Developments • Long history of investing in public equity and debt securities and pursuing activist agenda • Employs an activist strategy that seeks to unlock hidden value through various tactics • Financial/balance sheet restructurings • Operational turnarounds • Strategic initiatives • Corporate governance changes • As of September 30, 2023, the Funds had a net short notional exposure of 41% Segment Description • IEP invests its proprietary capital through various private investment funds (the “Funds”) managed by the Investment segment • Fair value of IEP’s investment in the Funds was approximately $3.6 billion as of September 30, 2023 10 Segment: Investment Historical Segment Financial Summary (1) Based on closing share price as of specified date. (2) Includes common stock and forward contracts as a percentage of common shares issued and outstanding . (3) Refer to the Adjusted EBITDA reconciliations in the Appendix . (4) Balance Sheet data as of end of each respective period. Significant Holdings As of September 30, 2023 Company Mkt. Value ($mm) (1) % Ownership ( 2 ) $803 7.52 % $ 666 15.42 % $482 2.46% $ 302 1.39 % $ 285 9.53 % ($Millions) Selected Income Statement Data: Total revenue ($1,249) $202 ($23) ($1,343) Adjusted EBITDA (3) (1,251) 186 (50) (1,373) Net income (loss) (1,447) (32) (223) (1,551) Adjusted EBITDA attributable to IEP (3) (673) 83 (10) (665) Net income (loss) attributable to IEP (765) (16) (89) (756) Returns -14.3% -0.3% -2.4% -17.3% Segment Balance Sheet Data (4) : Equity attributable to IEP $4,283 $4,271 $4,184 $3,634 Total Equity $9,342 $9,390 $9,150 $6,015 Investment Segment FYE December 31, LTM September 30, 20232020 2021 2022

Highlights and Recent Developments Petroleum • Two strategically located Mid - Continent refineries close to Cushing, Oklahoma with total nameplate capacity 206,500 bpd • Direct access to crude oil and condensate fields in the Anadarko and Arkoma Basins • Complimentary logistics assets and access to multiple key pipelines provide a variety of price advantaged crude oil supply options • Declared a third quarter 2023 cash dividend of $0.50 per share and a special cash dividend of $1.50 per share bringing cumulative dividends declared to date of $4.00 per share for the nine months of 2023 Fertilizer • Two strategically located facilities serving the Southern Plains and Corn Belt • Primarily engaged in the production of the nitrogen fertilizers ammonia and urea ammonium nitrate (UAN) • Diverse feedstock exposure through petroleum coke and natural gas • Declared a third quarter 2023 cash distribution of $1.55 per common unit bringing cumulative distributions declared to date of $16.12 per common unit for the nine months of 2023 Segment Description • CVR Energy, Inc. (NYSE: CVI) is a diversified holding company primarily engaged in the petroleum refining and nitrogen fertilizer manufacturing businesses through its interests in CVR Refining, LP and CVR Partners, LP (NYSE: UAN) • CVR Refining is an independent petroleum refiner and marketer of high - value transportation fuels in the mid - continent of the United States • CVR Partners is a manufacturer of ammonia and urea ammonium nitrate solution fertilizer products 11 Segment: Energy Historical Segment Financial Summary (1) Refer to the Adjusted EBITDA reconciliations in the Appendix. (2) Balance Sheet data as of the end of each respective period . ($Millions) Selected Income Statement Data: Net sales $3,930 $7,242 $10,896 $9,725 Adjusted EBITDA (1) 33 462 1,253 1,545 Net income (loss) (327) 29 596 905 Adjusted EBITDA attributable to IEP (1) (15) 231 707 917 Net income (loss) attributable to IEP (194) (5) 304 526 Segment Balance Sheet Data (2) : Total assets $4,723 $4,587 $4,735 $4,989 Equity attributable to IEP $1,039 $686 $648 $873 Energy Segment FYE December 31, LTM September 30, 20232020 2021 2022

Highlights and Recent Developments • Automotive Services provides Do - It - For - Me automotive repair services for retail and fleet customers with over 900 stores and 8,000 service bays located in the United States and Puerto Rico • The Automotive segment continues to progress through its multi - year transformation plan focused on customer service, quality, and profitable growth • The leadership team has focused on key strategic initiatives including: • Expanding our geographic footprint through greenfield growth • Increasing efficiencies in existing service locations such as store labor productivity • Reducing working capital and material costs through supply chain optimization • Enhancing our marketing vendor partnerships to increase brand visibility and optimize sales Segment Description • We conduct our Automotive segment through our wholly owned subsidiaries, Icahn Automotive Group LLC ("Icahn Automotive") and our wholly owned subsidiary, AEP PLC LLC (“AEP PLC”) • The Automotive segment is engaged in providing a full range of automotive repair and maintenance services, along with the sale of any installed parts or materials related to automotive services (“Automotive Services”) to its customers, as well as sales of automotive aftermarket parts and retailed merchandise (“Aftermarket Parts”). In addition to their primary business, the Automotive segment leases available and excess real estate in certain locations under long - term operating leases 12 Segment: Automotive Historical Segment Financial Summary (1) As of January 31, 2023, IEH Auto Parts Holdings LLC (“Auto Plus”) was deconsolidated due to voluntary Chapter 11 bankruptcy p roc eedings. (2) Refer to the Adjusted EBITDA reconciliations in the Appendix . (3) Balance Sheet data as of the end of each respective period . ($Millions) Selected Income Statement Data: Net sales and other revenue from operations $2,478 $2,394 $2,394 $1,911 Adjusted EBITDA (2) (45) (67) (31) 42 Net income (loss) (198) (260) (192) (130) Segment Balance Sheet Data (3) : Total assets $3,085 $2,582 $2,532 $2,009 Equity attributable to IEP $1,554 $1,575 $1,530 $1,115 Automotive Segment (1) FYE December 31, LTM September 30, 20232020 2021 2022
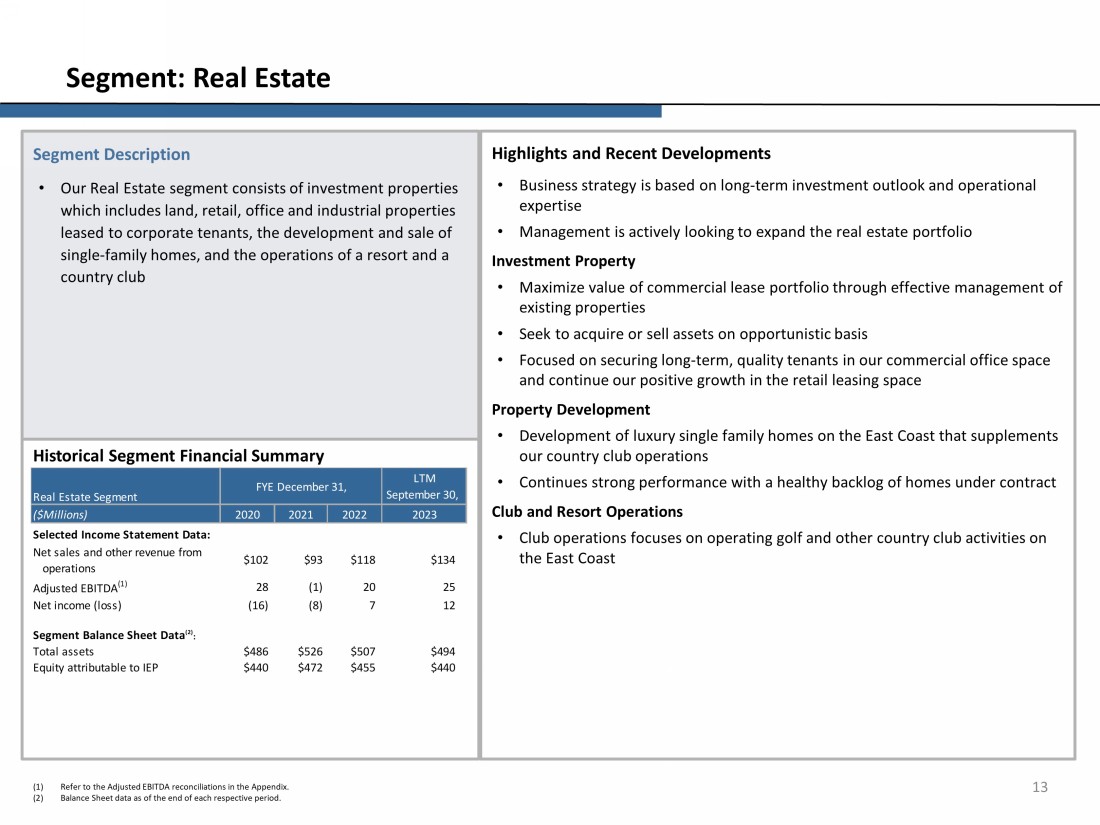
Highlights and Recent Developments • Business strategy is based on long - term investment outlook and operational expertise • Management is actively looking to expand the real estate portfolio Investment Property • Maximize value of commercial lease portfolio through effective management of existing properties • Seek to acquire or sell assets on opportunistic basis • Focused on securing long - term, quality tenants in our commercial office space and continue our positive growth in the retail leasing space Property Development • Development of luxury single family homes on the East Coast that supplements our country club operations • Continues strong performance with a healthy backlog of homes under contract Club and Resort Operations • Club operations focuses on operating golf and other country club activities on the East Coast Segment Description • Our Real Estate segment consists of investment properties which includes land, retail, office and industrial properties leased to corporate tenants, the development and sale of single - family homes, and the operations of a resort and a country club 13 Segment: Real Estate Historical Segment Financial Summary (1) Refer to the Adjusted EBITDA reconciliations in the Appendix. (2) Balance Sheet data as of the end of each respective period. ($Millions) Selected Income Statement Data: Net sales and other revenue from operations $102 $93 $118 $134 Adjusted EBITDA (1) 28 (1) 20 25 Net income (loss) (16) (8) 7 12 Segment Balance Sheet Data (2) : Total assets $486 $526 $507 $494 Equity attributable to IEP $440 $472 $455 $440 Real Estate Segment FYE December 31, LTM September 30, 20232020 2021 2022

Highlights and Recent Developments Food Packaging • Viskase operates plants in the United States, Mexico, Brazil, France, Italy, Germany, Poland, and the Philippines • Steady growth is projected globally for cellulose casings, with more emphasis on South America and Asia Pacific markets • Market demand is generally resilient as end products represent a cost - effective and attractive source of protein; however inventory reductions in the channel as supply chains have stabilized have had some impact on short term market demand • Material and energy challenges experienced in 2022 were addressed through price, and input costs stabilized in 2023. The business is not seeing meaningful softening of input costs as we approach the end of the year • Business remains focused on reducing complexity and optimizing product and customer mix, while targeting growth with key customers globally Home Fashion • Focus on core profitable customers and product lines • WPH has implemented a more customer - focused organizational structure with the intent of expanding key customer relationships and rebuilding the company’s sales backlog • Continued strength with institutional customers and growth into new international markets including Africa, Australia, and the Middle East Pharma • Focused on launching Qsymia in various EU countries and expand licensing agreements globally • Focused on continued growth of both Qysmia and Pancreaze in the U.S. All Other Operating Segments Description • Food Packaging : We conduct our Food Packaging segment through our majority owned subsidiary, Viskase Companies, Inc. (OTCPK:VKSC), a worldwide leader in the production and sale of cellulosic, fibrous and plastic casings for the processed meat and poultry industry • Home Fashion : We conduct our Home Fashion segment through our wholly owned subsidiary, WestPoint Home LLC. WestPoint Home LLC is engaged in manufacturing, sourcing, marketing, distributing and selling home fashion consumer products • Pharma : We conduct our Pharma segment through our wholly owned subsidiary, Vivus LLC. Vivus is a specialty pharmaceutical company with two approved therapies and one product candidate in active clinical development 14 All Other Operating Segments Other Operating Segments Financial Summary (1) All Other operating segments include Food Packaging, Home Fashion, and Pharma. Results for each of these separate segments ca n b e found in our Quarterly Reports on Form 10 - Q and our Annual Report on Form 10 - K filed with the SEC. (2) Refer to Adjusted EBITDA reconciliation in the Appendix. (3) Balance Sheet data as of the end of each respective period. ($Millions) Selected Income Statement Data: Net sales and other revenue from operations $600 $698 $718 $717 Adjusted EBITDA (2) 63 62 51 $84 Net income (loss) (4) (13) (38) ($7) Adjusted EBITDA attributable to IEP (2) 52 56 45 $77 Net income (loss) attributable to IEP (4) (13) (38) ($8) Segment Balance Sheet Data (3) : Total assets $1,040 $1,010 $990 $957 Equity attributable to IEP $545 $534 $546 $547 2020 2021 2022 2023 All Other Operating Segments (1) FYE December 31, LTM September 30,

Financial Performance 15

16 Financial Performance Net Income (Loss) Attributable to Icahn Enterprises Adjusted EBITDA Attributable to Icahn Enterprises (1) (1) Refer to the Adjusted EBITDA reconciliations in the Appendix. (2) All Other operating segments include Food Packaging, Home Fashion, and Pharma. Results for each of these separate segments ca n b e found in our Quarterly Reports on Form 10 - Q and our Annual Report on Form 10 - K filed with the SEC. ($Millions) Segments: Energy ($194) ($5) $304 $526 Automotive (198) (260) (192) (130) Real Estate (16) (8) 7 12 Metals - 186 - - All Other (2) (4) (13) (38) (8) Subtotal (412) (100) 81 400 Investment (765) (16) (89) (756) Holding Company (476) (402) (175) (444) Consolidated ($1,653) ($518) ($183) ($800) FYE December 31, LTM September 30, 2020 2021 2022 2023 ($Millions) Segments: Energy ($15) $231 $707 $917 Automotive (45) (67) (31) 42 Real Estate 28 (1) 20 25 Metals 20 38 - - All Other (2) 52 56 45 77 Subtotal 40 257 741 1,061 Investment ($673) $83 ($10) ($665) Holding Company (102) (67) 27 (28) Consolidated ($735) $273 $758 $368 2023 LTM September 30, FYE December 31, 2020 2021 2022

17 Consolidated Financial Snapshot Net Income (Loss): Investment ($1,447) ($32) ($223) $221 ($1,107) ($1,551) Energy (327) 29 596 436 745 905 Automotive (198) (260) (192) (64) (2) (130) Real Estate (16) (8) 7 8 13 12 Metals - 186 - - - - All Other (1) (4) (13) (38) (25) 6 (7) Holding Company (476) (402) (175) (193) (462) (444) Net income (loss) ($2,468) ($500) ($25) $383 ($807) ($1,215) Less: net income (loss) attributable to non-controlling interests (815) 18 158 311 (262) (415) Net income (loss) attributable to Icahn Enterprises ($1,653) ($518) ($183) $72 ($545) ($800) Adjusted EBITDA (2) : Investment ($1,251) $186 ($50) $348 ($975) ($1,373) Energy 33 462 1,253 939 1,231 1,545 Automotive (45) (67) (31) 12 85 42 Real Estate 28 (1) 20 17 22 25 Metals 20 38 - - - - All Other (1) 63 62 51 43 76 84 Holding Company (102) (67) 27 32 (23) (28) Consolidated Adjusted EBITDA ($1,254) $613 $1,270 $1,391 $416 $295 Less: Adjusted EBITDA attributable to non-controlling interests (519) 340 512 579 (6) (73) Adjusted EBITDA attributable to Icahn Enterprises ($735) $273 $758 $812 $422 $368 Capital Expenditures $199 $305 $338 $254 $201 $285 ($Millions) FYE December 31, Nine months ended September 30, LTM September 30, 2020 2021 2022 2022 2023 2023 (1) All Other operating segments include Food Packaging, Home Fashion, and Pharma. Results for each of these separate segments ca n b e found in our Quarterly Reports on Form 10 - Q and our Annual Report on Form 10 - K filed with the SEC. (2) Refer to the Adjusted EBITDA reconciliations in the Appendix.

18 Balance Sheet (1) All Other operating segments includes Food Packaging, Home Fashion, and Pharma. ASSETS Cash and cash equivalents $21 $889 $100 $11 $35 $4 $17 $1,813 $2,890 Cash held at consolidated affiliated partnerships and restricted cash 3,026 7 9 - 6 3 - 171 3,222 Investments 3,185 101 - - 14 - - - 3,300 Accounts receivable, net - 316 46 79 18 31 27 - 517 Inventories, net - 610 249 114 - 87 25 - 1,085 Related party notes receivable, net - - - - - - - 59 59 Property, plant and equipment, net - 2,611 799 132 337 53 - 5 3,937 Goodwill and intangible assets, net - 184 344 23 - 19 205 - 775 Other assets 4,824 271 462 101 84 18 8 204 5,972 Total assets $11,056 $4,989 $2,009 $460 $494 $215 $282 $2,252 $21,757 LIABILITIES AND EQUITY Accounts payable, accrued expenses and other liabilities $1,240 $1,753 $870 $139 $49 $47 $55 $100 $4,253 Securities sold, not yet purchased, at fair value 3,801 - - - - - - - 3,801 Debt - 1,590 24 142 1 10 - 5,308 7,075 Total liabilities $5,041 $3,343 $894 $281 $50 $57 $55 $5,408 $15,129 Equity attributable to Icahn Enterprises $3,634 $873 $1,115 $162 $440 $158 $227 ($3,156) $3,453 Equity attributable to non-controlling interests 2,381 773 - 17 4 - - - 3,175 Total equity $6,015 $1,646 $1,115 $179 $444 $158 $227 ($3,156) $6,628 Total liabilities and equity $11,056 $4,989 $2,009 $460 $494 $215 $282 $2,252 $21,757 ($Millions) As of September 30, 2023 Investment Energy Automotive Food Packaging (1) Home Fashion (1) Pharma (1) Holding Company ConsolidatedReal Estate

19 Indicative Net Asset Value Note: Refer to the next page for footnotes and additional information. 9/30/2022 12/31/2022 3/31/2023 6/30/2023 9/30/2023 Holding Company interest in Investment Funds (1) 4,387$ 4,184$ 4,013$ 3,799$ 3,634$ CVR Energy (2) 2,063 2,231 2,334 2,133 2,270 Total market-valued Subsidiaries and Investments: 6,450$ 6,415$ 6,347$ 5,932$ 5,904$ Viskase (3) 207 243 285 341 378 Real Estate Holdings (1) 458 455 457 461 440 WestPoint Home (1) 126 156 161 162 158 Vivus (1) 245 241 237 237 227 Automotive Services (4) 645 490 573 608 601 Automotive Parts (1)(5)(6) 490 381 - 11 8 Automotive Owned Real Estate Assets (7) 1,187 831 831 831 831 Icahn Automotive Group 2,322 1,702 1,404 1,450 1,440 Total Other Subsidiaries 3,358$ 2,797$ 2,544$ 2,651$ 2,643$ Add: Other Net Assets (8) (9) 20 130 173 117 Indicative Gross Asset Value 9,799$ 9,232$ 9,021$ 8,756$ 8,664$ Add: Holding Company cash and cash equivalents (9) 1,671 1,720 1,868 1,574 1,813 Less: Holding Company debt (9) (5,310) (5,309) (5,309) (5,308) (5,308) Indicative Net Asset Value 6,160$ 5,643$ 5,580$ 5,022$ 5,169$ Other Subsidiaries: As of Market-valued Subsidiaries and Investments: ($Millions)

20 Indicative Net Asset Value Use of Indicative Net Asset Value Data The Company uses indicative net asset value as an additional method for considering the value of the Company’s assets, and we believe that this information can be helpful to investors . Please note, however, that the indicative net asset value does not represent the market price at which the depositary units trade . Accordingly, data regarding indicative net asset value is of limited use and should not be considered in isolation . Indicative net asset value does not purport to reflect a valuation of IEP . The calculated Indicative net asset value does not include any value for our Investment Segment other than the fair market value of our investment in the Investment Funds and other net assets attributable to IEP . A valuation is a subjective exercise and Indicative net asset value does not necessarily consider all elements or consider in the adequate proportion the elements that could affect the valuation of IEP . Investors may reasonably differ on what such elements are and their impact on IEP . No representation or assurance, express or implied, is made as to the accuracy and correctness of Indicative net asset value as of these dates or with respect to any future indicative or prospective results which may vary . Footnotes to Company’s calculation of Indicative Net Asset Value: ( 1 ) Represents GAAP equity attributable to us as of each respective date . ( 2 ) Based on closing share price on each date (or if such date was not a trading day, the immediately preceding trading day) and the number of shares owned by the Holding Company as of each respective date . ( 3 ) Amounts based on market comparables due to lack of material trading volume, valued at 9 . 0 x Adjusted EBITDA for the trailing twelve months ended as of each respective date . ( 4 ) Amounts based on market comparables , valued at 14 . 0 x Adjusted EBITDA for the trailing twelve months ended September 30 , 2022 , December 31 , 2022 , March 31 , 2023 , and June 30 , 2023 and 10 . 0 x Adjusted EBITDA for the trailing twelve months ended September 30 , 2023 . ( 5 ) On January 31 , 2023 , a subsidiary of Icahn Automotive, IEH Auto Parts Holding LLC and its subsidiaries (“Auto Plus”), an aftermarket parts distributor held within our Automotive segment, filed voluntary petitions in the United States Bankruptcy Court . As a result, IEP deconsolidated Auto Plus, writing down its remaining equity interest to zero which is offset by the recognition of a related party note receivable reflected in Other Net Assets . ( 6 ) Beginning in Q 2 2023 , a wholly owned subsidiary of IEP within the Automotive Segment acquired assets from the Auto Plus bankruptcy auction and began operations of an Aftermarket Parts business . ( 7 ) Management performed a valuation on the owned real - estate with the assistance of third - party consultants to estimate fair - market - value . This analysis utilized property - level market rents, location level profitability, and utilized prevailing cap rates ranging from 6 . 8 % to 8 . 0 % as of September 30 , 2023 , June 30 , 2023 , March 31 , 2023 and December 31 , 2022 , and 5 . 5 % to 6 . 5 % as of September 30 , 2022 . The valuation assumed that triple net leases are in place for all the locations at rents estimated by management based on market conditions . There is no assurance we would be able to sell the assets on the timeline or at the prices and lease terms we estimate . Different judgments or assumptions would result in different estimates of the value of these real estate assets . Moreover, although we evaluate and provide our Indicative Net Asset Value on a regular basis, the estimated values may fluctuate in the interim, so that any actual transaction could result in a higher or lower valuation . ( 8 ) Represents GAAP equity of the Holding Company Segment, excluding cash and cash equivalents, debt and non - cash deferred tax assets or liabilities . As of June 30 , 2023 , and September 30 , 2023 , Other Net Assets includes $ 20 million and $ 26 million, respectively, of Automotive Segment liabilities assumed from the Auto Plus bankruptcy ( 9 ) Holding Company’s balance as of each respective date .

Adjusted EBITDA Reconciliations 21

22 Non - GAAP Financial Measures The Company uses certain non - GAAP financial measures in evaluating its performance . These include non - GAAP EBITDA and Adjusted EBITDA . EBITDA represents earnings from continuing operations before interest expense, income tax (benefit) expense and depreciation and amortization . We define Adjusted EBITDA as EBITDA excluding certain effects of impairment, restructuring costs, certain pension plan expenses, gains/losses on disposition of assets, gains/losses on extinguishment of debt and certain other non - operational charges . We present EBITDA and Adjusted EBITDA on a consolidated basis and on a basis attributable to Icahn Enterprises net of the effects of non - controlling interests . We conduct substantially all of our operations through subsidiaries . The operating results of our subsidiaries may not be sufficient to make distributions to us . In addition, our subsidiaries are not obligated to make funds available to us for payment of our indebtedness, payment of distributions on our depositary units or otherwise, and distributions and intercompany transfers from our subsidiaries to us may be restricted by applicable law or covenants contained in debt agreements and other agreements to which these subsidiaries currently may be subject or into which they may enter into in the future . The terms of any borrowings of our subsidiaries or other entities in which we own equity may restrict dividends, distributions or loans to us . We believe that providing EBITDA and Adjusted EBITDA to investors has economic substance as these measures provide important supplemental information of our performance to investors and permits investors and management to evaluate the core operating performance of our business without regard to interest, taxes and depreciation and amortization and certain effects of impairment, restructuring costs, certain pension plan expenses, gains/losses on disposition of assets, gains/losses on extinguishment of debt and certain other non - operational charges . Additionally, we believe this information is frequently used by securities analysts, investors and other interested parties in the evaluation of companies that have issued debt . Management uses, and believes that investors benefit from referring to, these non - GAAP financial measures in assessing our operating results, as well as in planning, forecasting and analyzing future periods . Adjusting earnings for these charges allows investors to evaluate our performance from period to period, as well as our peers, without the effects of certain items that may vary depending on accounting methods and the book value of assets . Additionally, EBITDA and Adjusted EBITDA present meaningful measures of performance exclusive of our capital structure and the method by which assets were acquired and financed . EBITDA and Adjusted EBITDA have limitations as analytical tools, and you should not consider them in isolation, or as substitutes for analysis of our results as reported under generally accepted accounting principles in the United States, or U . S . GAAP . For example, EBITDA and Adjusted EBITDA : • do not reflect our cash expenditures, or future requirements for capital expenditures, or contractual commitments ; • do not reflect changes in, or cash requirements for, our working capital needs ; and • do not reflect the significant interest expense, or the cash requirements necessary to service interest or principal payments on our debt . Although depreciation and amortization are non - cash charges, the assets being depreciated or amortized often will have to be replaced in the future, and EBITDA and Adjusted EBITDA do not reflect any cash requirements for such replacements . Other companies in the industries in which we operate may calculate EBITDA and Adjusted EBITDA differently than we do, limiting their usefulness as comparative measures . In addition, EBITDA and Adjusted EBITDA do not reflect the impact of earnings or charges resulting from matters we consider not to be indicative of our ongoing operations . EBITDA and Adjusted EBITDA are not measurements of our financial performance under U . S . GAAP and should not be considered as alternatives to net income or any other performance measures derived in accordance with U . S . GAAP or as alternatives to cash flow from operating activities as a measure of our liquidity . Given these limitations, we rely primarily on our U . S . GAAP results and use EBITDA and Adjusted EBITDA only as a supplemental measure of our financial performance .

23 Adjusted EBITDA Reconciliation by Segment – Year Ended December 31, 2022 (1) The presentation of Adjusted EBITDA for “All Other Operating Segments” included in this presentation consists of results fro m our Food Packaging, Home Fashion, and Pharma segments. Net income (loss) ($223) $596 ($192) $2 $7 ($22) ($18) ($175) ($25) Interest expense, net 173 84 2 8 - 3 (1) 259 528 Income tax expense (benefit) - 140 (54) 7 - - - (59) 34 Depreciation and amortization - 353 80 27 13 7 28 1 509 ($50) $1,173 ($164) $44 $20 ($12) $9 $26 $1,046 Restructuring costs - - - - - 2 - - 2 (Gain) loss on disposition of assets, net - - (3) - - - - - (3) Transformation losses - - 53 - - - - - 53 Net (gain) loss on extinguishment of debt - - - - - - - 1 1 Out of period adjustments - - 51 1 - - - - 52 Call option lawsuits settlement - 79 - - - - - - 79 Other - 1 32 6 - - 1 - 40 ($50) $1,253 ($31) $51 $20 ($10) $10 $27 $1,270 Net income (loss) ($89) $304 ($192) $2 $7 ($22) ($18) ($175) ($183) Interest expense, net 79 44 2 7 - 3 (1) 259 393 Income tax expense (benefit) - 103 (54) 6 - - - (59) (4) Depreciation and amortization - 199 80 24 13 7 28 1 352 ($10) $650 ($164) $39 $20 ($12) $9 $26 $558 Restructuring costs - - - - - 2 - - 2 (Gain) loss on disposition of assets, net - - (3) - - - - - (3) Transformation losses - - 53 - - - - - 53 Net (gain) loss on extinguishment of debt - - - - - - - 1 1 Out of period adjustments - - 51 1 - - - - 52 Call option lawsuits settlement - 56 - - - - - - 56 Other - 1 32 5 - - 1 - 39 ($10) $707 ($31) $45 $20 ($10) $10 $27 $758 Home Fashion (1) Pharma (1) ($Millions) Investment Energy Automotive Food Packaging (1) Real Estate Holding Company Consolidated Adj. EBITDA before non-controlling interests Adjusted EBITDA: EBITDA before non-controlling interests Adjusted EBITDA attributable to IEP: EBITDA attributable to IEP Adjusted EBITDA attributable to IEP

24 Adjusted EBITDA Reconciliation by Segment – Year Ended December 31, 2021 (1) The presentation of Adjusted EBITDA for “All Other Operating Segments” included in this presentation consists of results fro m our Food Packaging, Home Fashion, and Pharma segments. Net income (loss) ($32) $29 ($260) ($2) ($8) ($8) ($3) $186 ($402) ($500) Interest expense, net 218 109 7 6 - 2 - 1 318 661 Income tax expense (benefit) - (27) (72) 4 - (2) - - 19 (78) Depreciation and amortization - 343 87 28 9 7 28 14 1 517 $186 $454 ($238) $36 $1 ($1) $25 $201 ($64) $600 Restructuring costs - - - 1 - - - - - 1 (Gain) loss on disposition of assets, net - - 22 - (3) - - (163) - (144) Transformation losses - - 149 - - - - - - 149 Net (gain) loss on extinguishment of debt - 8 - - - - - - (3) 5 Other - - - 14 1 1 (14) - - 2 $186 $462 ($67) $51 ($1) $0 $11 $38 ($67) $613 Net income (loss) ($16) ($5) ($260) ($2) ($8) ($8) ($3) $186 ($402) ($518) Interest expense, net 99 48 7 5 - 2 - 1 318 480 Income tax expense (benefit) - (14) (72) 3 - (2) - - 19 (66) Depreciation and amortization - 196 87 25 9 7 28 14 1 367 $83 $225 ($238) $31 $1 ($1) $25 $201 ($64) $263 Restructuring costs - - - 1 - - - - - 1 (Gain) loss on disposition of assets, net - - 22 - (3) - - (163) - (144) Transformation losses - - 149 - - - - - - 149 Net (gain) loss on extinguishment of debt - 6 - - - - - - (3) 3 Other - - - 13 1 1 (14) - - 1 $83 $231 ($67) $45 ($1) $0 $11 $38 ($67) $273 Adjusted EBITDA attributable to IEP: EBITDA attributable to IEP Adjusted EBITDA attributable to IEP EBITDA before non-controlling interests Adj. EBITDA before non-controlling interests Adjusted EBITDA: ($Millions) Investment Energy Automotive Food Packaging (1) Real Estate Home Fashion (1) Pharma (1) Metals Consolidated Holding Company

25 Adjusted EBITDA Reconciliation by Segment – Year Ended December 31, 2020 (1) The presentation of Adjusted EBITDA for “All Other Operating Segments” included in this presentation consists of results fro m our Food Packaging, Home Fashion, and Pharma segments. Net income (loss) ($1,447) ($327) ($198) $4 ($16) ($7) ($1) $0 ($476) ($2,468) Interest expense, net 196 121 12 11 - 1 - 1 328 670 Income tax expense (benefit) - (112) (54) 8 - - - - 42 (116) Depreciation and amortization - 343 95 27 17 8 2 18 - 510 ($1,251) $25 ($145) $50 $1 $2 $1 $19 ($106) ($1,404) Impairment of assets - - - - 7 3 - 1 - 11 Restructuring costs - - - 1 - - - 1 - 2 (Gain) loss on disposition of assets, net - - 6 - 5 - - (1) - 10 Transformation losses - - 94 - - - - - - 94 Net (gain) loss on extinguishment of debt - 8 - - - 4 12 Other - - - 8 15 (2) - - - 21 ($1,251) $33 ($45) $59 $28 $3 $1 $20 ($102) ($1,254) Net income (loss) ($765) ($194) ($198) $4 ($16) ($7) ($1) $0 ($476) ($1,653) Interest expense, net 92 56 12 9 - 1 - 1 328 499 Income tax expense (benefit) - (74) (54) 7 - - - - 42 (79) Depreciation and amortization - 191 95 22 17 8 2 18 - 353 ($673) ($21) ($145) $42 $1 $2 $1 $19 ($106) ($880) Impairment of assets - - - - 7 3 - 1 - 11 Restructuring costs - - - 1 - - - 1 - 2 (Gain) loss on disposition of assets, net - - 6 - 5 - - (1) - 10 Transformation losses - - 94 - - - - - - 94 Net (gain) loss on extinguishment of debt - 6 - - - - - - 4 10 Other - - - 5 15 (2) - - - 18 ($673) ($15) ($45) $48 $28 $3 $1 $20 ($102) ($735) ($Millions) Investment Energy Automotive Food Packaging (1) Real Estate Home Fashion (1) Pharma (1) Holding Company ConsolidatedMetals Adjusted EBITDA attributable to IEP Adjusted EBITDA: EBITDA before non-controlling interests Adj. EBITDA before non-controlling interests Adjusted EBITDA attributable to IEP: EBITDA attributable to IEP

26 Adjusted EBITDA Reconciliation by Segment – Last Twelve Months Ended September 30, 2023 (1) The presentation of Adjusted EBITDA for “All Other Operating Segments” included in this presentation consists of results fro m our Food Packaging, Home Fashion, and Pharma segments. Net (loss) income ($1,551) $905 ($130) $14 $12 ($14) ($7) ($444) ($1,215) Interest expense, net 178 62 3 12 - 2 (1) 196 452 Income tax expense (benefit) - 219 (37) 8 - (1) - (166) 23 Depreciation and amortization - 358 78 27 14 7 28 1 513 ($1,373) $1,544 ($86) $61 $26 ($6) $20 ($413) ($227) Credit loss on related party note receivable - - - - - - - 139 139 Loss on deconsolidation of subsidiary - - - - - - - 246 246 Restructuring costs - - - - - 2 - - 2 Loss / (Gain) on disposition of assets - - (5) - - - - - (5) Transformation losses - - 42 - - - - - 42 Out of period adjustments - - 59 1 - - - - 60 Other - 1 32 3 (1) 1 2 - 38 ($1,373) $1,545 $42 $65 $25 ($3) $22 ($28) $295 Net (loss) income ($756) $526 ($130) $13 $12 ($14) ($7) ($444) ($800) Interest expense, net 91 30 3 11 - 2 (1) 196 332 Income tax expense (benefit) - 157 (37) 7 - (1) - (166) (40) Depreciation and amortization - 203 78 24 14 7 28 1 355 ($665) $916 ($86) $55 $26 ($6) $20 ($413) ($153) Credit loss on related party note receivable - - - - - - - 139 139 Loss on deconsolidation of subsidiary - - - - - - - 246 246 Restructuring costs - - - - - 2 - - 2 Loss / (Gain) on disposition of assets - - (5) - - - - - (5) Transformation losses - - 42 - - - - - 42 Out of period adjustments - - 59 1 - - - - 60 Other - 1 32 2 (1) 1 2 - 37 ($665) $917 $42 $58 $25 ($3) $22 ($28) $368 ($Millions) Investment Energy Automotive Food Packaging (1) Real Estate Home Fashion (1) Pharma (1) Holding Company Consolidated Adjusted EBITDA attributable to IEP Adjusted EBITDA: EBITDA before non-controlling interests Adj. EBITDA before non-controlling interests Adjusted EBITDA attributable to IEP: EBITDA attributable to IEP

27 Adjusted EBITDA Reconciliation by Segment – Nine Months Ended September 30, 2023 (1) The presentation of Adjusted EBITDA for “All Other Operating Segments” included in this presentation consists of results fro m our Food Packaging, Home Fashion, and Pharma segments. Net (loss) income ($1,107) $745 ($2) $12 $13 ($2) ($4) ($462) ($807) Interest expense, net 132 44 2 9 - 1 - 143 331 Income tax expense (benefit) - 173 (5) 4 - - - (90) 82 Depreciation and amortization - 269 58 20 10 5 21 1 384 ($975) $1,231 $53 $45 $23 $4 $17 ($408) ($10) Credit loss on related party note receivable - - - - - - - 139 139 Loss on deconsolidation of subsidiary - - - - - - - 246 246 Loss / (Gain) on disposition of assets - - (6) - - - - - (6) Transformation losses - - 30 - - - - - 30 Out of period adjustments - - 8 - - - - - 8 Other - - - 9 (1) - 1 - 9 ($975) $1,231 $85 $54 $22 $4 $18 ($23) $416 Net (loss) income ($552) $453 ($2) $11 $13 ($2) ($4) ($462) ($545) Interest expense, net 70 21 2 8 - 1 - 143 245 Income tax expense (benefit) - 123 (5) 4 - - - (90) 32 Depreciation and amortization - 152 58 18 10 5 21 1 265 ($482) $749 $53 $41 $23 $4 $17 ($408) ($3) Credit loss on related party note receivable - - - - - - - 139 139 Loss on deconsolidation of subsidiary - - - - - - - 246 246 Loss / (Gain) on disposition of assets - - (6) - - - - - (6) Transformation losses - - 30 - - - - - 30 Out of period adjustments - - 8 - - - - - 8 Other - - - 8 (1) - 1 - 8 ($482) $749 $85 $49 $22 $4 $18 ($23) $422 EBITDA before non-controlling interests Adj. EBITDA before non-controlling interests Adjusted EBITDA attributable to IEP Adjusted EBITDA attributable to IEP: EBITDA attributable to IEP Adjusted EBITDA: Real Estate Home Fashion (1) Pharma (1) Holding Company Consolidated ($Millions) Investment Energy Automotive Food Packaging (1)

28 Adjusted EBITDA Reconciliation by Segment – Nine Months Ended September 30, 2022 (1) The presentation of Adjusted EBITDA for “All Other Operating Segments” included in this presentation consists of results fro m our Food Packaging, Home Fashion, and Pharma segments. Net income (loss) $221 $436 ($64) $0 $8 ($10) ($15) ($193) $383 Interest expense, net 127 66 1 5 - 2 - 206 407 Income tax expense (benefit) - 94 (22) 3 - 1 - 17 93 Depreciation and amortization - 264 60 20 9 5 21 1 380 $348 $860 ($25) $28 $17 ($2) $6 $31 $1,263 Loss / (Gain) on disposition of assets - - (4) - - - - - (4) Transformation losses - - 41 - - - - - 41 Net (gain) loss on extinguishment of debt - - - - - - - 1 1 Call option lawsuits settlement - 79 - - - - - - 79 Other - - - 12 - (1) - - 11 $348 $939 $12 $40 $17 ($3) $6 $32 $1,391 Net income (loss) $115 $231 ($64) $0 $8 ($10) ($15) ($193) $72 Interest expense, net 58 35 1 4 - 2 - 206 306 Income tax expense (benefit) - 69 (22) 3 - 1 - 17 68 Depreciation and amortization - 148 60 18 9 5 21 1 262 $173 $483 ($25) $25 $17 ($2) $6 $31 $708 Loss / (Gain) on disposition of assets - - (4) - - - - - (4) Transformation losses - - 41 - - - - - 41 Net (gain) loss on extinguishment of debt - - - - - - - 1 1 Call option lawsuits settlement - 56 - - - - - - 56 Other - - - 11 - (1) - - 10 $173 $539 $12 $36 $17 ($3) $6 $32 $812 ($Millions) Investment Energy Automotive Food Packaging (1) Real Estate Home Fashion (1) Pharma (1) Holding Company Consolidated Adjusted EBITDA attributable to IEP Adjusted EBITDA attributable to IEP: EBITDA attributable to IEP Adjusted EBITDA: EBITDA before non-controlling interests Adj. EBITDA before non-controlling interests
v3.23.3
| X |
- DefinitionBoolean flag that is true when the XBRL content amends previously-filed or accepted submission.
| Name: |
dei_AmendmentFlag |
| Namespace Prefix: |
dei_ |
| Data Type: |
xbrli:booleanItemType |
| Balance Type: |
na |
| Period Type: |
duration |
|
| X |
- DefinitionFor the EDGAR submission types of Form 8-K: the date of the report, the date of the earliest event reported; for the EDGAR submission types of Form N-1A: the filing date; for all other submission types: the end of the reporting or transition period. The format of the date is YYYY-MM-DD.
| Name: |
dei_DocumentPeriodEndDate |
| Namespace Prefix: |
dei_ |
| Data Type: |
xbrli:dateItemType |
| Balance Type: |
na |
| Period Type: |
duration |
|
| X |
- DefinitionThe type of document being provided (such as 10-K, 10-Q, 485BPOS, etc). The document type is limited to the same value as the supporting SEC submission type, or the word 'Other'.
| Name: |
dei_DocumentType |
| Namespace Prefix: |
dei_ |
| Data Type: |
dei:submissionTypeItemType |
| Balance Type: |
na |
| Period Type: |
duration |
|
| X |
- DefinitionAddress Line 1 such as Attn, Building Name, Street Name
| Name: |
dei_EntityAddressAddressLine1 |
| Namespace Prefix: |
dei_ |
| Data Type: |
xbrli:normalizedStringItemType |
| Balance Type: |
na |
| Period Type: |
duration |
|
| X |
- DefinitionAddress Line 2 such as Street or Suite number
| Name: |
dei_EntityAddressAddressLine2 |
| Namespace Prefix: |
dei_ |
| Data Type: |
xbrli:normalizedStringItemType |
| Balance Type: |
na |
| Period Type: |
duration |
|
| X |
- Definition
+ References
+ Details
| Name: |
dei_EntityAddressCityOrTown |
| Namespace Prefix: |
dei_ |
| Data Type: |
xbrli:normalizedStringItemType |
| Balance Type: |
na |
| Period Type: |
duration |
|
| X |
- DefinitionCode for the postal or zip code
| Name: |
dei_EntityAddressPostalZipCode |
| Namespace Prefix: |
dei_ |
| Data Type: |
xbrli:normalizedStringItemType |
| Balance Type: |
na |
| Period Type: |
duration |
|
| X |
- DefinitionName of the state or province.
| Name: |
dei_EntityAddressStateOrProvince |
| Namespace Prefix: |
dei_ |
| Data Type: |
dei:stateOrProvinceItemType |
| Balance Type: |
na |
| Period Type: |
duration |
|
| X |
- DefinitionA unique 10-digit SEC-issued value to identify entities that have filed disclosures with the SEC. It is commonly abbreviated as CIK. Reference 1: http://www.xbrl.org/2003/role/presentationRef
-Publisher SEC
-Name Exchange Act
-Number 240
-Section 12
-Subsection b-2
| Name: |
dei_EntityCentralIndexKey |
| Namespace Prefix: |
dei_ |
| Data Type: |
dei:centralIndexKeyItemType |
| Balance Type: |
na |
| Period Type: |
duration |
|
| X |
- DefinitionIndicate if registrant meets the emerging growth company criteria. Reference 1: http://www.xbrl.org/2003/role/presentationRef
-Publisher SEC
-Name Exchange Act
-Number 240
-Section 12
-Subsection b-2
| Name: |
dei_EntityEmergingGrowthCompany |
| Namespace Prefix: |
dei_ |
| Data Type: |
xbrli:booleanItemType |
| Balance Type: |
na |
| Period Type: |
duration |
|
| X |
- DefinitionCommission file number. The field allows up to 17 characters. The prefix may contain 1-3 digits, the sequence number may contain 1-8 digits, the optional suffix may contain 1-4 characters, and the fields are separated with a hyphen.
| Name: |
dei_EntityFileNumber |
| Namespace Prefix: |
dei_ |
| Data Type: |
dei:fileNumberItemType |
| Balance Type: |
na |
| Period Type: |
duration |
|
| X |
- DefinitionTwo-character EDGAR code representing the state or country of incorporation.
| Name: |
dei_EntityIncorporationStateCountryCode |
| Namespace Prefix: |
dei_ |
| Data Type: |
dei:edgarStateCountryItemType |
| Balance Type: |
na |
| Period Type: |
duration |
|
| X |
- DefinitionThe exact name of the entity filing the report as specified in its charter, which is required by forms filed with the SEC. Reference 1: http://www.xbrl.org/2003/role/presentationRef
-Publisher SEC
-Name Exchange Act
-Number 240
-Section 12
-Subsection b-2
| Name: |
dei_EntityRegistrantName |
| Namespace Prefix: |
dei_ |
| Data Type: |
xbrli:normalizedStringItemType |
| Balance Type: |
na |
| Period Type: |
duration |
|
| X |
- DefinitionThe Tax Identification Number (TIN), also known as an Employer Identification Number (EIN), is a unique 9-digit value assigned by the IRS. Reference 1: http://www.xbrl.org/2003/role/presentationRef
-Publisher SEC
-Name Exchange Act
-Number 240
-Section 12
-Subsection b-2
| Name: |
dei_EntityTaxIdentificationNumber |
| Namespace Prefix: |
dei_ |
| Data Type: |
dei:employerIdItemType |
| Balance Type: |
na |
| Period Type: |
duration |
|
| X |
- DefinitionLocal phone number for entity.
| Name: |
dei_LocalPhoneNumber |
| Namespace Prefix: |
dei_ |
| Data Type: |
xbrli:normalizedStringItemType |
| Balance Type: |
na |
| Period Type: |
duration |
|
| X |
- DefinitionBoolean flag that is true when the Form 8-K filing is intended to satisfy the filing obligation of the registrant as pre-commencement communications pursuant to Rule 13e-4(c) under the Exchange Act. Reference 1: http://www.xbrl.org/2003/role/presentationRef
-Publisher SEC
-Name Exchange Act
-Number 240
-Section 13e
-Subsection 4c
| Name: |
dei_PreCommencementIssuerTenderOffer |
| Namespace Prefix: |
dei_ |
| Data Type: |
xbrli:booleanItemType |
| Balance Type: |
na |
| Period Type: |
duration |
|
| X |
- DefinitionBoolean flag that is true when the Form 8-K filing is intended to satisfy the filing obligation of the registrant as pre-commencement communications pursuant to Rule 14d-2(b) under the Exchange Act. Reference 1: http://www.xbrl.org/2003/role/presentationRef
-Publisher SEC
-Name Exchange Act
-Number 240
-Section 14d
-Subsection 2b
| Name: |
dei_PreCommencementTenderOffer |
| Namespace Prefix: |
dei_ |
| Data Type: |
xbrli:booleanItemType |
| Balance Type: |
na |
| Period Type: |
duration |
|
| X |
- DefinitionTitle of a 12(b) registered security. Reference 1: http://www.xbrl.org/2003/role/presentationRef
-Publisher SEC
-Name Exchange Act
-Number 240
-Section 12
-Subsection b
| Name: |
dei_Security12bTitle |
| Namespace Prefix: |
dei_ |
| Data Type: |
dei:securityTitleItemType |
| Balance Type: |
na |
| Period Type: |
duration |
|
| X |
- DefinitionName of the Exchange on which a security is registered. Reference 1: http://www.xbrl.org/2003/role/presentationRef
-Publisher SEC
-Name Exchange Act
-Number 240
-Section 12
-Subsection d1-1
| Name: |
dei_SecurityExchangeName |
| Namespace Prefix: |
dei_ |
| Data Type: |
dei:edgarExchangeCodeItemType |
| Balance Type: |
na |
| Period Type: |
duration |
|
| X |
- DefinitionBoolean flag that is true when the Form 8-K filing is intended to satisfy the filing obligation of the registrant as soliciting material pursuant to Rule 14a-12 under the Exchange Act. Reference 1: http://www.xbrl.org/2003/role/presentationRef
-Publisher SEC
-Name Exchange Act
-Section 14a
-Number 240
-Subsection 12
| Name: |
dei_SolicitingMaterial |
| Namespace Prefix: |
dei_ |
| Data Type: |
xbrli:booleanItemType |
| Balance Type: |
na |
| Period Type: |
duration |
|
| X |
- DefinitionTrading symbol of an instrument as listed on an exchange.
| Name: |
dei_TradingSymbol |
| Namespace Prefix: |
dei_ |
| Data Type: |
dei:tradingSymbolItemType |
| Balance Type: |
na |
| Period Type: |
duration |
|
| X |
- DefinitionBoolean flag that is true when the Form 8-K filing is intended to satisfy the filing obligation of the registrant as written communications pursuant to Rule 425 under the Securities Act. Reference 1: http://www.xbrl.org/2003/role/presentationRef
-Publisher SEC
-Name Securities Act
-Number 230
-Section 425
| Name: |
dei_WrittenCommunications |
| Namespace Prefix: |
dei_ |
| Data Type: |
xbrli:booleanItemType |
| Balance Type: |
na |
| Period Type: |
duration |
|
Icahn Enterprises (NASDAQ:IEP)
Historical Stock Chart
From Mar 2024 to Apr 2024

Icahn Enterprises (NASDAQ:IEP)
Historical Stock Chart
From Apr 2023 to Apr 2024
