false000158086400015808642023-11-072023-11-07
UNITED STATES
SECURITIES AND EXCHANGE COMMISSION
Washington, D.C. 20549
FORM 8-K
CURRENT REPORT
Pursuant to Section 13 or 15(d)
of the Securities Exchange Act of 1934
Date of report (Date of earliest event reported): November 7, 2023
VROOM, INC.
(Exact name of registrant as specified in its charter)
|
|
|
|
|
|
|
|
|
|
Delaware |
|
001-39315 |
|
90-1112566 |
(State or other jurisdiction of incorporation or organization) |
|
(Commission File Number) |
|
(I.R.S. Employer Identification No.) |
3600 W Sam Houston Pkwy S, Floor 4
Houston, Texas 77042
(Address of principal executive offices) (Zip Code)
(518) 535-9125
(Registrant’s telephone number, include area code)
N/A
(Former Name or Former Address, if Changed Since Last Report)
Check the appropriate box below if the Form 8-K filing is intended to simultaneously satisfy the filing obligation of the registrant under any of the following provisions:
|
|
☐ |
Written communications pursuant to Rule 425 under the Securities Act (17 CFR 230.425) |
|
|
☐ |
Soliciting material pursuant to Rule 14a-12 under the Exchange Act (17 CFR 240.14a-12) |
|
|
☐ |
Pre-commencement communications pursuant to Rule 14d-2(b) under the Exchange Act (17 CFR 240.14d-2(b)) |
|
|
☐ |
Pre-commencement communications pursuant to Rule 13e-4(c) under the Exchange Act (17 CFR 240.13e-4(c)) |
Securities registered pursuant to Section 12(b) of the Act:
|
|
|
Title of each class |
Trading Symbol(s) |
Name of each exchange on which registered |
Common Stock, $0.001 par value per share |
VRM |
The Nasdaq Global Select Market |
Indicate by check mark whether the registrant is an emerging growth company as defined in Rule 405 of the Securities Act of 1933 (§230.405 of this chapter) or Rule 12b-2 of the Securities Exchange Act of 1934 (§240.12b-2 of this chapter).
Emerging growth company ☐
If an emerging growth company, indicate by check mark if the registrant has elected not to use the extended transition period for complying with any new or revised financial accounting standards provided pursuant to Section 13(a) of the Exchange Act. ☐
Item 2.02. Results of Operations and Financial Condition.
On November 7, 2023, Vroom, Inc. (the “Company”) issued a press release announcing its financial results for the quarter ended September 30, 2023. A copy of the press release is furnished as Exhibit 99.1 to this Current Report on Form 8-K.
Item 7.01. Regulation FD Disclosure.
On November 8, 2023, members of the Company’s management will hold an earnings conference call to discuss the Company’s financial results for the quarter ended September 30, 2023, and the presentation furnished as Exhibit 99.2 to this Current Report on Form 8-K will accompany management’s comments.
The information contained in Item 2.02, including Exhibit 99.1 hereto and in Item 7.01, including Exhibit 99.2 hereto, shall not be deemed “filed” for purposes of Section 18 of the Securities Exchange Act of 1934, as amended (the “Exchange Act”), or otherwise subject to the liabilities of that section, nor shall it be deemed incorporated by reference in any filing made by the Company under the Securities Act of 1933, as amended, or the Exchange Act, regardless of any general incorporation language in such filings, unless expressly incorporated by specific reference in such filing.
Item 9.01. Financial Statements and Exhibits.
(d) Exhibits.
The following exhibits relating to Item 2.02 and Item 7.01 shall be deemed to be furnished, and not filed:
SIGNATURES
Pursuant to the requirements of the Securities Exchange Act of 1934, the registrant has duly caused this report to be signed on its behalf by the undersigned hereunto duly authorized.
|
|
|
|
|
|
|
VROOM, INC. |
|
|
|
Date: November 7, 2023 |
|
By: |
|
/s/ Robert R. Krakowiak |
|
|
|
|
Robert R. Krakowiak |
|
|
|
|
Chief Financial Officer |

Exhibit 99.1
Vroom Announces Third Quarter 2023 Results
Continued Progress on Long-Term Roadmap Driving Unit Growth, GPPU Improvement and Cost Reductions
NEW YORK – November 7, 2023 – Vroom, Inc. (Nasdaq:VRM), a leading ecommerce platform for buying and selling used vehicles, today announced financial results for the third quarter ended September 30, 2023.
HIGHLIGHTS OF THIRD QUARTER 2023 VERSUS SECOND QUARTER 2023
•11% sequential growth in Ecommerce units
•$3,144 Ecommerce gross profit per unit (GPPU) as compared to $2,954
•Continued reductions in fixed costs per unit as well as per unit costs across marketing, logistics, and titling and registrations and support
•$(82.9) million net loss as compared to $(66.3) million
•$(64.5) million Adjusted EBITDA as compared to $(56.3) million
Tom Shortt, Chief Executive Officer of Vroom, said, “In the third quarter of 2023, consistent with our Long-Term Roadmap, we continued to make progress on our three key objectives and four strategic initiatives. Our ecommerce unit growth rate doubled sequentially to 11%, while we also sequentially improved GPPU and reduced SG&A spend. Ecommerce GPPU increased to $3,144 in Q3 2023 from $2,954 in Q2 2023, benefiting from an improved mix of unaged vehicles sold within the quarter. During the third quarter of 2023, 34% of our units sold were aged units, or units held greater than 180 days. Adjusted EBITDA declined sequentially, driven by headwinds in the loan portfolio performance at UACC due to higher delinquencies and realized net losses, partially offset by improved unit economics. We continue to drive process improvements across titling and registration, pricing, marketing, sales, reconditioning and logistics.”
Bob Krakowiak, Vroom’s Chief Financial Officer, commented, “We succeeded in reducing per-unit costs across 1) marketing, 2) logistics, 3) titling, registration and support, and 4) fixed costs. We further strengthened our balance sheet by recovering $48 million of cash trapped on the balance sheet as we sold through aged inventory, and ended the quarter with cash and cash equivalents of approximately $209 million. We will continue to pursue opportunities to reduce costs, strengthen our balance sheet and enhance our liquidity and intend to seek additional capital through equity or debt financing.”
THIRD QUARTER 2023 FINANCIAL DISCUSSION
All financial comparisons are on a year-over-year basis unless otherwise noted.
Ecommerce Results
|
|
|
|
|
|
|
|
|
|
|
|
|
|
|
|
|
|
|
|
|
|
|
|
|
|
|
|
|
|
|
|
|
|
|
|
|
|
|
|
|
Three Months Ended
September 30, |
|
|
|
|
|
|
|
|
|
Nine Months Ended
September 30, |
|
|
|
|
|
|
|
|
|
|
2023 |
|
|
2022 |
|
|
|
Change |
|
|
% Change |
|
|
2023 |
|
|
2022 |
|
|
|
Change |
|
|
% Change |
|
|
|
(in thousands, except unit
data and average days to sale) |
|
|
|
|
|
|
|
|
|
(in thousands, except unit
data and average days to sale) |
|
|
|
|
|
|
|
|
Ecommerce units sold |
|
|
|
4,561 |
|
|
|
|
6,428 |
|
|
|
|
(1,867 |
) |
|
|
(29.0 |
)% |
|
|
|
12,621 |
|
|
|
|
35,134 |
|
|
|
|
(22,513 |
) |
|
|
(64.1 |
)% |
Ecommerce revenue: |
|
|
|
|
|
|
|
|
|
|
|
|
|
|
|
|
|
|
|
|
|
|
|
|
|
|
|
|
|
|
Vehicle revenue |
|
$ |
|
136,949 |
|
|
$ |
|
212,980 |
|
|
$ |
|
(76,031 |
) |
|
|
(35.7 |
)% |
|
$ |
|
387,585 |
|
|
$ |
|
1,173,727 |
|
|
$ |
|
(786,142 |
) |
|
|
(67.0 |
)% |
Product revenue |
|
|
|
12,902 |
|
|
|
|
12,461 |
|
|
|
|
441 |
|
|
|
3.5 |
% |
|
|
|
36,128 |
|
|
|
|
48,709 |
|
|
|
|
(12,581 |
) |
|
|
(25.8 |
)% |
Total ecommerce revenue |
|
$ |
|
149,851 |
|
|
$ |
|
225,441 |
|
|
$ |
|
(75,590 |
) |
|
|
(33.5 |
)% |
|
$ |
|
423,713 |
|
|
$ |
|
1,222,436 |
|
|
$ |
|
(798,723 |
) |
|
|
(65.3 |
)% |
Ecommerce gross profit: |
|
|
|
|
|
|
|
|
|
|
|
|
|
|
|
|
|
|
|
|
|
|
|
|
|
|
|
|
|
|
Vehicle gross profit |
|
$ |
|
2,354 |
|
|
$ |
|
14,573 |
|
|
$ |
|
(12,219 |
) |
|
|
(83.8 |
)% |
|
$ |
|
2,956 |
|
|
$ |
|
46,153 |
|
|
$ |
|
(43,197 |
) |
|
|
(93.6 |
)% |
Product gross profit |
|
|
|
11,985 |
|
|
|
|
12,461 |
|
|
|
|
(476 |
) |
|
|
(3.8 |
)% |
|
|
|
33,610 |
|
|
|
|
48,709 |
|
|
|
|
(15,099 |
) |
|
|
(31.0 |
)% |
Total ecommerce gross profit |
|
$ |
|
14,339 |
|
|
$ |
|
27,034 |
|
|
$ |
|
(12,695 |
) |
|
|
(47.0 |
)% |
|
$ |
|
36,566 |
|
|
$ |
|
94,862 |
|
|
$ |
|
(58,296 |
) |
|
|
(61.5 |
)% |
Average vehicle selling price per ecommerce unit |
|
$ |
|
30,026 |
|
|
$ |
|
33,133 |
|
|
$ |
|
(3,107 |
) |
|
|
(9.4 |
)% |
|
$ |
|
30,710 |
|
|
$ |
|
33,407 |
|
|
$ |
|
(2,697 |
) |
|
|
(8.1 |
)% |
Product revenue per ecommerce unit |
|
|
|
2,829 |
|
|
|
|
1,939 |
|
|
|
|
890 |
|
|
|
45.9 |
% |
|
|
|
2,863 |
|
|
|
|
1,386 |
|
|
|
|
1,477 |
|
|
|
106.5 |
% |
Gross profit per ecommerce unit: |
|
|
|
|
|
|
|
|
|
|
|
|
|
|
|
|
|
|
|
|
|
|
|
|
|
|
|
|
|
|
Vehicle gross profit per ecommerce unit |
|
$ |
|
516 |
|
|
$ |
|
2,267 |
|
|
$ |
|
(1,751 |
) |
|
|
(77.2 |
)% |
|
$ |
|
234 |
|
|
$ |
|
1,314 |
|
|
$ |
|
(1,080 |
) |
|
|
(82.2 |
)% |
Product gross profit per ecommerce unit |
|
|
|
2,628 |
|
|
|
|
1,939 |
|
|
|
|
689 |
|
|
|
35.5 |
% |
|
|
|
2,663 |
|
|
|
|
1,386 |
|
|
|
|
1,277 |
|
|
|
92.1 |
% |
Total gross profit per ecommerce unit |
|
$ |
|
3,144 |
|
|
$ |
|
4,206 |
|
|
$ |
|
(1,062 |
) |
|
|
(25.2 |
)% |
|
$ |
|
2,897 |
|
|
$ |
|
2,700 |
|
|
$ |
|
197 |
|
|
|
7.3 |
% |
Ecommerce average days to sale |
|
|
|
202 |
|
|
|
|
186 |
|
|
|
|
16 |
|
|
|
8.6 |
% |
|
|
|
266 |
|
|
|
|
118 |
|
|
|
|
148 |
|
|
|
125.4 |
% |
2
Results by Segment
|
|
|
|
|
|
|
|
|
|
|
|
|
|
|
|
|
|
|
|
|
|
|
|
|
|
|
|
|
|
|
|
|
|
|
Three Months Ended
September 30, |
|
|
|
|
|
|
|
|
Nine Months Ended
September 30, |
|
|
|
|
|
|
|
|
|
2023 |
|
|
2022 |
|
|
Change |
|
|
% Change |
|
|
2023 |
|
|
2022 |
|
|
Change |
|
|
% Change |
|
|
|
(in thousands, except unit data) |
|
|
|
|
|
|
|
|
(in thousands, except unit data) |
|
|
|
|
|
|
|
Units: |
|
|
|
|
|
|
|
|
|
|
|
|
|
|
|
|
|
|
|
|
|
|
|
|
Ecommerce |
|
|
4,561 |
|
|
|
6,428 |
|
|
|
(1,867 |
) |
|
|
(29.0 |
)% |
|
|
12,621 |
|
|
|
35,134 |
|
|
|
(22,513 |
) |
|
|
(64.1 |
)% |
Wholesale |
|
|
2,270 |
|
|
|
3,128 |
|
|
|
(858 |
) |
|
|
(27.4 |
)% |
|
|
5,273 |
|
|
|
19,108 |
|
|
|
(13,835 |
) |
|
|
(72.4 |
)% |
All Other (1) |
|
|
357 |
|
|
|
662 |
|
|
|
(305 |
) |
|
|
(46.1 |
)% |
|
|
1,022 |
|
|
|
3,408 |
|
|
|
(2,386 |
) |
|
|
(70.0 |
)% |
Total units |
|
|
7,188 |
|
|
|
10,218 |
|
|
|
(3,030 |
) |
|
|
(29.7 |
)% |
|
|
18,916 |
|
|
|
57,650 |
|
|
|
(38,734 |
) |
|
|
(67.2 |
)% |
|
|
|
|
|
|
|
|
|
|
|
|
|
|
|
|
|
|
|
|
|
|
|
|
|
Revenue: |
|
|
|
|
|
|
|
|
|
|
|
|
|
|
|
|
|
|
|
|
|
|
|
|
Ecommerce |
|
$ |
149,851 |
|
|
$ |
225,441 |
|
|
$ |
(75,590 |
) |
|
|
(33.5 |
)% |
|
$ |
423,713 |
|
|
$ |
1,222,436 |
|
|
$ |
(798,723 |
) |
|
|
(65.3 |
)% |
Wholesale |
|
|
30,898 |
|
|
|
47,604 |
|
|
|
(16,706 |
) |
|
|
(35.1 |
)% |
|
|
75,593 |
|
|
|
270,489 |
|
|
|
(194,896 |
) |
|
|
(72.1 |
)% |
Retail Financing (2) |
|
|
40,823 |
|
|
|
40,654 |
|
|
|
169 |
|
|
|
0.4 |
% |
|
|
114,939 |
|
|
|
120,005 |
|
|
|
(5,066 |
) |
|
|
(4.2 |
)% |
All Other (3) |
|
|
14,062 |
|
|
|
27,098 |
|
|
|
(13,036 |
) |
|
|
(48.1 |
)% |
|
|
43,034 |
|
|
|
126,622 |
|
|
|
(83,588 |
) |
|
|
(66.0 |
)% |
Total revenue |
|
$ |
235,634 |
|
|
$ |
340,797 |
|
|
$ |
(105,163 |
) |
|
|
(30.9 |
)% |
|
$ |
657,279 |
|
|
$ |
1,739,552 |
|
|
$ |
(1,082,273 |
) |
|
|
(62.2 |
)% |
Gross profit (loss): |
|
|
|
|
|
|
|
|
|
|
|
|
|
|
|
|
|
|
|
|
|
|
|
|
Ecommerce |
|
$ |
14,339 |
|
|
$ |
27,034 |
|
|
$ |
(12,695 |
) |
|
|
(47.0 |
)% |
|
$ |
36,566 |
|
|
$ |
94,862 |
|
|
$ |
(58,296 |
) |
|
|
(61.5 |
)% |
Wholesale |
|
|
(1,495 |
) |
|
|
(1,574 |
) |
|
|
79 |
|
|
|
5.0 |
% |
|
|
(5,426 |
) |
|
|
(6,260 |
) |
|
|
834 |
|
|
|
13.3 |
% |
Retail Financing (2) |
|
|
32,341 |
|
|
|
35,954 |
|
|
|
(3,613 |
) |
|
|
(10.0 |
)% |
|
|
92,184 |
|
|
|
109,637 |
|
|
|
(17,453 |
) |
|
|
(15.9 |
)% |
All Other (3) |
|
|
2,909 |
|
|
|
5,917 |
|
|
|
(3,008 |
) |
|
|
(50.8 |
)% |
|
|
9,576 |
|
|
|
17,089 |
|
|
|
(7,513 |
) |
|
|
(44.0 |
)% |
Total gross profit |
|
$ |
48,094 |
|
|
$ |
67,331 |
|
|
$ |
(19,237 |
) |
|
|
(28.6 |
)% |
|
$ |
132,900 |
|
|
$ |
215,328 |
|
|
$ |
(82,428 |
) |
|
|
(38.3 |
)% |
Gross profit (loss) per unit (4): |
|
|
|
|
|
|
|
|
|
|
|
|
|
|
|
|
|
|
|
|
|
|
|
|
Ecommerce |
|
$ |
3,144 |
|
|
$ |
4,206 |
|
|
$ |
(1,062 |
) |
|
|
(25.2 |
)% |
|
$ |
2,897 |
|
|
$ |
2,700 |
|
|
$ |
197 |
|
|
|
7.3 |
% |
Wholesale |
|
$ |
(659 |
) |
|
$ |
(503 |
) |
|
$ |
(156 |
) |
|
|
31.0 |
% |
|
$ |
(1,029 |
) |
|
$ |
(328 |
) |
|
$ |
(701 |
) |
|
|
213.7 |
% |
(1)All Other units consist of retail sales of used vehicles from TDA.
(2)The Retail Financing segment represents UACC’s operations with its network of third-party dealership customers as of the closing of the UACC acquisition in February 2022.
(3)All Other revenues and gross profit consist of retail sales of used vehicles from TDA and fees earned on sales of value-added products associated with those vehicles sales and the CarStory business.
(4)Gross profit per unit metrics exclude the Retail Financing gross profit and All Other gross profit.
SG&A
|
|
|
|
|
|
|
|
|
|
|
|
|
|
|
|
|
|
|
|
|
|
|
|
|
|
|
|
|
|
|
|
|
|
|
|
|
|
|
Three Months Ended
September 30, |
|
|
|
|
|
|
|
|
Nine Months Ended
September 30, |
|
|
|
|
|
|
|
|
|
|
2023 |
|
|
|
2022 |
|
|
Change |
|
|
% Change |
|
|
|
2023 |
|
|
|
2022 |
|
|
Change |
|
|
% Change |
|
|
|
(in thousands) |
|
|
|
|
|
|
|
|
(in thousands) |
|
|
|
|
|
|
|
Compensation & benefits |
|
$ |
|
37,695 |
|
|
$ |
|
55,694 |
|
|
$ |
(17,999 |
) |
|
|
(32.3 |
)% |
|
$ |
|
130,318 |
|
|
$ |
|
199,111 |
|
|
$ |
(68,793 |
) |
|
|
(34.6 |
)% |
Marketing expense |
|
|
|
13,429 |
|
|
|
|
14,945 |
|
|
|
(1,516 |
) |
|
|
(10.1 |
)% |
|
|
|
39,871 |
|
|
|
|
69,818 |
|
|
|
(29,947 |
) |
|
|
(42.9 |
)% |
Outbound logistics |
|
|
|
2,209 |
|
|
|
|
4,945 |
|
|
|
(2,736 |
) |
|
|
(55.3 |
)% |
|
|
|
6,251 |
|
|
|
|
39,925 |
|
|
|
(33,674 |
) |
|
|
(84.3 |
)% |
Occupancy and related costs |
|
|
|
4,575 |
|
|
|
|
6,041 |
|
|
|
(1,466 |
) |
|
|
(24.3 |
)% |
|
|
|
13,600 |
|
|
|
|
17,408 |
|
|
|
(3,808 |
) |
|
|
(21.9 |
)% |
Professional fees |
|
|
|
5,277 |
|
|
|
|
6,459 |
|
|
|
(1,182 |
) |
|
|
(18.3 |
)% |
|
|
|
15,504 |
|
|
|
|
26,585 |
|
|
|
(11,081 |
) |
|
|
(41.7 |
)% |
Software and IT costs |
|
|
|
9,227 |
|
|
|
|
11,277 |
|
|
|
(2,050 |
) |
|
|
(18.2 |
)% |
|
|
|
27,555 |
|
|
|
|
33,406 |
|
|
|
(5,851 |
) |
|
|
(17.5 |
)% |
Other |
|
|
|
7,174 |
|
|
|
|
35,282 |
|
|
|
(28,108 |
) |
|
|
(79.7 |
)% |
|
|
|
29,979 |
|
|
|
|
89,374 |
|
|
|
(59,395 |
) |
|
|
(66.5 |
)% |
Total selling, general & administrative expenses |
|
$ |
|
79,586 |
|
|
$ |
|
134,643 |
|
|
$ |
(55,057 |
) |
|
|
(40.9 |
)% |
|
$ |
|
263,078 |
|
|
$ |
|
475,627 |
|
|
$ |
(212,549 |
) |
|
|
(44.7 |
)% |
3
Non-GAAP Financial Measures
In addition to our results determined in accordance with U.S. GAAP, we believe the following non-GAAP financial measures are useful in evaluating our operating performance:
•Adjusted EBITDA excluding non-recurring costs to address operational and customer experience issues;
•Adjusted EBITDA excluding securitization gain;
•Adjusted EBITDA excluding securitization gain and non-recurring costs to address operational and customer experience issues;
These non-GAAP financial measures have limitations as analytical tools in that they do not reflect all of the amounts associated with our results of operations as determined in accordance with U.S. GAAP. Because of these limitations, these non-GAAP financial measures should be considered along with other operating and financial performance measures presented in accordance with U.S. GAAP. The presentation of these non-GAAP financial measures is not intended to be considered in isolation or as a substitute for, or superior to, financial information prepared and presented in accordance with U.S. GAAP. We have reconciled all non-GAAP financial measures with the most directly comparable U.S. GAAP financial measures.
EBITDA, Adjusted EBITDA, Adjusted EBITDA excluding non-recurring costs to address operational and customer experience issues, Adjusted EBITDA excluding securitization gain, and Adjusted EBITDA excluding securitization gain and non-recurring costs to address operational and customer experience issues are supplemental performance measures that our management uses to assess our operating performance and the operating leverage in our business. Because each of these non-GAAP financial measures facilitate internal comparisons of our historical operating performance on a more consistent basis, we use these measures for business planning purposes.
EBITDA
We calculate EBITDA as net loss before interest expense, interest income, income tax expense and depreciation and amortization expense.
Adjusted EBITDA
We calculate Adjusted EBITDA as EBITDA adjusted to exclude severance costs, gain on debt extinguishment, severe weather-related costs, goodwill impairment charge, realignment costs, acquisition related costs, and other costs which relate to impairment of long-lived assets. Changes in fair value of financial instruments can fluctuate significantly from period to period and previously related primarily to historical loans and debt which have been securitized, and acquired on February 1, 2022 from UACC. Our ongoing business model is to originate or purchase finance receivables with the intent to sell which we recognize at the lower of cost or fair value. As a result of current market conditions, the financial instruments related to the 2022-2 and 2023-1 securitization transactions are recognized on balance-sheet and accounted for under the fair value option. See Note 16 — Financial Instruments and Fair Value Measurements to our condensed consolidated financial statements included in our Quarterly Report on Form 10-Q for the three months ended September 30, 2023. As a result, the majority of our finance receivables are now carried at fair value and a significant portion of the risk of loss associated with these finance receivables have been retained by UACC. We therefore have determined we will no longer make any adjustments for such fluctuations in fair value to our Adjusted EBITDA results. We have recast the prior period presented to conform to current period presentation. We may account for future securitizations as on balance sheet transactions depending on the market conditions.
4
Adjusted EBITDA excluding non-recurring costs to address operational and customer experience issues
We calculate Adjusted EBITDA excluding non-recurring costs to address operational and customer
experience issues as Adjusted EBITDA adjusted to exclude the non-recurring costs incurred to address operational and customer experience issues, including rental cars for our customers and legal settlements with customers and state DMVs. While we expect to continue to incur these costs over the next few quarterly periods, we expect such costs to continue to decline due to the improvements across our operations.
Adjusted EBITDA excluding securitization gain
We calculate Adjusted EBITDA excluding securitization gain as Adjusted EBITDA adjusted to exclude the securitization gain from the sale of UACC's finance receivables, and believe that it provides a useful perspective on the underlying operating results and trends and a means to compare our period-over-period results.
Adjusted EBITDA excluding securitization gain and non-recurring costs to address operational and customer experience issues
We calculate Adjusted EBITDA excluding securitization gain and non-recurring costs to address operational and customer experience issues as Adjusted EBITDA adjusted to exclude the securitization gain from the sale of UACC’s finance receivables and the non-recurring costs incurred to address operational and customer experience issues.
The following table presents a reconciliation of the foregoing non-GAAP financial measures to net loss, which is the most directly comparable U.S. GAAP measure:
|
|
|
|
|
|
|
|
|
|
|
|
|
|
|
|
|
|
|
Three Months Ended
September 30, |
|
|
Nine Months Ended
September 30, |
|
|
|
2023 |
|
|
2022 |
|
|
2023 |
|
|
2022 |
|
|
|
(in thousands) |
|
|
(in thousands) |
|
Net loss |
|
$ |
(82,857 |
) |
|
$ |
(51,127 |
) |
|
$ |
(224,219 |
) |
|
$ |
(476,675 |
) |
Adjusted to exclude the following: |
|
|
|
|
|
|
|
|
|
|
|
|
Interest expense |
|
|
12,058 |
|
|
|
9,704 |
|
|
|
30,915 |
|
|
|
28,617 |
|
Interest income |
|
|
(5,506 |
) |
|
|
(5,104 |
) |
|
|
(16,369 |
) |
|
|
(12,991 |
) |
Provision (benefit) for income taxes |
|
|
260 |
|
|
|
899 |
|
|
|
918 |
|
|
|
(22,085 |
) |
Depreciation and amortization |
|
|
11,248 |
|
|
|
9,995 |
|
|
|
32,421 |
|
|
|
28,005 |
|
EBITDA |
|
$ |
(64,797 |
) |
|
$ |
(35,633 |
) |
|
$ |
(176,334 |
) |
|
$ |
(455,129 |
) |
Severance costs |
|
$ |
274 |
|
|
$ |
— |
|
|
$ |
6,655 |
|
|
$ |
— |
|
Gain on debt extinguishment |
|
|
— |
|
|
|
(37,917 |
) |
|
|
(19,640 |
) |
|
|
(37,917 |
) |
Hail storm costs |
|
|
— |
|
|
|
— |
|
|
|
2,353 |
|
|
|
— |
|
Goodwill impairment charge |
|
|
— |
|
|
|
— |
|
|
|
— |
|
|
|
201,703 |
|
Realignment costs |
|
|
— |
|
|
|
3,243 |
|
|
|
— |
|
|
|
12,772 |
|
Acquisition related costs |
|
|
— |
|
|
|
— |
|
|
|
— |
|
|
|
5,653 |
|
Other |
|
|
— |
|
|
|
— |
|
|
|
1,352 |
|
|
|
2,127 |
|
Adjusted EBITDA |
|
$ |
(64,523 |
) |
|
$ |
(70,307 |
) |
|
$ |
(185,614 |
) |
|
$ |
(270,791 |
) |
Non-recurring costs to address operational and customer experience issues |
|
|
32 |
|
|
|
15,785 |
|
|
|
818 |
|
|
|
25,059 |
|
Adjusted EBITDA excluding non-recurring costs to address operational and customer experience issues |
|
$ |
(64,491 |
) |
|
$ |
(54,522 |
) |
|
$ |
(184,796 |
) |
|
$ |
(245,732 |
) |
Securitization gain |
|
|
— |
|
|
|
(15,972 |
) |
|
|
— |
|
|
|
(45,589 |
) |
Adjusted EBITDA excluding securitization gain |
|
$ |
(64,523 |
) |
|
$ |
(86,279 |
) |
|
$ |
(185,614 |
) |
|
$ |
(316,380 |
) |
Adjusted EBITDA excluding securitization gain and non-recurring costs to address operational and customer experience issues |
|
$ |
(64,491 |
) |
|
$ |
(70,494 |
) |
|
$ |
(184,796 |
) |
|
$ |
(291,321 |
) |
5
THIRD QUARTER 2023 AS COMPARED TO SECOND QUARTER 2023
|
|
|
|
|
|
|
|
|
|
|
|
|
|
|
|
|
|
|
Three Months Ended
September 30, |
|
|
Three Months Ended
June 30, |
|
|
|
|
|
|
|
|
|
2023 |
|
|
2023 |
|
|
Change |
|
|
% Change |
|
|
(in thousands, except unit data) |
|
|
|
|
|
|
|
Total revenues |
|
$ |
235,634 |
|
|
$ |
225,178 |
|
|
$ |
10,456 |
|
|
|
4.6 |
% |
Total gross profit |
|
$ |
48,094 |
|
|
$ |
46,001 |
|
|
$ |
2,093 |
|
|
|
4.5 |
% |
Ecommerce units sold |
|
|
4,561 |
|
|
|
4,127 |
|
|
|
434 |
|
|
|
10.5 |
% |
Ecommerce revenue |
|
$ |
149,851 |
|
|
$ |
138,225 |
|
|
$ |
11,626 |
|
|
|
8.4 |
% |
Ecommerce gross profit |
|
$ |
14,339 |
|
|
$ |
12,189 |
|
|
$ |
2,150 |
|
|
|
17.6 |
% |
Vehicle gross profit (loss) per ecommerce unit |
|
$ |
516 |
|
|
$ |
290 |
|
|
$ |
226 |
|
|
|
77.9 |
% |
Product gross profit per ecommerce unit |
|
|
2,628 |
|
|
|
2,664 |
|
|
|
(36 |
) |
|
|
(1.4 |
)% |
Total gross profit per ecommerce unit |
|
$ |
3,144 |
|
|
$ |
2,954 |
|
|
$ |
190 |
|
|
|
6.4 |
% |
Wholesale units sold |
|
|
2,270 |
|
|
|
1,834 |
|
|
|
436 |
|
|
|
23.8 |
% |
Wholesale revenue |
|
$ |
30,898 |
|
|
$ |
30,800 |
|
|
$ |
98 |
|
|
|
0.3 |
% |
Wholesale gross (loss) profit |
|
$ |
(1,495 |
) |
|
$ |
(3,993 |
) |
|
$ |
2,498 |
|
|
|
62.6 |
% |
Wholesale gross (loss) profit per unit |
|
$ |
(659 |
) |
|
$ |
(2,177 |
) |
|
$ |
1,518 |
|
|
|
69.7 |
% |
Retail Financing revenue |
|
$ |
40,823 |
|
|
$ |
42,128 |
|
|
$ |
(1,305 |
) |
|
|
(3.1 |
)% |
Retail Financing gross profit |
|
$ |
32,341 |
|
|
$ |
34,068 |
|
|
$ |
(1,727 |
) |
|
|
(5.1 |
)% |
Total selling, general, and administrative expenses |
|
$ |
79,586 |
|
|
$ |
86,955 |
|
|
$ |
(7,369 |
) |
|
|
(8.5 |
)% |
|
|
|
|
|
|
|
|
|
|
|
|
|
|
|
|
|
|
|
Three Months Ended
September 30, |
|
|
Three Months Ended
June 30, |
|
|
|
|
|
|
|
|
|
2023 |
|
|
2023 |
|
|
Change |
|
|
% Change |
|
|
|
(in thousands) |
|
|
|
|
Net loss |
|
$ |
(82,857 |
) |
|
$ |
(66,318 |
) |
|
$ |
(16,539 |
) |
|
|
24.9 |
% |
Adjusted to exclude the following: |
|
|
|
|
|
|
|
|
|
|
|
|
Interest expense |
|
|
12,058 |
|
|
|
8,938 |
|
|
|
3,120 |
|
|
|
34.9 |
% |
Interest income |
|
|
(5,506 |
) |
|
|
(4,921 |
) |
|
|
(585 |
) |
|
|
11.9 |
% |
Provision for income taxes |
|
|
260 |
|
|
|
385 |
|
|
|
(125 |
) |
|
|
(32.5 |
)% |
Depreciation and amortization |
|
|
11,248 |
|
|
|
10,536 |
|
|
|
712 |
|
|
|
6.8 |
% |
EBITDA |
|
$ |
(64,797 |
) |
|
$ |
(51,380 |
) |
|
$ |
(13,417 |
) |
|
|
26.1 |
% |
Severance costs |
|
$ |
274 |
|
|
$ |
2,277 |
|
|
$ |
(2,003 |
) |
|
|
(88.0 |
)% |
Gain on debt extinguishment |
|
|
— |
|
|
|
(10,931 |
) |
|
|
10,931 |
|
|
|
100.0 |
% |
Hail storm costs |
|
|
— |
|
|
|
2,353 |
|
|
|
(2,353 |
) |
|
|
(100.0 |
)% |
Other |
|
|
— |
|
|
|
1,352 |
|
|
|
(1,352 |
) |
|
|
(100.0 |
)% |
Adjusted EBITDA |
|
$ |
(64,523 |
) |
|
$ |
(56,329 |
) |
|
$ |
(8,194 |
) |
|
|
14.5 |
% |
Non-recurring costs to address operational and customer experience issues |
|
|
32 |
|
|
|
126 |
|
|
|
(94 |
) |
|
|
(74.3 |
)% |
Adjusted EBITDA excluding non-recurring costs to address operational and customer experience issues |
|
$ |
(64,491 |
) |
|
$ |
(56,203 |
) |
|
$ |
(8,288 |
) |
|
|
(14.7 |
)% |
Securitization gain |
|
|
— |
|
|
|
— |
|
|
|
— |
|
|
|
0.0 |
% |
Adjusted EBITDA excluding securitization gain |
|
$ |
(64,523 |
) |
|
$ |
(56,329 |
) |
|
$ |
(8,194 |
) |
|
|
14.5 |
% |
Adjusted EBITDA excluding securitization gain and non-recurring costs to address operational and customer experience issues |
|
$ |
(64,491 |
) |
|
$ |
(56,203 |
) |
|
$ |
(8,288 |
) |
|
|
14.7 |
% |
6
Financial Outlook
For the full year 2023, we updated our guidance on Adjusted EBITDA performance and year-end cash and cash equivalents:
•Adjusted EBITDA(1) of $(245.0) to $(225.0) million;
•Year-end cash and cash equivalents of $137.0 to $162.0 million.
(1) A reconciliation of non-GAAP guidance measures to corresponding GAAP measures for the full year 2023 Financial Outlook is not available on a forward-looking basis without unreasonable effort due to the uncertainty regarding, and the potential variability of, the costs and expenses that may be incurred in the future. We have provided a reconciliation of GAAP to non-GAAP financial measures for the third quarter 2023 in the reconciliation table in the Non-GAAP Financial Measures section above.
The foregoing estimates are forward-looking statements that reflect the Company’s expectations as of November 7, 2023 and are subject to substantial uncertainty. See “Forward-Looking Statements” below.
Conference Call & Webcast Information
Vroom management will discuss these results and other information regarding the Company during a conference call and audio webcast Wednesday, November 8, 2023 at 8:30 a.m. ET.
To access the conference call, please register at this embedded link. Registered participants will be sent a unique PIN to access the call. A listen-only webcast will also be available via the same link and at ir.vroom.com. An archived webcast of the conference call will be accessible on the website within 48 hours of its completion.
About Vroom (Nasdaq: VRM)
Vroom is an innovative, end-to-end ecommerce platform that offers a better way to buy and a better way to sell used vehicles. The Company’s scalable, data-driven technology brings all phases of the vehicle buying and selling process to consumers wherever they are and offers an extensive selection of vehicles, transparent pricing, competitive financing, and contact-free, at-home pick-up and delivery. For more information visit www.vroom.com.
7
Forward-Looking Statements
This press release contains forward-looking statements within the meaning of the Private Securities Litigation Reform Act of 1995. All statements contained in this press release that do not relate to matters of historical fact should be considered forward-looking statements, including without limitation statements regarding expected timelines with respect to, our execution of and the expected benefits from our long term roadmap, declining costs due to improvements across our operations, and other cost-saving initiatives; our future results of operations and financial position, including for the full year 2023; our ability to improve our unit economics and future growth, including with respect to our Adjusted EBITDA and liquidity, our ability to improve our transaction processes, increase and optimize our internal sales force, sell through aged vehicles and the potential impacts as we sell through our inventory, improve variable cost per unit, such as logistics costs and marketing costs, and reduce fixed costs; and our plans to enhance liquidity and strengthen our balance sheet, including by seeking additional capital through equity or debt financing. These statements are based on management’s current assumptions and are neither promises nor guarantees, but involve known and unknown risks, uncertainties and other important factors that may cause our actual results, performance or achievements to be materially different from any future results, performance or achievements expressed or implied by the forward-looking statements. For factors that could cause actual results to differ materially from the forward-looking statements in this press release, please see the risks and uncertainties identified under the heading "Risk Factors" in our Annual Report on Form 10-K for the year ended December 31, 2022, as updated by our Quarterly report on Form 10-Q for the quarter ended September 30, 2023, which is available on our Investor Relations website at ir.vroom.com and on the SEC website at www.sec.gov. All forward-looking statements reflect our beliefs and assumptions only as of the date of this press release. We undertake no obligation to update forward-looking statements to reflect future events or circumstances.
Investor Relations:
Vroom
Jon Sandison
investors@vroom.com
Media Contact:
Vroom
Chris Hayes
chris.hayes@vroom.com
8
VROOM, INC.
CONDENSED CONSOLIDATED BALANCE SHEETS
(in thousands, except share and per share amounts)
(unaudited)
|
|
|
|
|
|
|
|
|
|
|
As of
September 30, |
|
|
As of
December 31, |
|
|
|
2023 |
|
|
2022 |
|
ASSETS |
|
|
|
|
|
|
Current Assets: |
|
|
|
|
|
|
Cash and cash equivalents |
|
$ |
208,562 |
|
|
$ |
398,915 |
|
Restricted cash (including restricted cash of consolidated VIEs of $47.2 million and $24.7 million, respectively) |
|
|
80,517 |
|
|
|
73,095 |
|
Accounts receivable, net of allowance of $8.9 million and $21.5 million, respectively |
|
|
9,022 |
|
|
|
13,967 |
|
Finance receivables at fair value (including finance receivables of consolidated VIEs of $12.2 million and $11.5 million, respectively) |
|
|
12,901 |
|
|
|
12,939 |
|
Finance receivables held for sale, net (including finance receivables of consolidated VIEs of $338.4 million and $305.9 million, respectively) |
|
|
399,836 |
|
|
|
321,626 |
|
Inventory |
|
|
240,676 |
|
|
|
320,648 |
|
Beneficial interests in securitizations |
|
|
5,287 |
|
|
|
20,592 |
|
Prepaid expenses and other current assets (including other current assets of consolidated VIEs of $24.3 million and $11.7 million, respectively) |
|
|
56,889 |
|
|
|
58,327 |
|
Total current assets |
|
|
1,013,690 |
|
|
|
1,220,109 |
|
Finance receivables at fair value (including finance receivables of consolidated VIEs of $376.7 million and $119.6 million, respectively) |
|
|
387,796 |
|
|
|
140,235 |
|
Property and equipment, net |
|
|
49,220 |
|
|
|
50,201 |
|
Intangible assets, net |
|
|
138,644 |
|
|
|
158,910 |
|
Operating lease right-of-use assets |
|
|
30,836 |
|
|
|
23,568 |
|
Other assets (including other assets of consolidated VIEs of $2.0 million and $0 million, respectively) |
|
|
26,525 |
|
|
|
26,004 |
|
Total assets |
|
$ |
1,646,711 |
|
|
$ |
1,619,027 |
|
LIABILITIES AND STOCKHOLDERS’ EQUITY |
|
|
|
|
|
|
Current Liabilities: |
|
|
|
|
|
|
Accounts payable |
|
$ |
27,280 |
|
|
$ |
34,702 |
|
Accrued expenses (including accrued expenses of consolidated VIEs of $3.3 million and $1.5 million, respectively) |
|
|
57,435 |
|
|
|
76,795 |
|
Vehicle floorplan |
|
|
212,486 |
|
|
|
276,988 |
|
Warehouse credit facilities of consolidated VIEs |
|
|
294,653 |
|
|
|
229,518 |
|
Current portion of long term debt (including current portion of securitization debt of consolidated VIEs at fair value of $186.6 million and $47.2 million, respectively) |
|
|
197,045 |
|
|
|
47,239 |
|
Deferred revenue |
|
|
12,487 |
|
|
|
10,655 |
|
Operating lease liabilities, current |
|
|
9,511 |
|
|
|
9,730 |
|
Other current liabilities |
|
|
12,284 |
|
|
|
17,693 |
|
Total current liabilities |
|
|
823,181 |
|
|
|
703,320 |
|
Long term debt, net of current portion (including securitization debt of consolidated VIEs of $175.3 million and $32.6 million at fair value, respectively) |
|
|
521,353 |
|
|
|
402,154 |
|
Operating lease liabilities, excluding current portion |
|
|
26,938 |
|
|
|
20,129 |
|
Other long-term liabilities (including other long-term liabilities of consolidated VIEs of $9.5 million and $7.4 million, respectively) |
|
|
16,969 |
|
|
|
18,183 |
|
Total liabilities |
|
|
1,388,441 |
|
|
|
1,143,786 |
|
Commitments and contingencies (Note 13) |
|
|
|
|
|
|
Stockholders’ equity: |
|
|
|
|
|
|
Common stock, $0.001 par value; 500,000,000 shares authorized as of September 30, 2023 and December 31, 2022; 139,752,858 and 138,201,903 shares issued and outstanding as of September 30, 2023 and December 31, 2022, respectively |
|
|
135 |
|
|
|
135 |
|
Additional paid-in-capital |
|
|
2,083,046 |
|
|
|
2,075,798 |
|
Accumulated deficit |
|
|
(1,824,911 |
) |
|
|
(1,600,692 |
) |
Total stockholders’ equity |
|
|
258,270 |
|
|
|
475,241 |
|
Total liabilities and stockholders’ equity |
|
$ |
1,646,711 |
|
|
$ |
1,619,027 |
|
9
VROOM, INC.
CONDENSED CONSOLIDATED STATEMENTS OF OPERATIONS
(in thousands, except share and per share amounts)
(unaudited)
|
|
|
|
|
|
|
|
|
|
|
|
|
|
|
|
|
|
|
Three Months Ended
September 30, |
|
|
Nine Months Ended
September 30, |
|
|
|
2023 |
|
|
2022 |
|
|
2023 |
|
|
2022 |
|
Revenue: |
|
|
|
|
|
|
|
|
|
|
|
|
Retail vehicle, net |
|
$ |
147,710 |
|
|
$ |
234,353 |
|
|
$ |
419,548 |
|
|
$ |
1,283,263 |
|
Wholesale vehicle |
|
|
30,898 |
|
|
|
47,604 |
|
|
|
75,593 |
|
|
|
270,489 |
|
Product, net |
|
|
13,075 |
|
|
|
13,181 |
|
|
|
36,499 |
|
|
|
51,954 |
|
Finance |
|
|
40,823 |
|
|
|
40,654 |
|
|
|
114,939 |
|
|
|
120,005 |
|
Other |
|
|
3,128 |
|
|
|
5,005 |
|
|
|
10,700 |
|
|
|
13,841 |
|
Total revenue |
|
|
235,634 |
|
|
|
340,797 |
|
|
|
657,279 |
|
|
|
1,739,552 |
|
Cost of sales: |
|
|
|
|
|
|
|
|
|
|
|
|
Retail vehicle |
|
|
144,654 |
|
|
|
218,726 |
|
|
|
414,917 |
|
|
|
1,234,138 |
|
Wholesale vehicle |
|
|
32,393 |
|
|
|
49,178 |
|
|
|
81,019 |
|
|
|
276,749 |
|
Product |
|
|
917 |
|
|
|
— |
|
|
|
2,518 |
|
|
|
— |
|
Finance |
|
|
8,481 |
|
|
|
4,699 |
|
|
|
22,755 |
|
|
|
10,368 |
|
Other |
|
|
1,095 |
|
|
|
863 |
|
|
|
3,170 |
|
|
|
2,969 |
|
Total cost of sales |
|
|
187,540 |
|
|
|
273,466 |
|
|
|
524,379 |
|
|
|
1,524,224 |
|
Total gross profit |
|
|
48,094 |
|
|
|
67,331 |
|
|
|
132,900 |
|
|
|
215,328 |
|
Selling, general and administrative expenses |
|
|
79,586 |
|
|
|
134,643 |
|
|
|
263,078 |
|
|
|
475,627 |
|
Depreciation and amortization |
|
|
11,010 |
|
|
|
9,833 |
|
|
|
31,845 |
|
|
|
27,728 |
|
Impairment charges |
|
|
— |
|
|
|
1,017 |
|
|
|
1,353 |
|
|
|
206,127 |
|
Loss from operations |
|
|
(42,502 |
) |
|
|
(78,162 |
) |
|
|
(163,376 |
) |
|
|
(494,154 |
) |
Gain on debt extinguishment |
|
|
— |
|
|
|
(37,917 |
) |
|
|
(19,640 |
) |
|
|
(37,917 |
) |
Interest expense |
|
|
12,058 |
|
|
|
9,704 |
|
|
|
30,915 |
|
|
|
28,617 |
|
Interest income |
|
|
(5,506 |
) |
|
|
(5,104 |
) |
|
|
(16,369 |
) |
|
|
(12,991 |
) |
Other loss, net |
|
|
33,543 |
|
|
|
5,383 |
|
|
|
65,019 |
|
|
|
26,897 |
|
Income (loss) before provision for income taxes |
|
|
(82,597 |
) |
|
|
(50,228 |
) |
|
|
(223,301 |
) |
|
|
(498,760 |
) |
Provision (benefit) for income taxes |
|
|
260 |
|
|
|
899 |
|
|
|
918 |
|
|
|
(22,085 |
) |
Net loss |
|
$ |
(82,857 |
) |
|
$ |
(51,127 |
) |
|
$ |
(224,219 |
) |
|
$ |
(476,675 |
) |
Net loss per share attributable to common stockholders, basic |
|
$ |
(0.59 |
) |
|
$ |
(0.37 |
) |
|
$ |
(1.61 |
) |
|
$ |
(3.46 |
) |
Weighted-average number of shares outstanding used to compute net loss per share attributable to common stockholders, basic |
|
|
139,692,323 |
|
|
|
138,118,679 |
|
|
|
139,123,352 |
|
|
|
137,817,839 |
|
10
VROOM, INC.
CONDENSED CONSOLIDATED STATEMENTS OF CASH FLOWS
(in thousands)
(unaudited)
|
|
|
|
|
|
|
|
|
|
|
Nine Months Ended
September 30, |
|
|
|
2023 |
|
|
2022 |
|
Operating activities |
|
|
|
|
|
|
Net loss |
|
$ |
(224,219 |
) |
|
$ |
(476,675 |
) |
Adjustments to reconcile net loss to net cash used in operating activities: |
|
|
|
|
|
|
Impairment charges |
|
|
1,353 |
|
|
|
206,127 |
|
Gain on debt extinguishment |
|
|
(19,640 |
) |
|
|
(37,917 |
) |
Depreciation and amortization |
|
|
32,421 |
|
|
|
28,005 |
|
Amortization of debt issuance costs |
|
|
3,418 |
|
|
|
3,777 |
|
Realized gains on securitization transactions |
|
|
— |
|
|
|
(45,589 |
) |
Deferred taxes |
|
|
— |
|
|
|
(23,855 |
) |
Losses on finance receivables and securitization debt, net |
|
|
80,246 |
|
|
|
39,464 |
|
Stock-based compensation expense |
|
|
7,248 |
|
|
|
6,613 |
|
Provision to record inventory at lower of cost or net realizable value |
|
|
(15,867 |
) |
|
|
(5,033 |
) |
Provision for bad debt |
|
|
995 |
|
|
|
18,448 |
|
Provision to record finance receivables held for sale at lower of cost or fair value |
|
|
4,375 |
|
|
|
3,831 |
|
Amortization of unearned discounts on finance receivables at fair value |
|
|
(20,273 |
) |
|
|
(12,121 |
) |
Other, net |
|
|
(11,792 |
) |
|
|
(5,441 |
) |
Changes in operating assets and liabilities: |
|
|
|
|
|
|
Finance receivables, held for sale |
|
|
|
|
|
|
Originations of finance receivables held for sale |
|
|
(420,793 |
) |
|
|
(483,167 |
) |
Principal payments received on finance receivables held for sale |
|
|
71,906 |
|
|
|
38,297 |
|
Proceeds from sale of finance receivables held for sale, net |
|
|
— |
|
|
|
509,612 |
|
Other |
|
|
(868 |
) |
|
|
(5,924 |
) |
Accounts receivable |
|
|
3,950 |
|
|
|
63,252 |
|
Inventory |
|
|
95,839 |
|
|
|
293,589 |
|
Prepaid expenses and other current assets |
|
|
17,316 |
|
|
|
12,420 |
|
Other assets |
|
|
2,097 |
|
|
|
(2,678 |
) |
Accounts payable |
|
|
(7,422 |
) |
|
|
(22,183 |
) |
Accrued expenses |
|
|
(19,914 |
) |
|
|
(27,020 |
) |
Deferred revenue |
|
|
1,832 |
|
|
|
(59,490 |
) |
Other liabilities |
|
|
(7,839 |
) |
|
|
(39,444 |
) |
Net cash used in operating activities |
|
|
(425,631 |
) |
|
|
(23,102 |
) |
Investing activities |
|
|
|
|
|
|
Finance receivables at fair value |
|
|
|
|
|
|
Purchases of finance receivables at fair value |
|
|
(3,392 |
) |
|
|
(49,475 |
) |
Principal payments received on finance receivables at fair value |
|
|
136,644 |
|
|
|
106,829 |
|
Proceeds from sale of finance receivables at fair value, net |
|
|
— |
|
|
|
43,262 |
|
Consolidation of VIEs |
|
|
11,409 |
|
|
|
— |
|
Principal payments received on beneficial interests |
|
|
4,334 |
|
|
|
5,571 |
|
Purchase of property and equipment |
|
|
(11,553 |
) |
|
|
(19,968 |
) |
Acquisition of business, net of cash acquired of $47.9 million |
|
|
— |
|
|
|
(267,488 |
) |
Net cash provided by (used in) investing activities |
|
|
137,442 |
|
|
|
(181,269 |
) |
Financing activities |
|
|
|
|
|
|
Proceeds from borrowings under secured financing agreements |
|
|
261,991 |
|
|
|
— |
|
Principal repayment under secured financing agreements |
|
|
(159,384 |
) |
|
|
(176,909 |
) |
Proceeds from financing of beneficial interests in securitizations |
|
|
24,506 |
|
|
|
— |
|
Principal repayments of financing of beneficial interests in securitizations |
|
|
(5,699 |
) |
|
|
— |
|
Proceeds from vehicle floorplan |
|
|
436,586 |
|
|
|
1,286,000 |
|
Repayments of vehicle floorplan |
|
|
(501,088 |
) |
|
|
(1,453,529 |
) |
Proceeds from warehouse credit facilities |
|
|
332,700 |
|
|
|
419,000 |
|
Repayments of warehouse credit facilities |
|
|
(269,698 |
) |
|
|
(460,566 |
) |
Repurchases of convertible senior notes |
|
|
(13,194 |
) |
|
|
(18,458 |
) |
Other financing activities |
|
|
(1,462 |
) |
|
|
(1,977 |
) |
Net cash provided by (used in) financing activities |
|
|
105,258 |
|
|
|
(406,439 |
) |
Net decrease in cash, cash equivalents and restricted cash |
|
|
(182,931 |
) |
|
|
(610,810 |
) |
Cash, cash equivalents and restricted cash at the beginning of period |
|
|
472,010 |
|
|
|
1,214,775 |
|
Cash, cash equivalents and restricted cash at the end of period |
|
$ |
289,079 |
|
|
$ |
603,965 |
|
11
VROOM, INC.
CONDENSED CONSOLIDATED STATEMENTS OF CASH FLOWS (continued)
(in thousands)
(unaudited)
|
|
|
|
|
|
|
|
|
Supplemental disclosure of cash flow information: |
|
|
|
|
|
|
Cash paid for interest |
|
$ |
40,424 |
|
|
$ |
24,619 |
|
Cash paid for income taxes |
|
$ |
5,153 |
|
|
$ |
2,062 |
|
Supplemental disclosure of non-cash investing and financing activities: |
|
|
|
|
|
|
Finance receivables from consolidation of 2022-2 securitization transaction |
|
$ |
180,706 |
|
|
$ |
— |
|
Elimination of beneficial interest from the consolidation of 2022-2 securitization transaction |
|
$ |
9,811 |
|
|
$ |
— |
|
Securitization debt from consolidation of 2022-2 securitization transaction |
|
$ |
186,386 |
|
|
$ |
— |
|
Reclassification of finance receivables held for sale to finance receivables at fair value, net |
|
$ |
248,081 |
|
|
$ |
— |
|
Fair value of beneficial interests received in securitization transactions |
|
$ |
— |
|
|
$ |
30,082 |
|
12
Exhibit 99.2

vroom Third Quarter 2023 Earnings November 7th, 2023
disclaimer Forward Looking Statements This presentation contains forward-looking statements within the meaning of the Private Securities Litigation Reform Act of 1995. All statements contained in this presentation that do not relate to matters of historical fact should be considered forward-looking statements, including without limitation, statements regarding the expected timeline, our execution of and the expected benefits from our long-term road map and cost-saving initiatives, including our ability to improve our transaction processes and customer service experience, increase and optimize our internal sales force, sell through aged vehicles, improve variable cost per unit, such as logistics costs and marketing costs, and reduce fixed costs, our expectations regarding our business strategy and plans, including our ongoing ability to integrate and develop United Auto Credit Corporation into a captive finance operation, and our intention to return to growth, for future results of operations and financial position, including our ability to improve our unit economics and our outlook for the full year 2023, including with respect to adjusted EBITDA and our liquidity. These statements are based on management's current assumptions and are neither promises nor guarantees, but involve known and unknown risks, uncertainties and other important factors that may cause our actual results, performance or achievements to be materially different from any future results, performance or achievements expressed or implied by the forward-looking statements. For factors that could cause actual results to differ materially from the forward- looking statements in this presentation, please see the risks and uncertainties identified under the heading "Risk Factors" in our Annual Report on Form 10-K for the year ended December 31, 2022, as updated by our Quarterly Report on Form 10-Q for the quarter ended September 30, 2023, each of which are available on our Investor Relations website at ir.vroom.com and on the SEC website at www.sec.gov. All forward-looking statements reflect our beliefs and assumptions only as of the date of this presentation. We undertake no obligation to update forward-looking statements to reflect future events or circumstances. Industry and Market Information To the extent this presentation includes information concerning the industry and the markets in which the Company operates, including general observations, expectations, market position, market opportunity and market size, such information is based on management's knowledge and experience in the markets in which we operate, including publicly available information from independent industry analysts and publications, as well as the Company's own estimates. Our estimates are based on third-party sources, as well as internal research, which the Company believes to be reasonable, but which are inherently uncertain and imprecise. Accordingly, you are cautioned not to place undue reliance on such market and industry information. Financial Presentation and Use of Non-GAAP Financial Measures Certain monetary amounts, percentages and other figures included in this presentation have been subject to rounding adjustments. Certain other amounts that appear in this presentation may not sum due to rounding. This presentation contains certain supplemental financial measures that are not calculated pursuant to U.S. generally accepted accounting principles ("GAAP"). These non-GAAP measures are in addition to, and not a substitute or superior to, measures of financial performance prepared in accordance with GAAP. These non-GAAP financial measures have limitations as analytical tools in that they do not reflect all of the amounts associated with our results of operations as determined in accordance with U.S. GAAP. Because of these limitations, these non-GAAP financial measures should be considered along with other operating and financial performance measures presented in accordance with U.S. GAAP. We have reconciled all non-GAAP financial measures with the most directly comparable U.S. GAAP financial measures in the Appendix to this presentation.
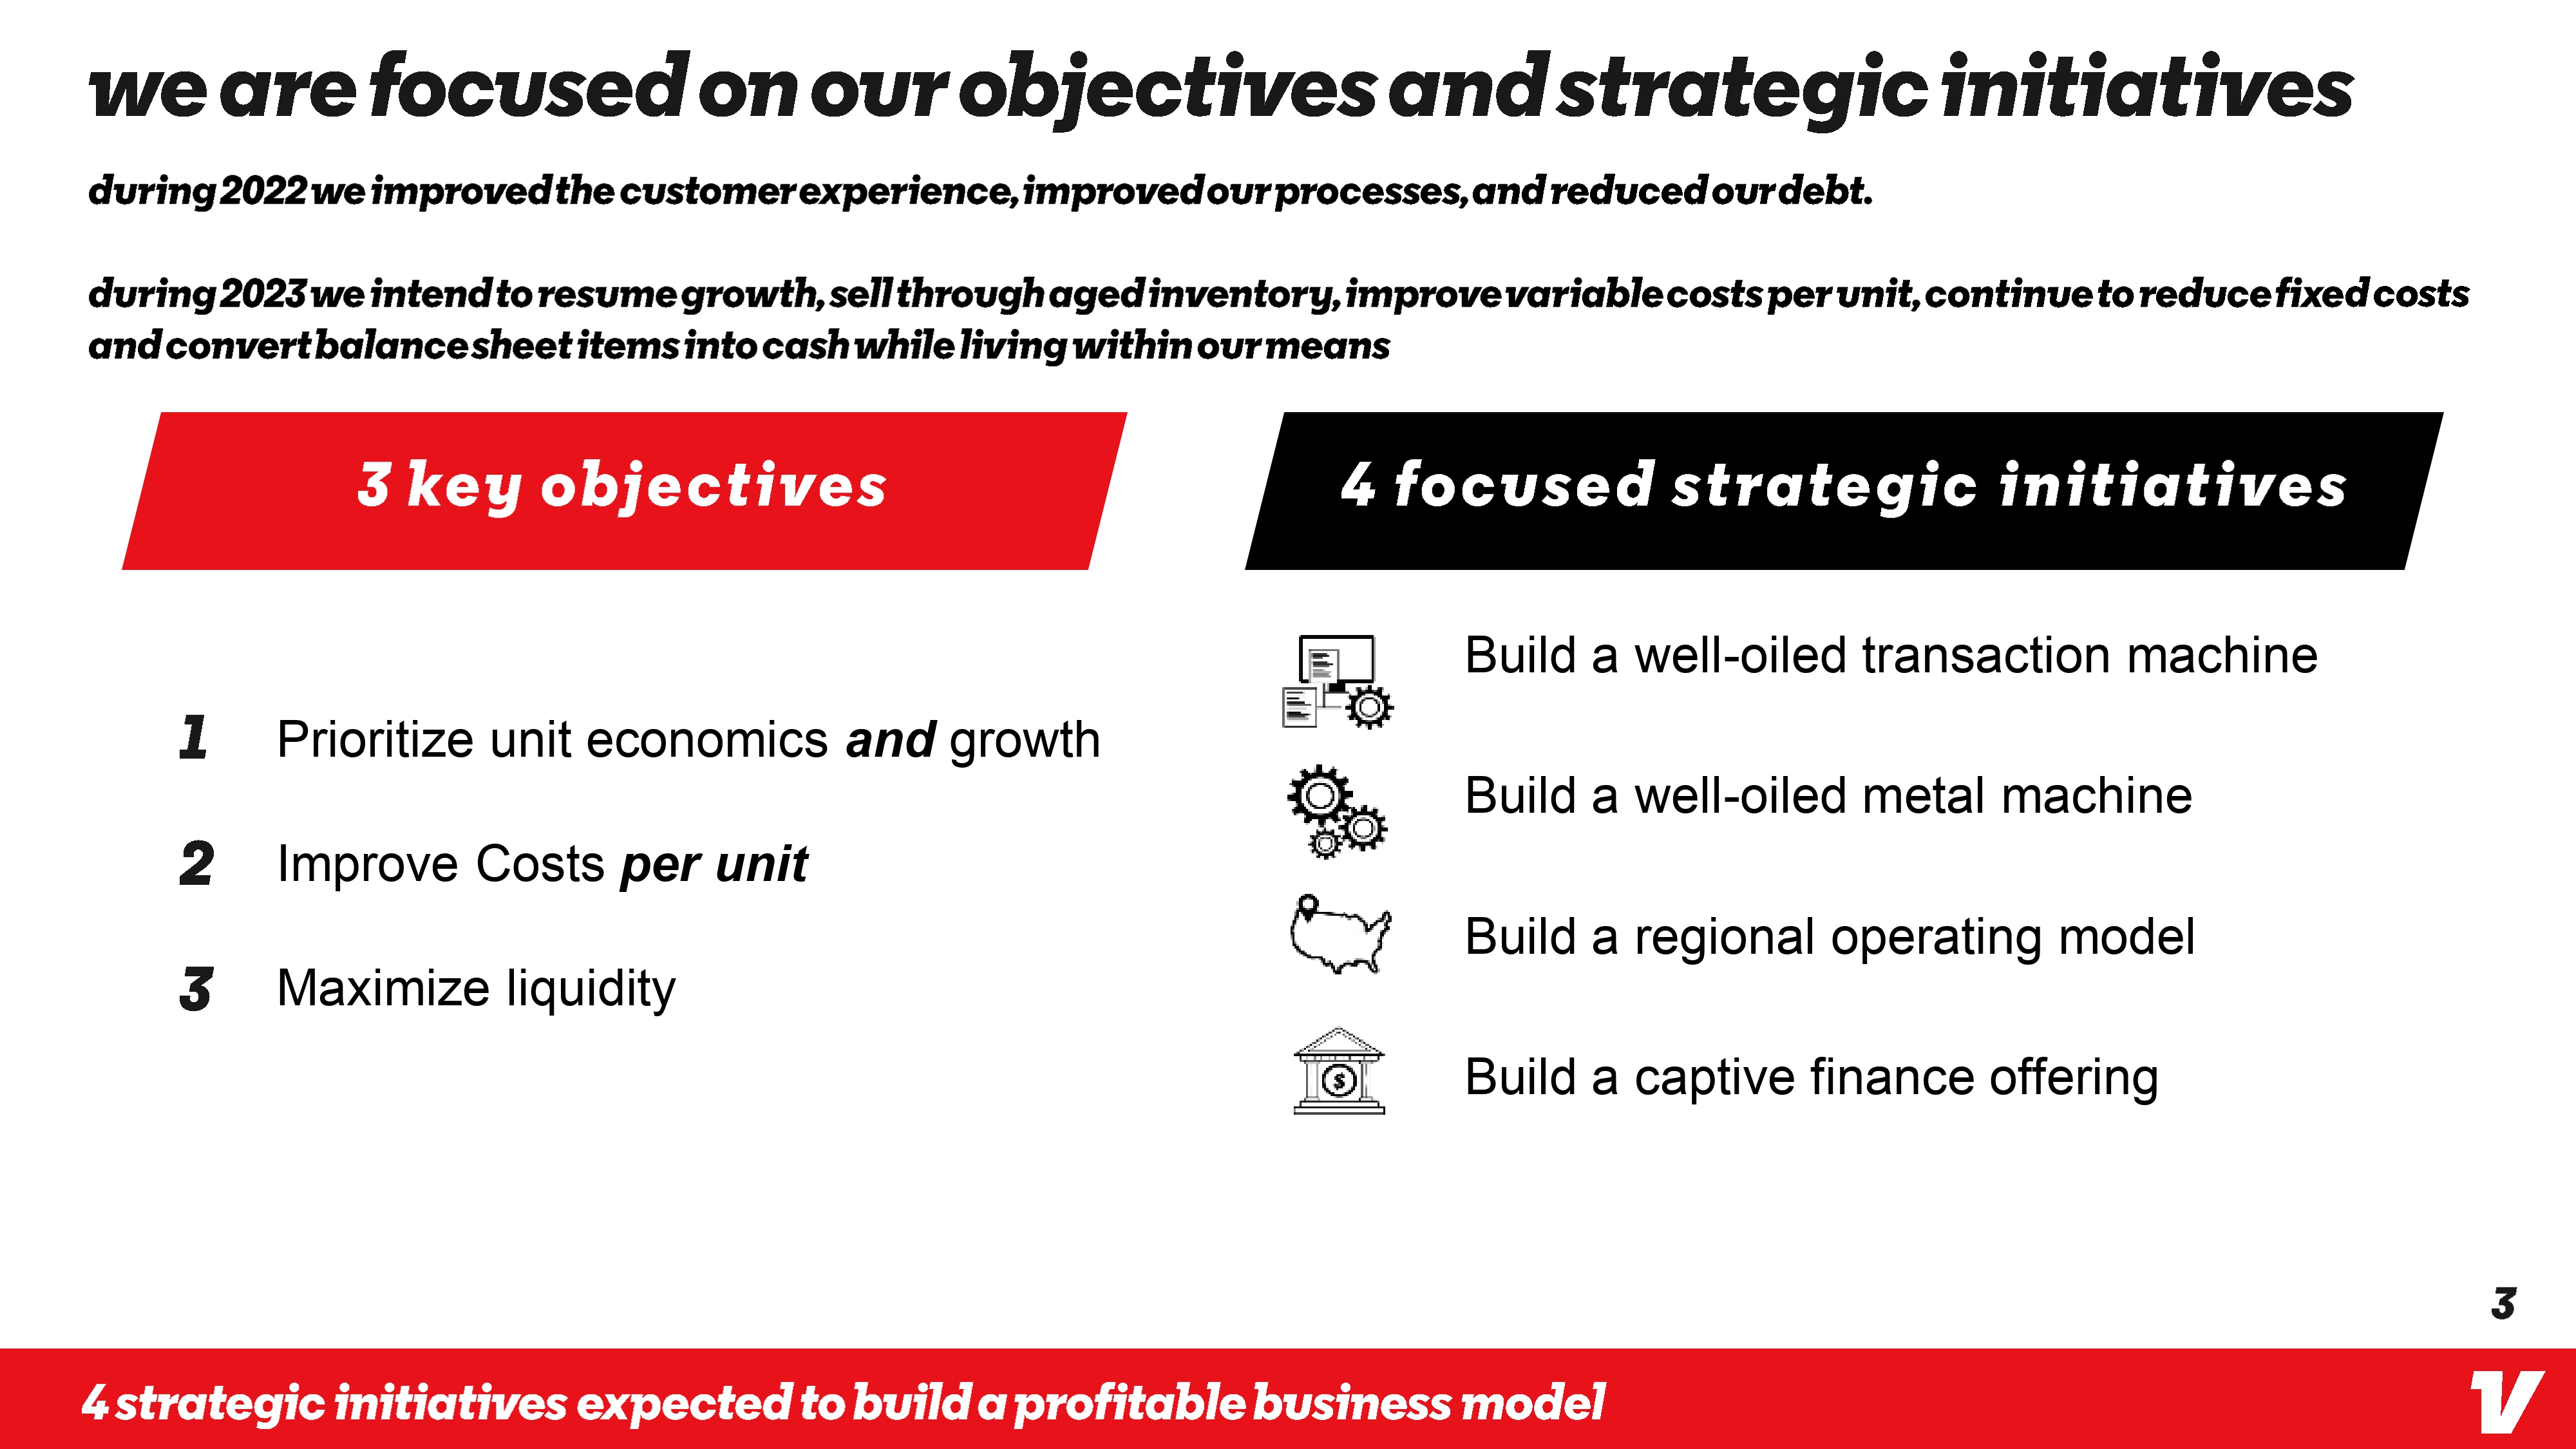
we are focused on our objectives and strategic initiatives during 2022 we improved the customer experience, improved our processes, and reduced our debt. during 2023 we intend to resume growth, sell through aged inventory, improve variable costs per unit, continue to reduce fixed costs and convert balance sheet items into cash while living within our means 3 key objectives 4 focused strategic initiatives Build a well-oiled transaction machine 1 Prioritize unit economics and growth Build a well-oiled metal machine 2 Improve Costs per unit Build a regional operating model 3 Maximize liquidity Build a captive finance offering 4 strategic initiatives expected to build a profitable business model 3 V
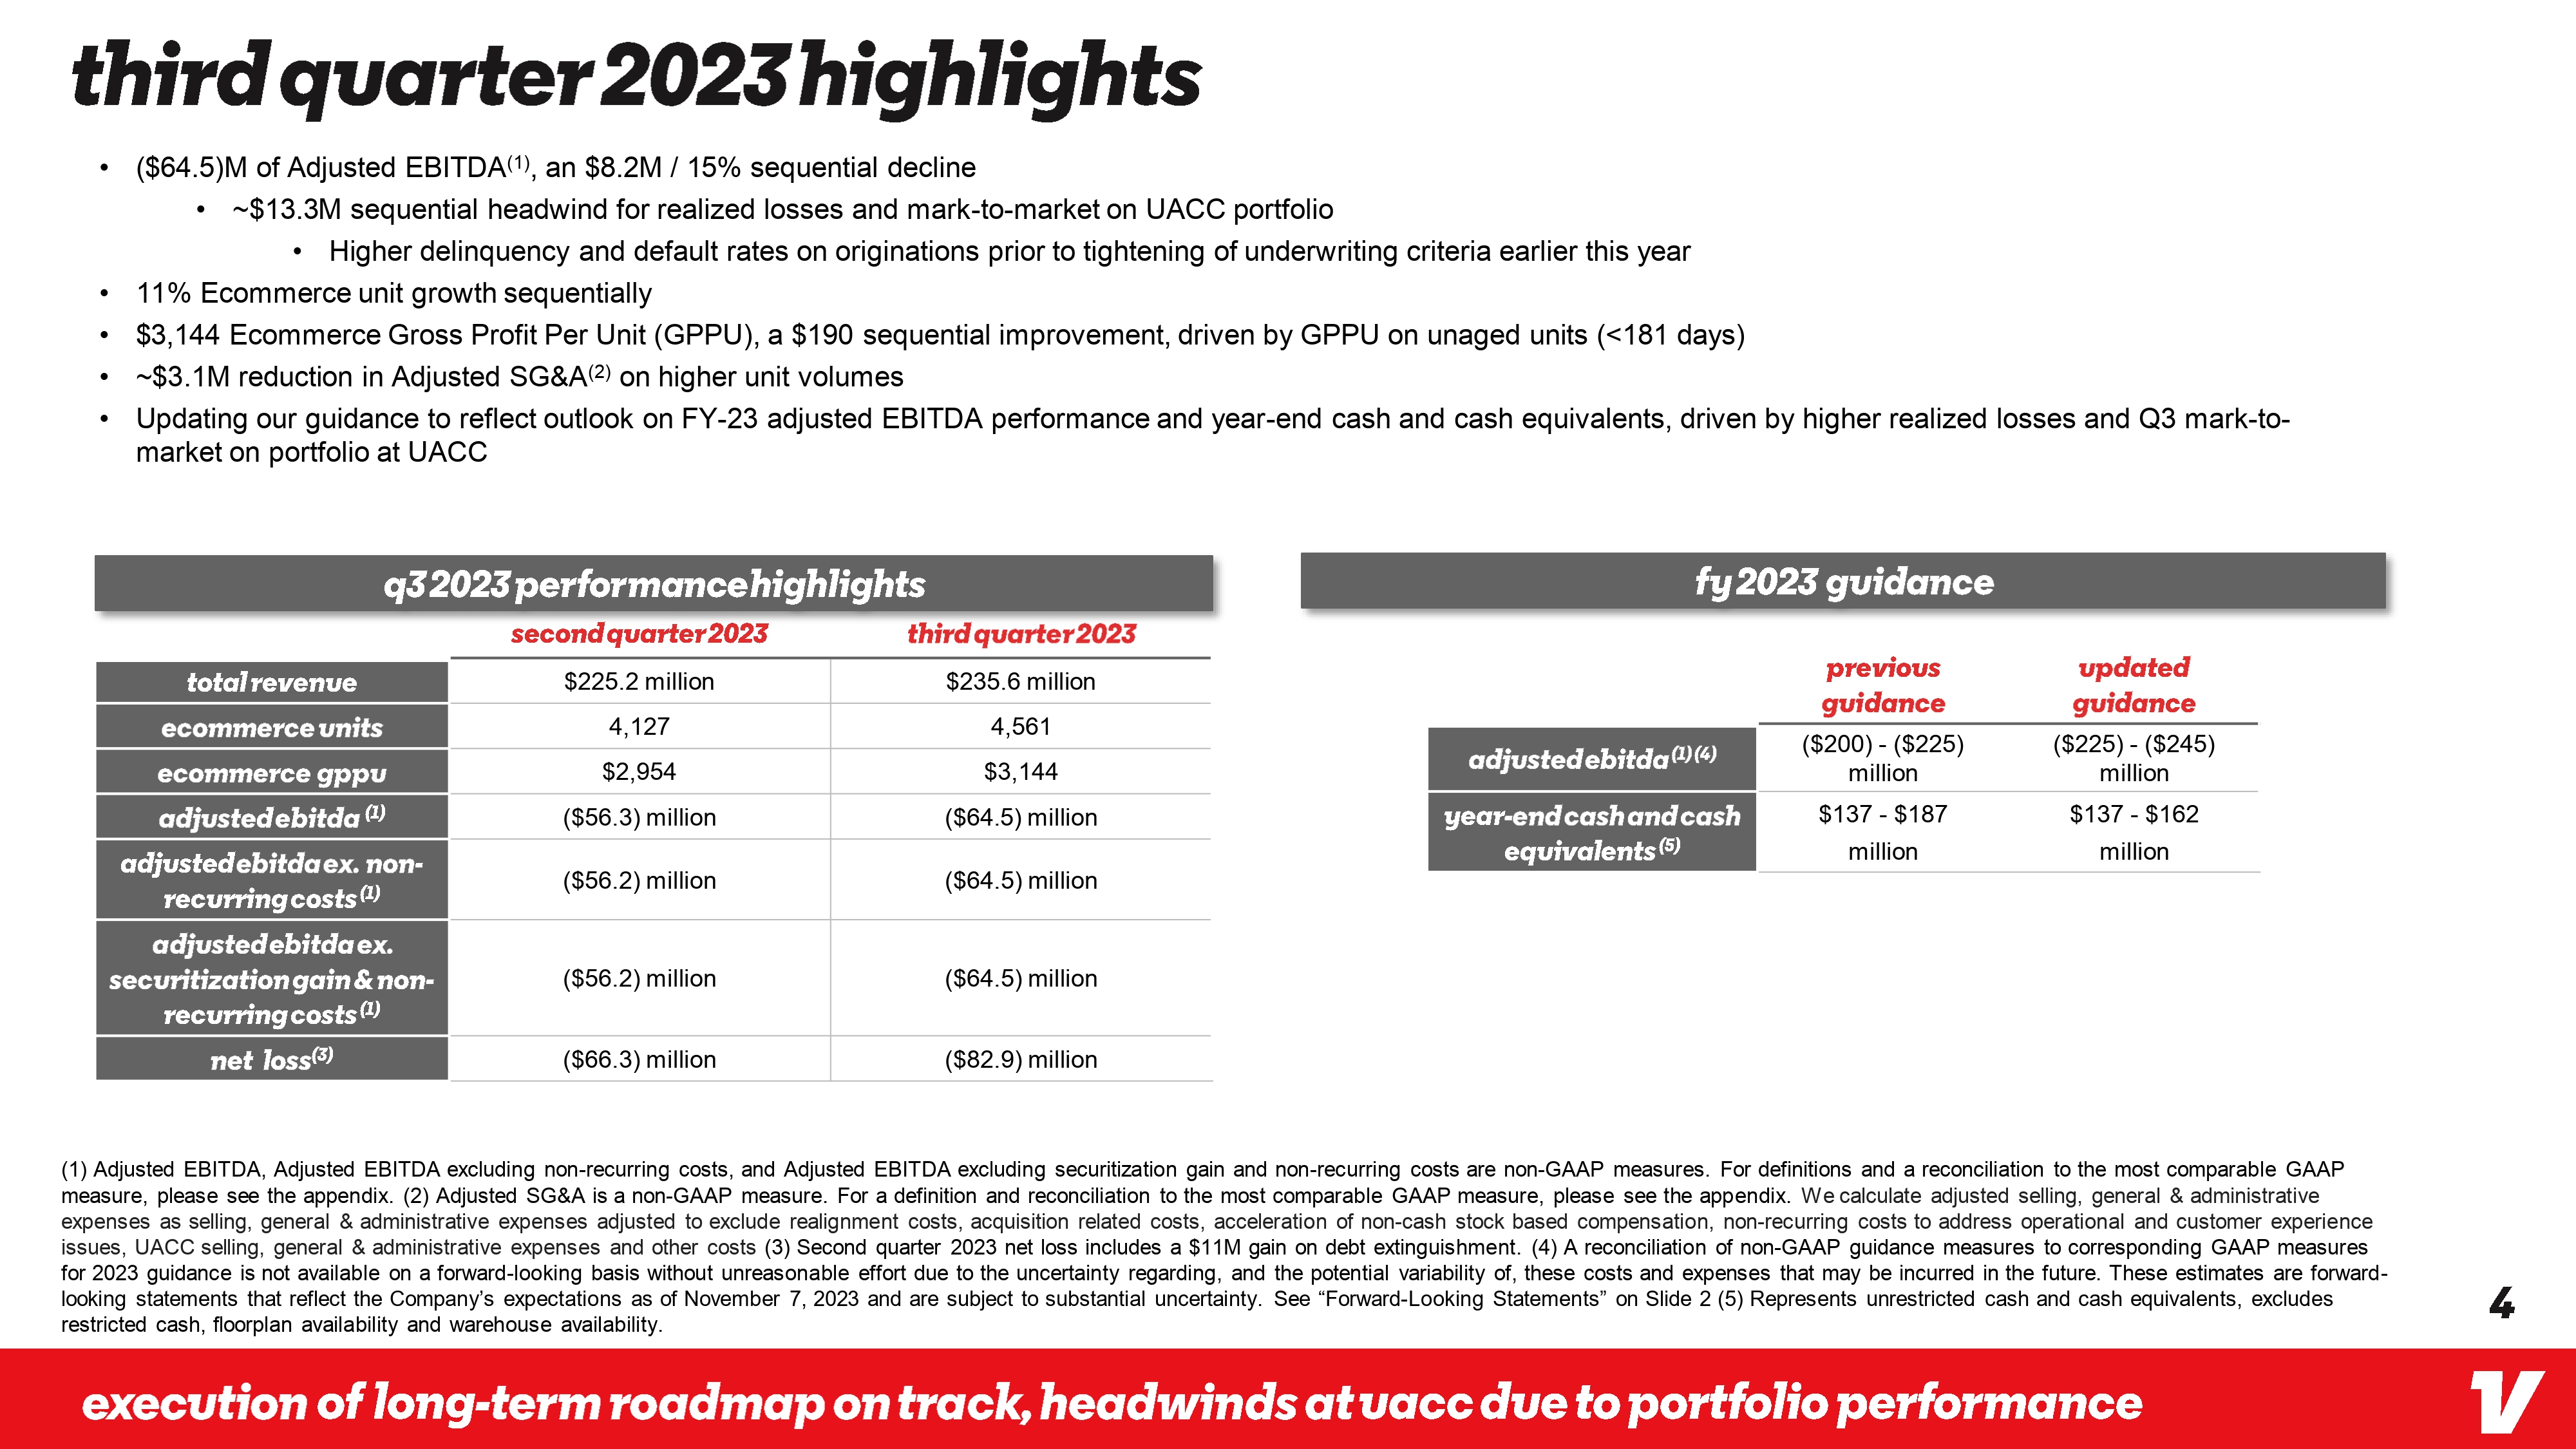
third quarter 2023 highlights ($64.5)M of Adjusted EBITDA(1), an $8.2M / 15% sequential decline ~$13.3M sequential headwind for realized losses and mark-to-market on UACC portfolio · • Higher delinquency and default rates on originations prior to tightening of underwriting criteria earlier this year 11% Ecommerce unit growth sequentially • $3,144 Ecommerce Gross Profit Per Unit (GPPU), a $190 sequential improvement, driven by GPPU on unaged units (<181 days) ~$3.1M reduction in Adjusted SG&A(2) on higher unit volumes Updating our guidance to reflect outlook on FY-23 adjusted EBITDA performance and year-end cash and cash equivalents, driven by higher realized losses and Q3 mark-to- market on portfolio at UACC q3 2023 performance highlights fy 2023 guidance previous guidance ($200) - ($225) million $137 - $187 million updated guidance ($225) - ($245) million $137 - $162 million total revenue ecommerce units ecommerce gppu adjustedebitda (1) second quarter 2023 third quarter 2023 $225.2 million 4,127 $235.6 million 4.561 $2,954 $3,144 adjustedebitda(1)(4) ($56.3) million ($64.5) million adjustedebitda ex. non- recurring costs (1) year-end cash and cash equivalents (5) ($56.2) million ($64.5) million adjustedebitda ex. securitization gain & non- ($56.2) million ($64.5) million recurring costs (1) net loss (3) ($66.3) million ($82.9) million (1) Adjusted EBITDA, Adjusted EBITDA excluding non-recurring costs, and Adjusted EBITDA excluding securitization gain and non-recurring costs are non-GAAP measures. For definitions and a reconciliation to the most comparable GAAP measure, please see the appendix. (2) Adjusted SG&A is a non-GAAP measure. For a definition and reconciliation to the most comparable GAAP measure, please see the appendix. We calculate adjusted selling, general & administrative expenses as selling, general & administrative expenses adjusted to exclude realignment costs, acquisition related costs, acceleration of non-cash stock based compensation, non-recurring costs to address operational and customer experience issues, UACC selling, general & administrative expenses and other costs (3) Second quarter 2023 net loss includes a $11M gain on debt extinguishment. (4) A reconciliation of non-GAAP guidance measures to corresponding GAAP measures for 2023 guidance is not available on a forward-looking basis without unreasonable effort due to the uncertainty regarding, and the potential variability of, these costs and expenses that may be incurred in the future. These estimates are forward- looking statements that reflect the Company's expectations as of November 7, 2023 and are subject to substantial uncertainty. See "Forward-Looking Statements" on Slide 2 (5) Represents unrestricted cash and cash equivalents, excludes restricted cash, floorplan availability and warehouse availability. execution of long-term roadmap on track, headwinds atuacc due to portfolio performance 4 V
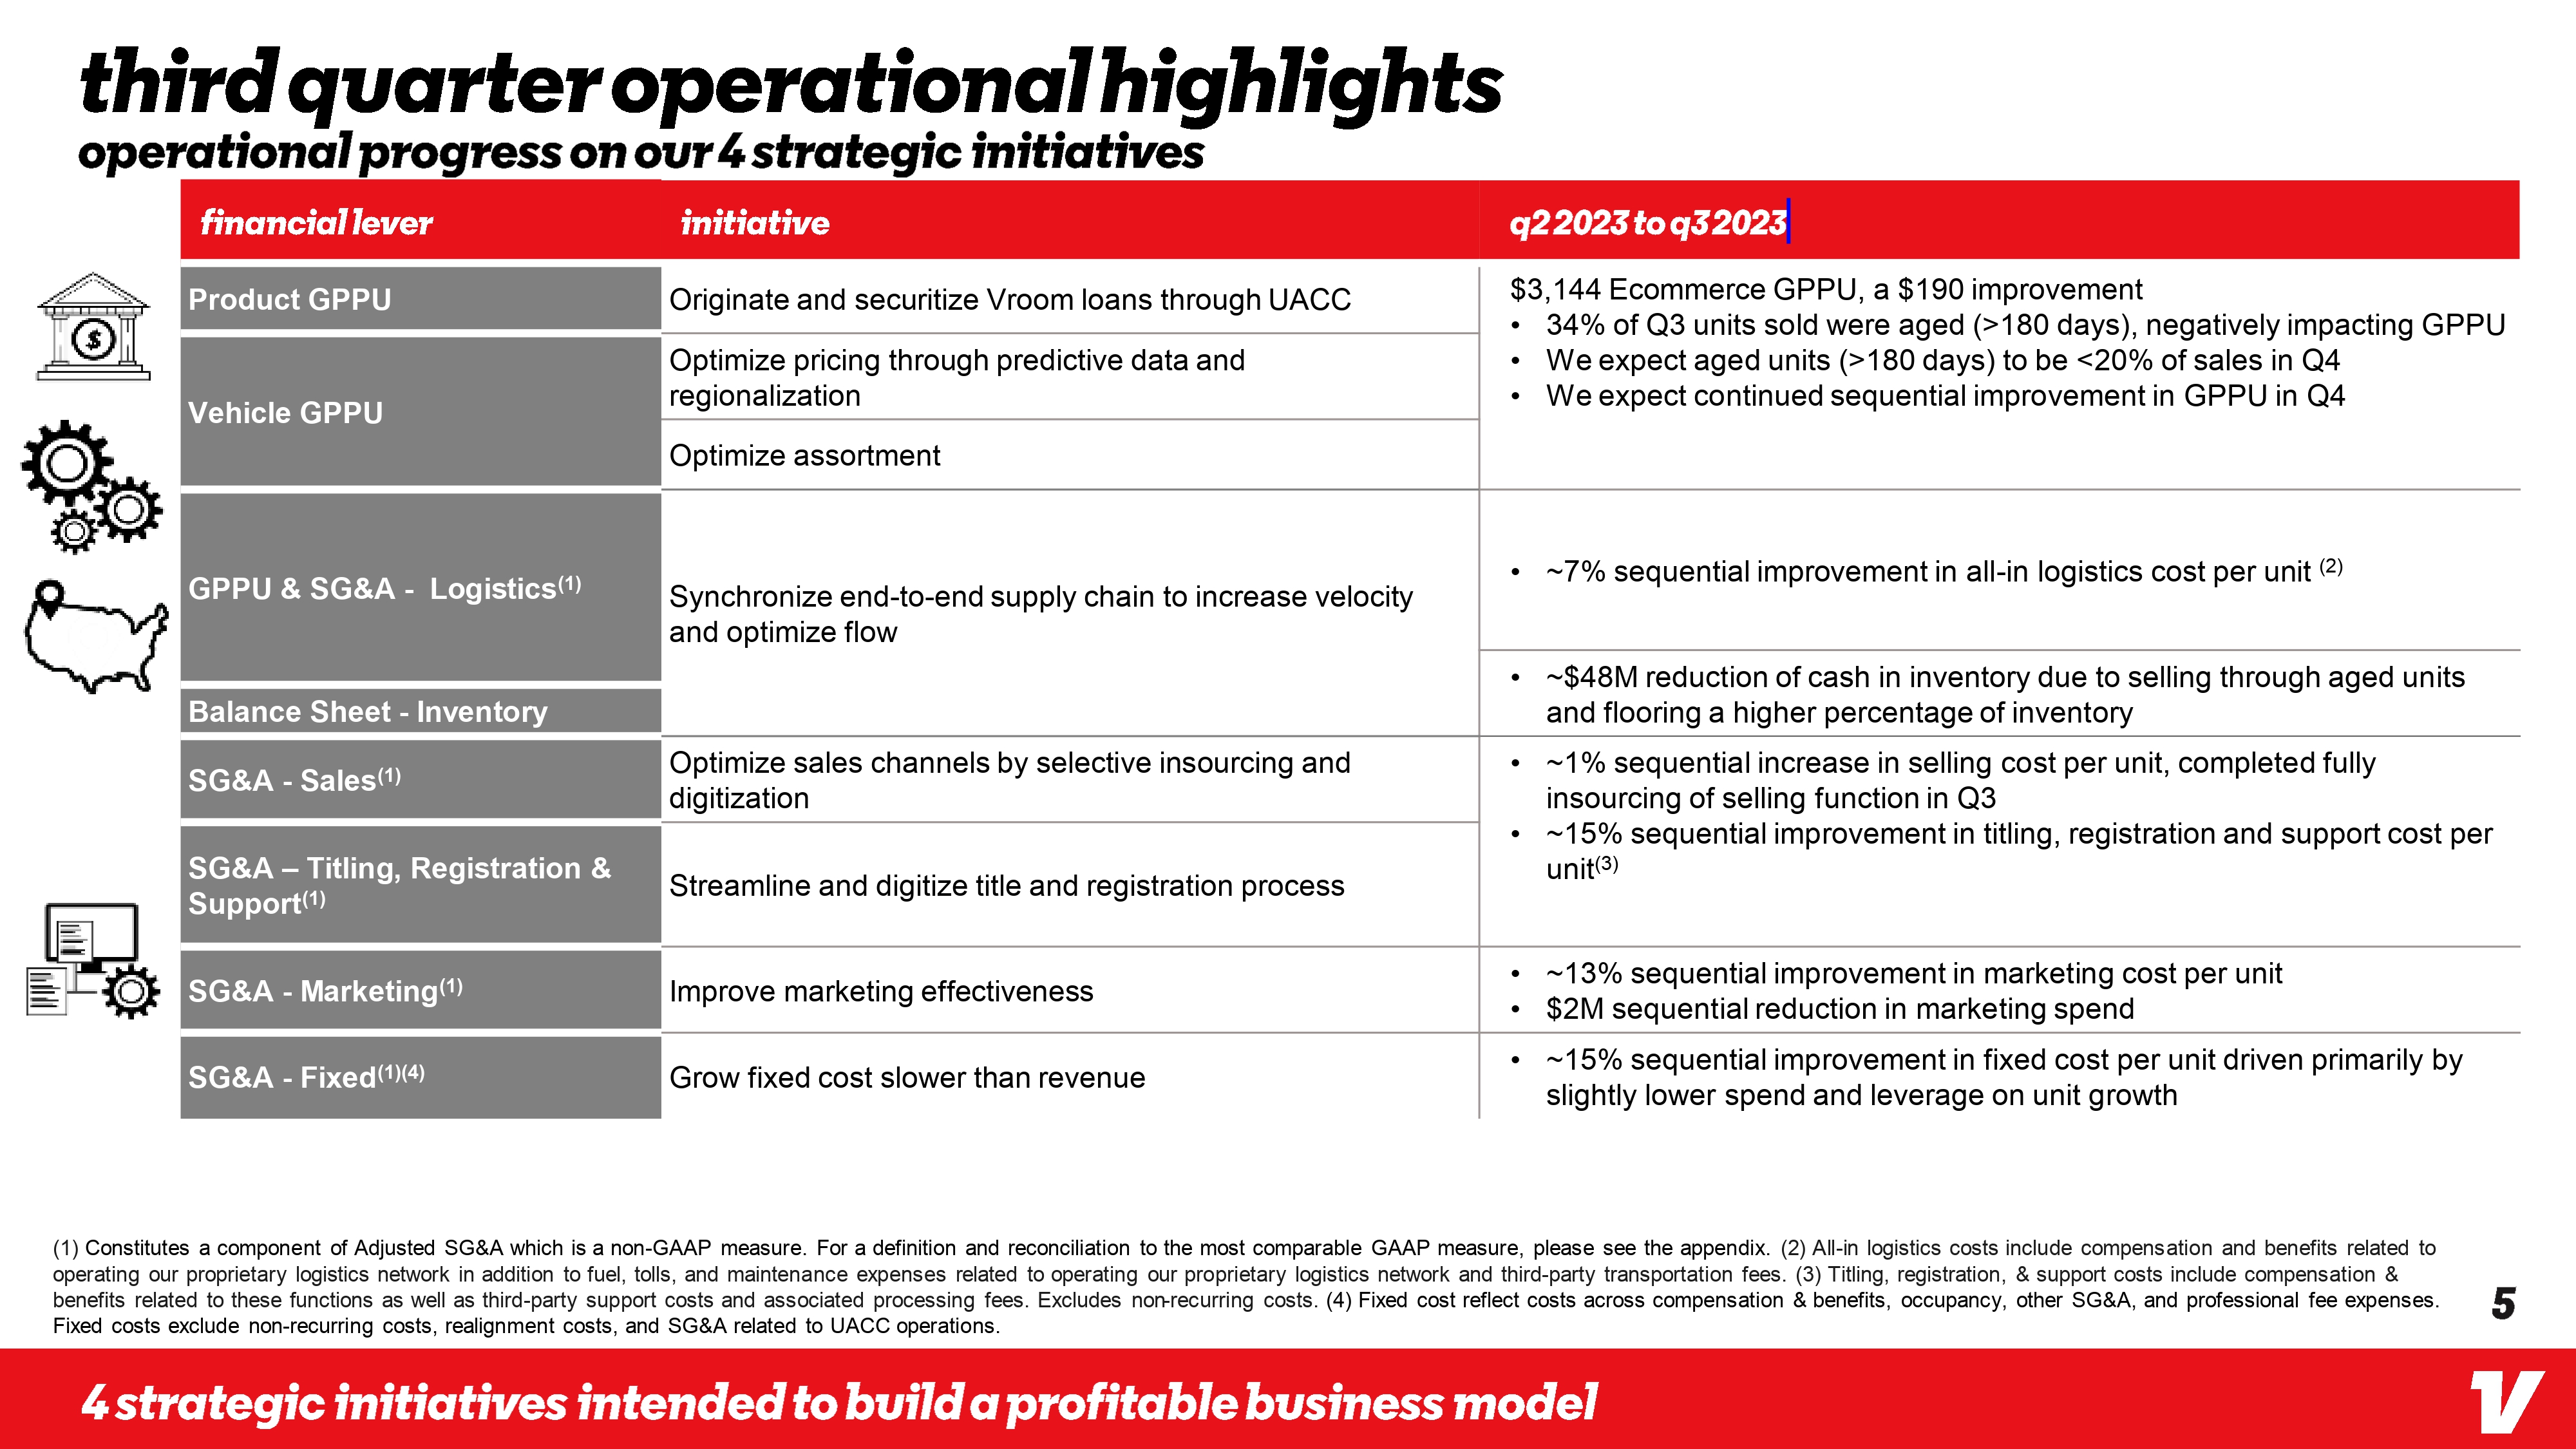
third quarter operational highlights operational progress on our 4 strategic initiatives financial lever Product GPPU initiative q22023 to q32023 $3,144 Ecommerce GPPU, a $190 improvement $ Vehicle GPPU Originate and securitize Vroom loans through UACC • 34% of Q3 units sold were aged (>180 days), negatively impacting GPPU Optimize pricing through predictive data and regionalization Optimize assortment • We expect aged units (>180 days) to be <20% of sales in Q4 · We expect continued sequential improvement in GPPU in Q4 GPPU & SG&A - Logistics(1) Balance Sheet - Inventory SG&A - Sales(1) SG&A - Titling, Registration & Support(1) Synchronize end-to-end supply chain to increase velocity and optimize flow Optimize sales channels by selective insourcing and digitization Streamline and digitize title and registration process SG&A - Marketing(1) Improve marketing effectiveness SG&A - Fixed(1)(4) Grow fixed cost slower than revenue · • ~7% sequential improvement in all-in logistics cost per unit (2) ~$48M reduction of cash in inventory due to selling through aged units and flooring a higher percentage of inventory ~1% sequential increase in selling cost per unit, completed fully insourcing of selling function in Q3 ~15% sequential improvement in titling, registration and support cost per unit(3) • ~13% sequential improvement in marketing cost per unit • $2M sequential reduction in marketing spend • ~15% sequential improvement in fixed cost per unit driven primarily by slightly lower spend and leverage on unit growth (1) Constitutes a component of Adjusted SG&A which is a non-GAAP measure. For a definition and reconciliation to the most comparable GAAP measure, please see the appendix. (2) All-in logistics costs include compensation and benefits related to operating our proprietary logistics network in addition to fuel, tolls, and maintenance expenses related to operating our proprietary logistics network and third-party transportation fees. (3) Titling, registration, & support costs include compensation & benefits related to these functions as well as third-party support costs and associated processing fees. Excludes non-recurring costs. (4) Fixed cost reflect costs across compensation & benefits, occupancy, other SG&A, and professional fee expenses. Fixed costs exclude non-recurring costs, realignment costs, and SG&A related to UACC operations. 4 strategic initiatives intended to build a profitable business model 5 V
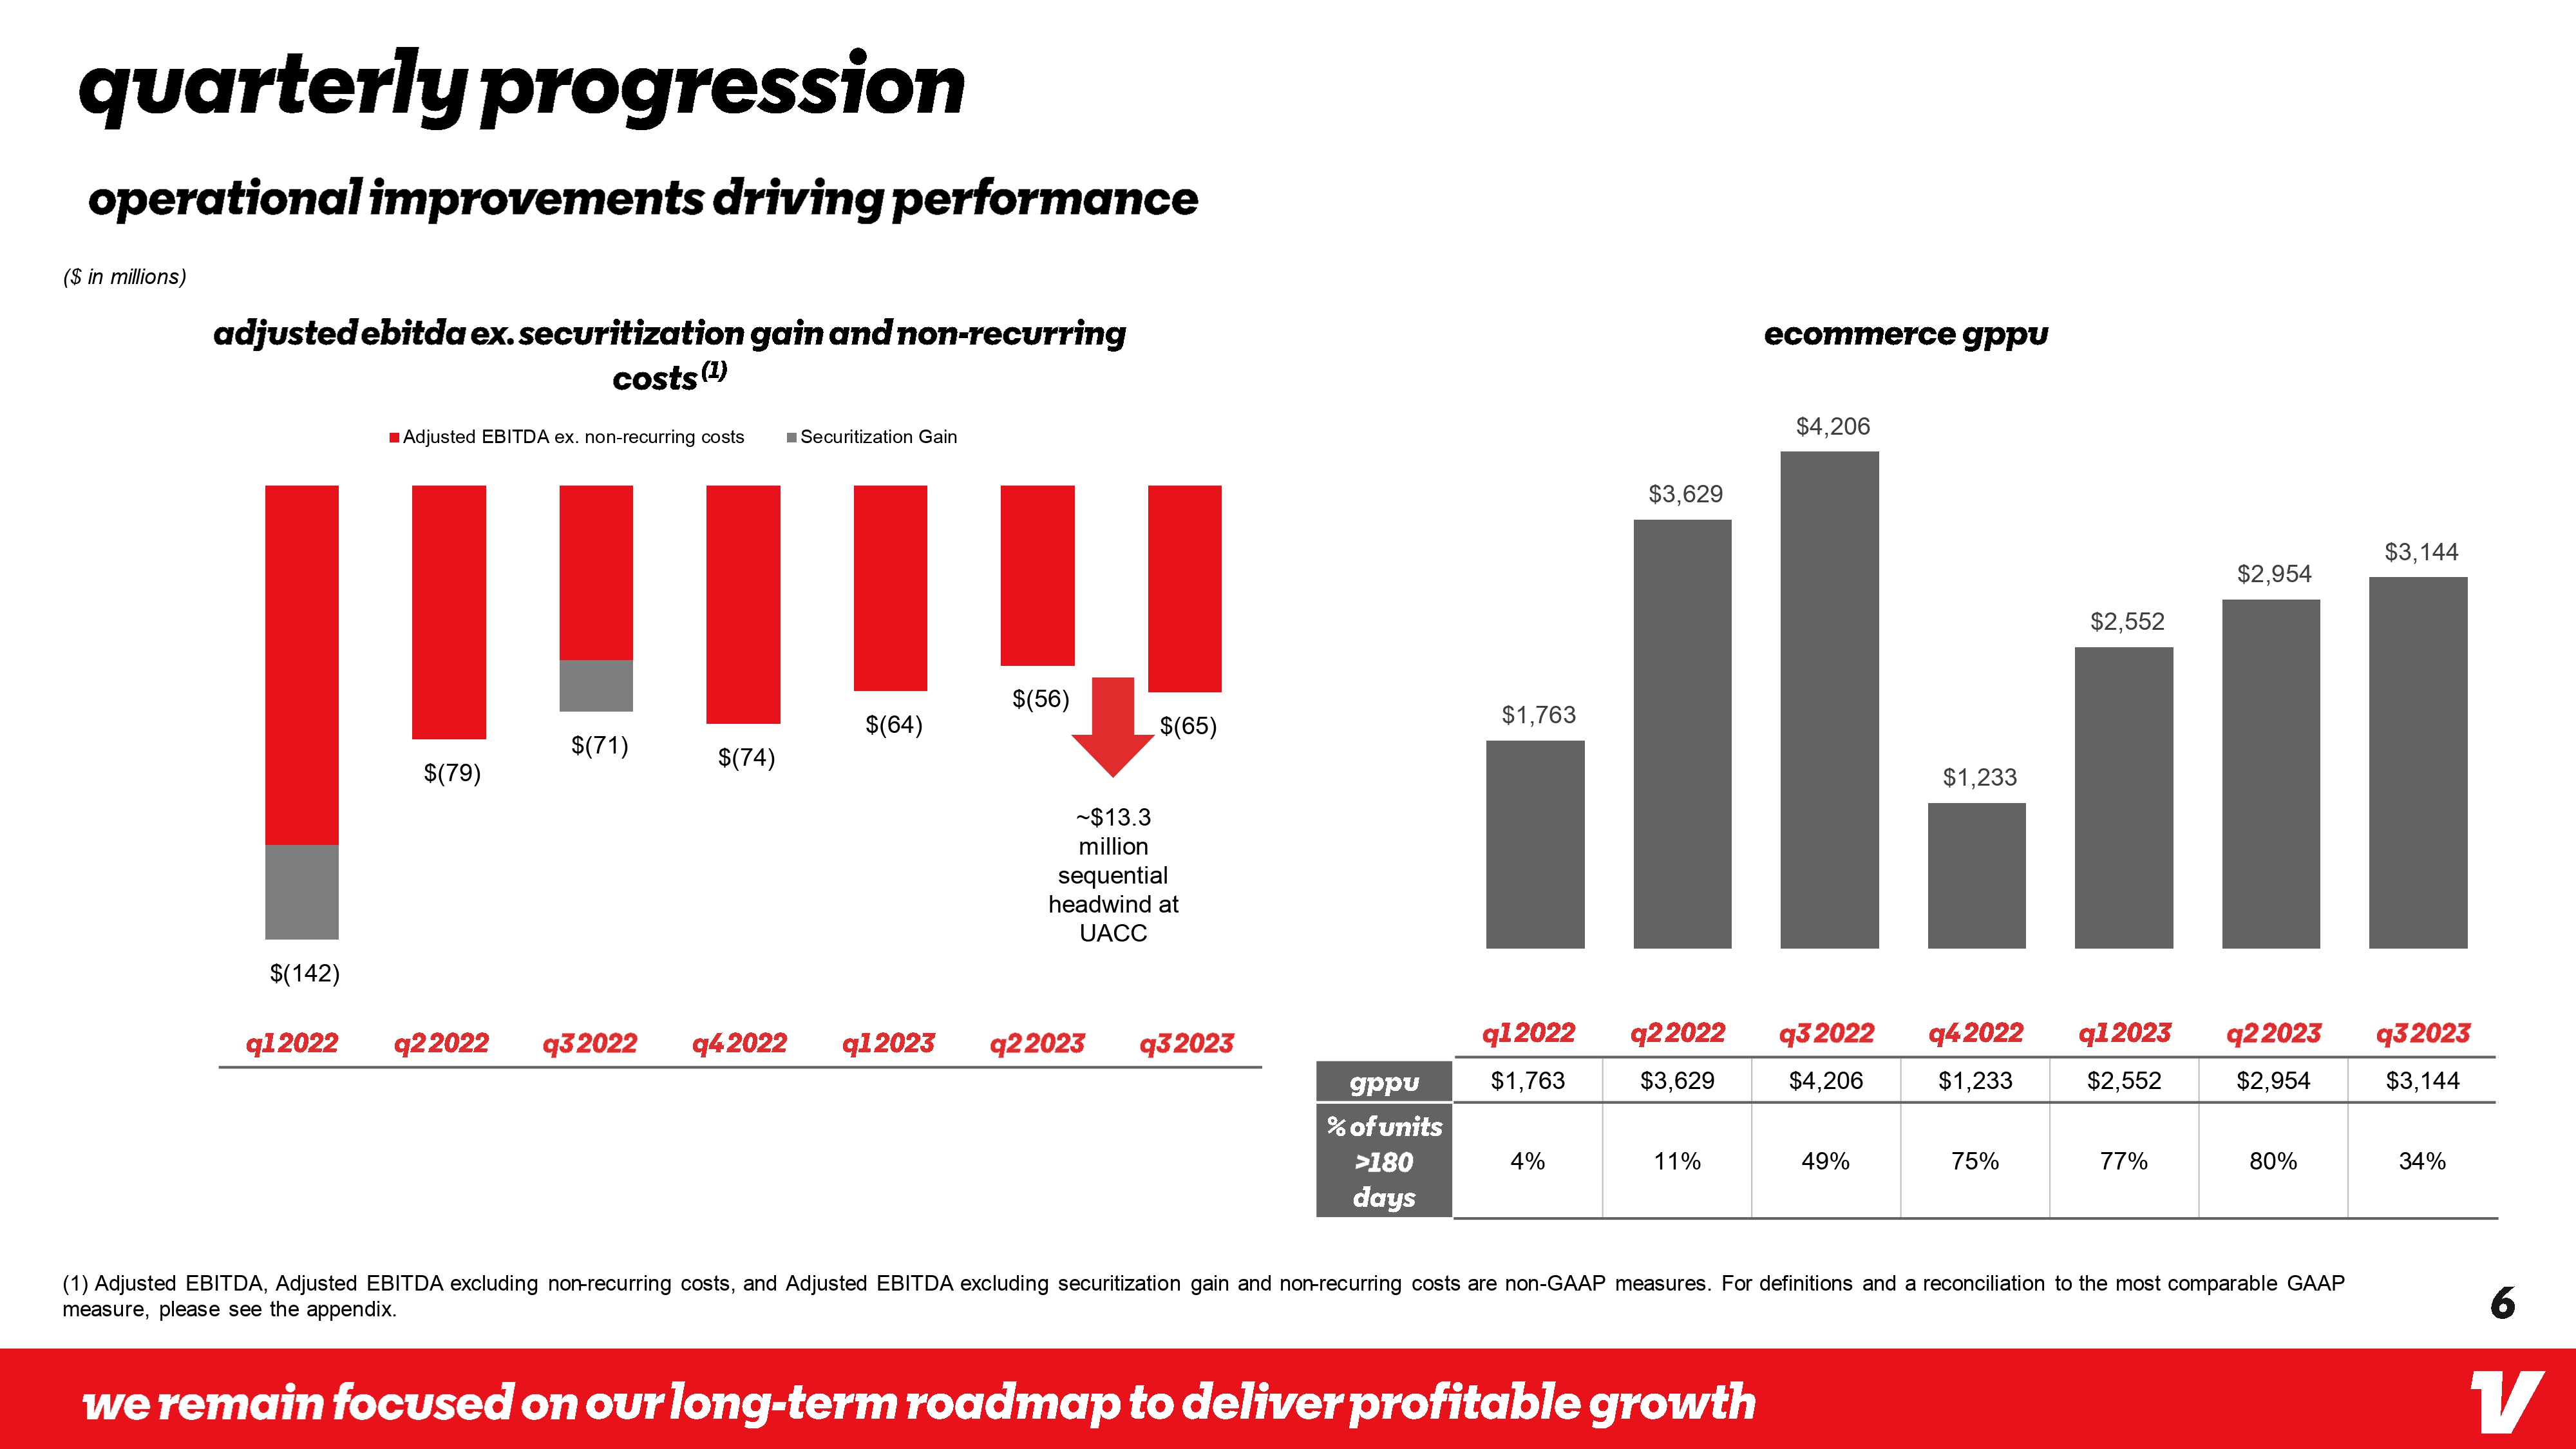
quarterly progression operational improvements driving performance ($ in millions) adjusted ebitda ex. securitization gain and non-recurring costs (1) ■ Adjusted EBITDA ex. non-recurring costs Securitization Gain $3,629 ecommerce gppu $4,206 $(56) $1,763 $(64) $(65) $(71) $(74) $1,233 $(79) ~$13.3 million sequential headwind at UACC $3,144 $2,954 $2,552 $(142) q12022 q22022 q32022 q42022 q12023 q22023 q32023 gppu % of units >180 days q12022 $1,763 q22022 q32022 $3,629 $4,206 q42022 q12023 q22023 $1,233 $2,552 $2,954 q32023 $3,144 4% 11% 49% 75% 77% 80% 34% (1) Adjusted EBITDA, Adjusted EBITDA excluding non-recurring costs, and Adjusted EBITDA excluding securitization gain and non-recurring costs are non-GAAP measures. For definitions and a reconciliation to the most comparable GAAP measure, please see the appendix. we remain focused on our long-term roadmap to deliver profitable growth 6 V

vroom Third Quarter 2023 Financial Update
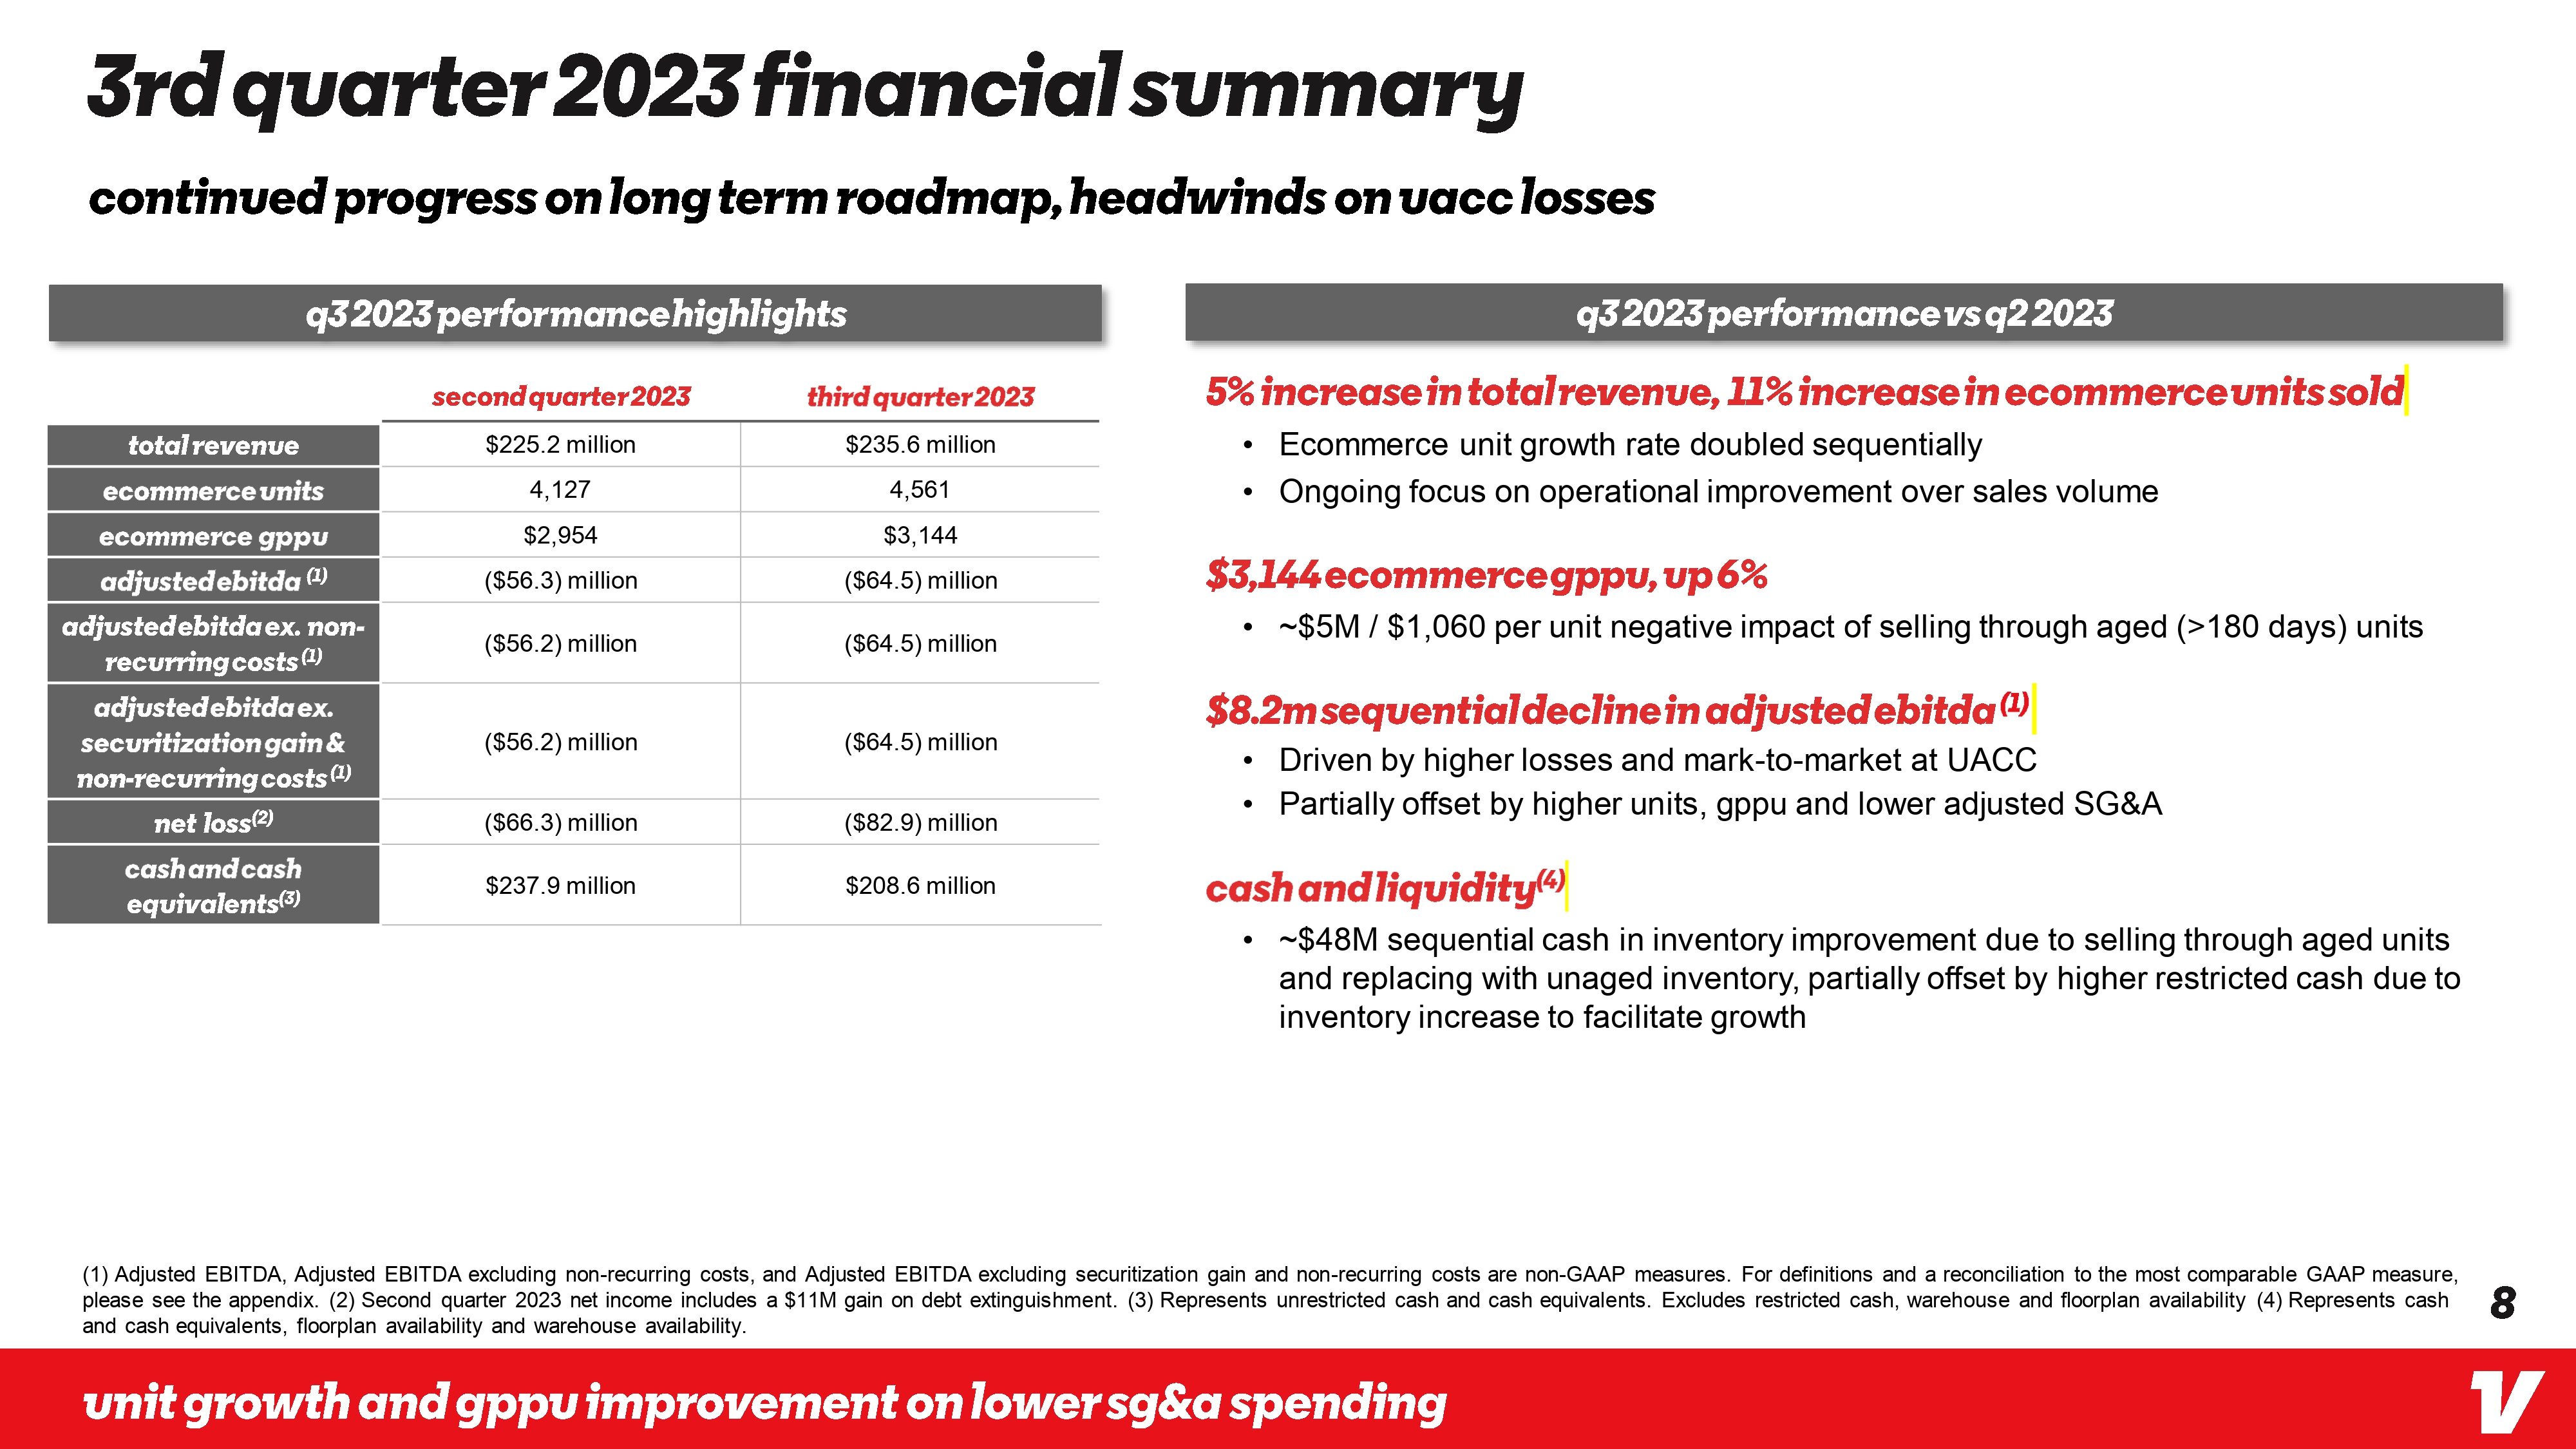
3rd quarter 2023 financial summary continued progress on long term roadmap, headwinds on uacc losses q32023 performancehighlights total revenue ecommerce units ecommerce gppu adjusted ebitda (1) second quarter 2023 third quarter 2023 $235.6 million $225.2 million 4,561 $3,144 ($64.5) million q32023 performance vs q2 2023 5% increase in total revenue, 11% increase in ecommerce units sold • Ecommerce unit growth rate doubled sequentially • Ongoing focus on operational improvement over sales volume $3,144ecommercegppu, up6% ~$5M/$1,060 per unit negative impact of selling through aged (>180 days) units 4,127 $2,954 ($56.3) million adjustedebitda ex. non- recurring costs (1) • ($56.2) million ($64.5) million adjustedebitda ex. securitization gain & ($56.2) million ($64.5) million • non-recurring costs (1) Driven by higher losses and mark-to-market at UACC • net loss (2) ($66.3) million ($82.9) million $237.9 million $208.6 million cash and cash equivalents(3) $8.2m sequentialdecline in adjusted ebitda (1) Partially offset by higher units, gppu and lower adjusted SG&A cash and liquidity(4) • ~$48M sequential cash in inventory improvement due to selling through aged units and replacing with unaged inventory, partially offset by higher restricted cash due to inventory increase to facilitate growth (1) Adjusted EBITDA, Adjusted EBITDA excluding non-recurring costs, and Adjusted EBITDA excluding securitization gain and non-recurring costs are non-GAAP measures. For definitions and a reconciliation to the most comparable GAAP measure, please see the appendix. (2) Second quarter 2023 net income includes a $11M gain on debt extinguishment. (3) Represents unrestricted cash and cash equivalents. Excludes restricted cash, warehouse and floorplan availability (4) Represents cash and cash equivalents, floorplan availability and warehouse availability. unit growth and gppu improvement on lower sg&a spending 8 V
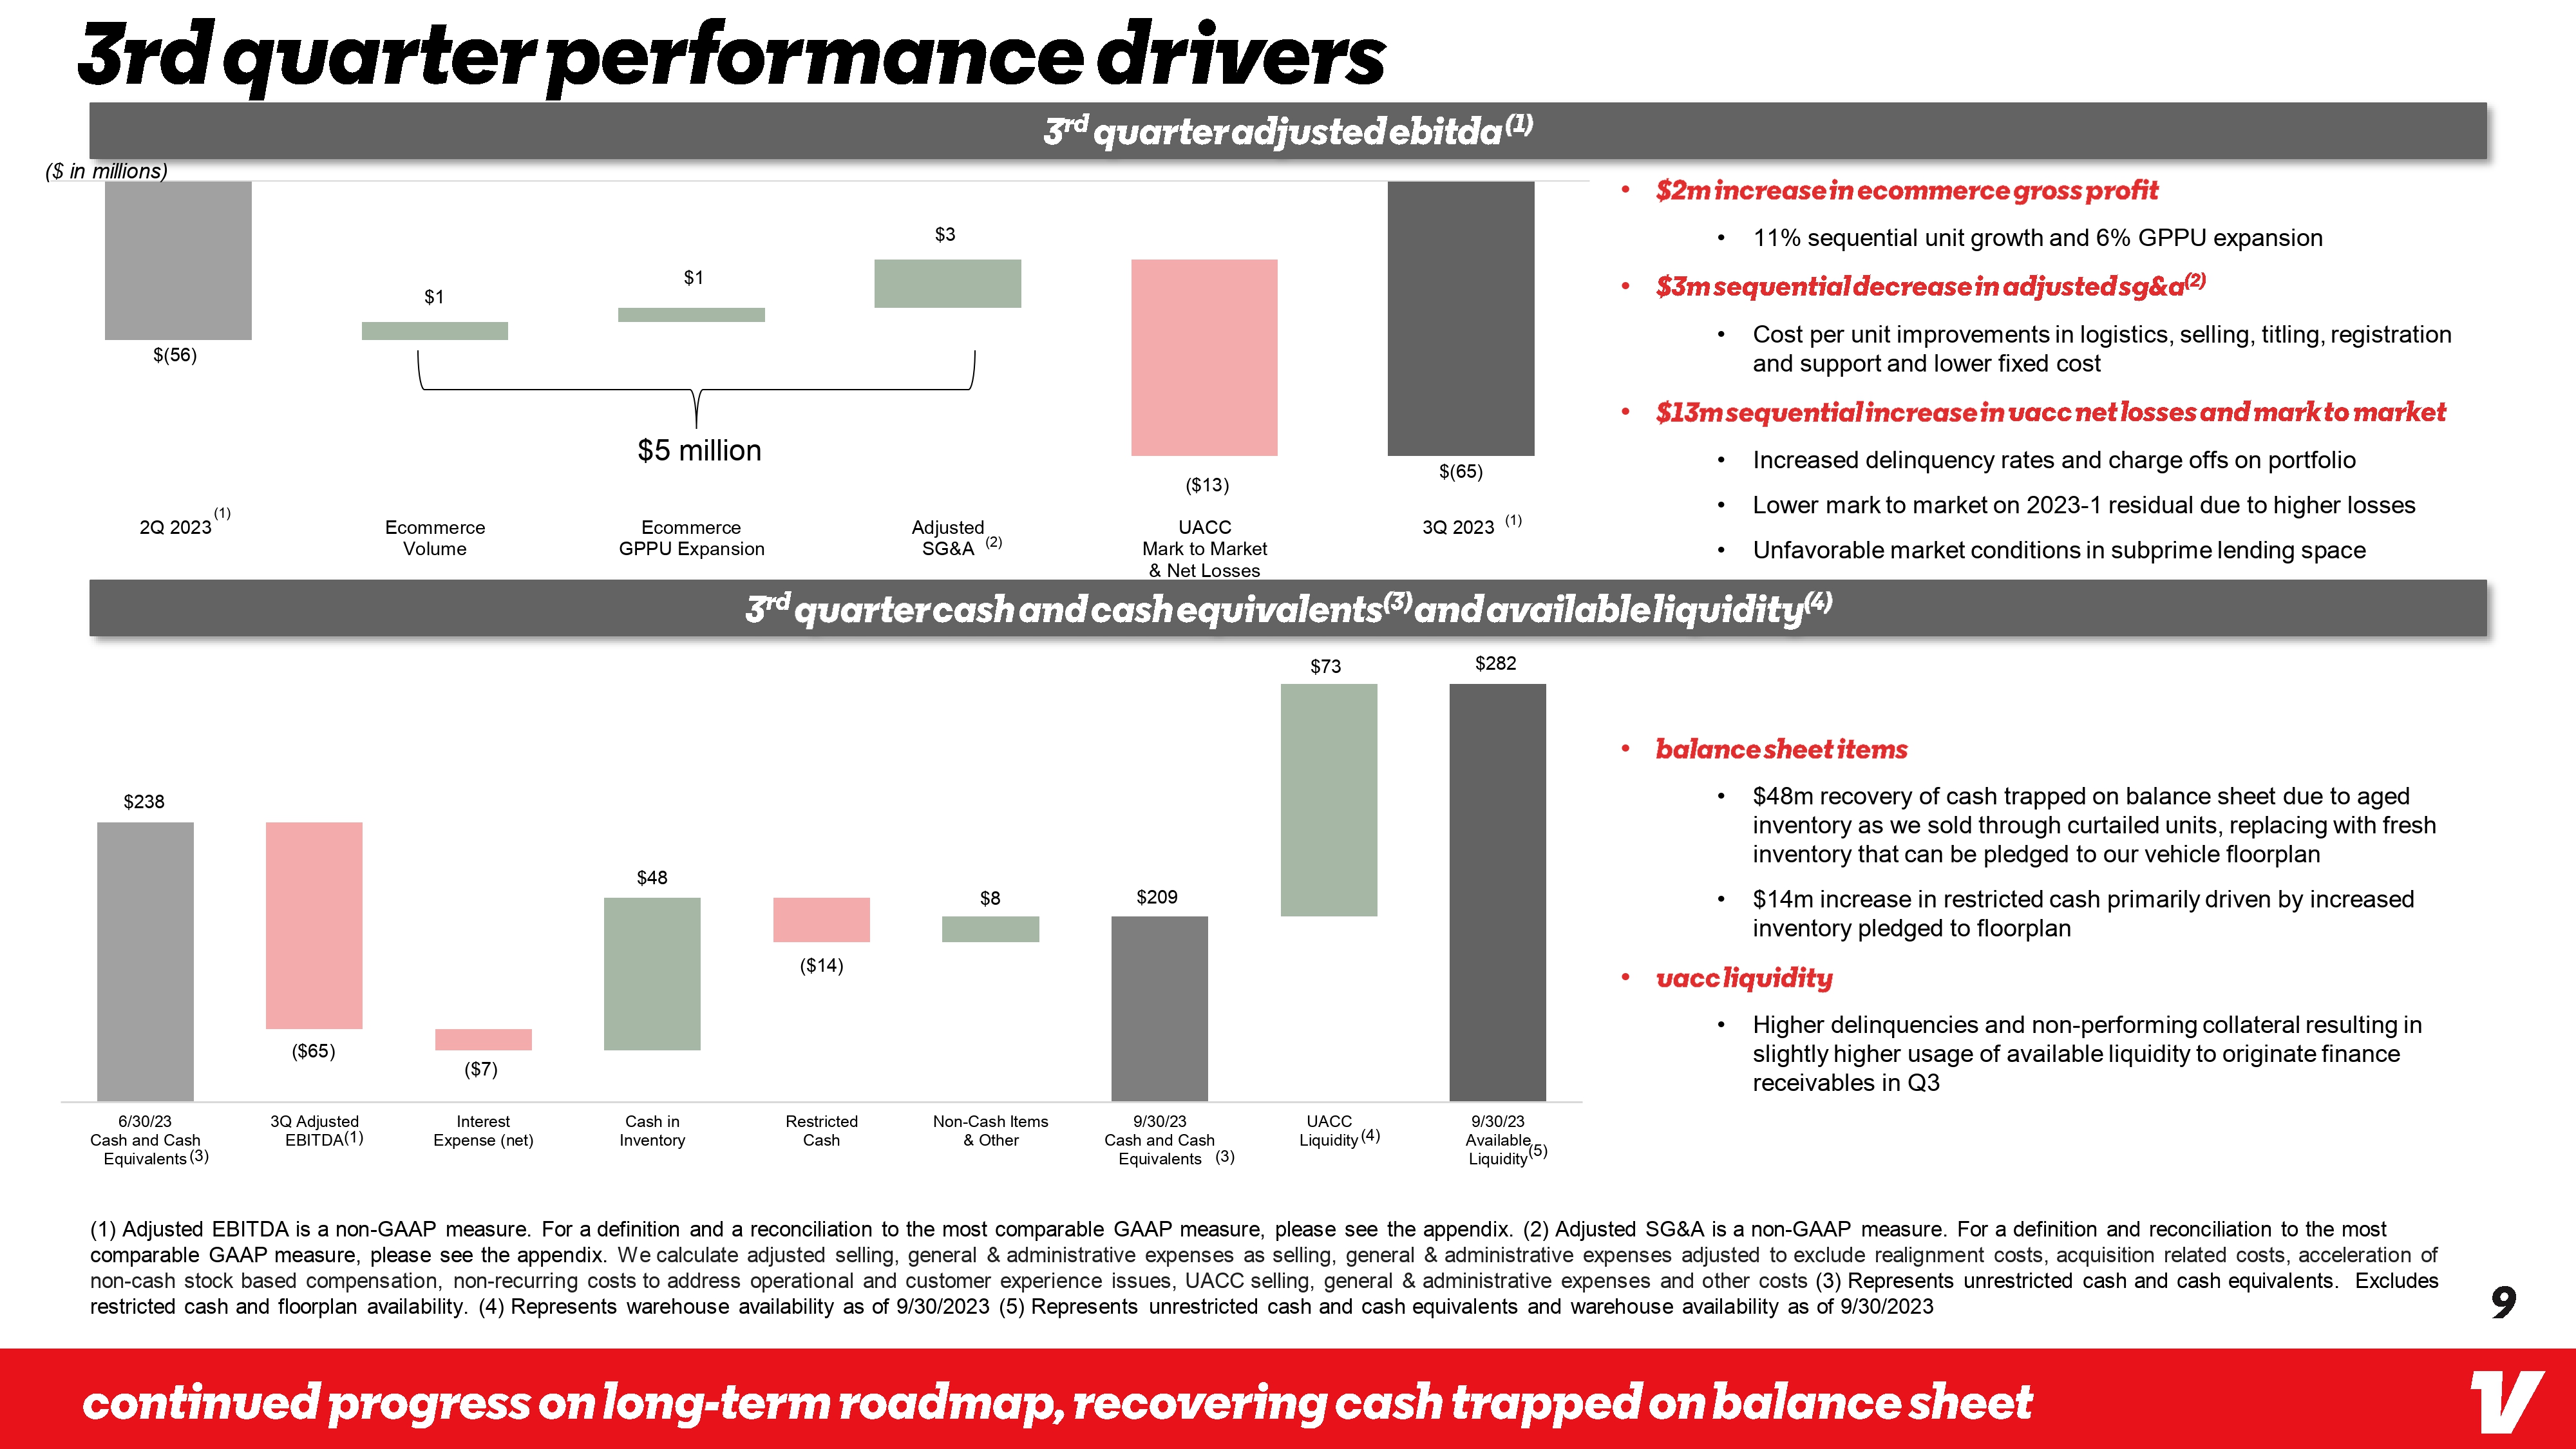
3rd quarter performance drivers ($ in millions) 3rd quarter adjusted ebitda (1) $2m increase in ecommerce gross profit $3 $1 $1 $(56) 2Q 2023 $5 million (1) Ecommerce Volume Ecommerce GPPU Expansion Adjusted SG&A (2) ($13) UACC Mark to Market & Net Losses $(65) 3Q 2023 (1) 11% sequential unit growth and 6% GPPU expansion $3m sequential decrease in adjusted sg&a(2) Cost per unit improvements in logistics, selling, titling, registration and support and lower fixed cost $13msequential increase in uacc net losses and mark to market Increased delinquency rates and charge offs on portfolio Lower mark to market on 2023-1 residual due to higher losses Unfavorable market conditions in subprime lending space 3rd quartercash and cash equivalents(3)and availableliquidity(“) $238 $48 ($14) $8 $209 $73 $282 ($65) ($7) 6/30/23 Cash and Cash 3Q Adjusted EBITDA(1) Interest Expense (net) Cash in Inventory Restricted Cash Non-Cash Items & Other 9/30/23 UACC 9/30/23 Equivalents (3) Cash and Cash Equivalents (3) Liquidity (4) Available, Liquidity (5) • balance sheet items $48m recovery of cash trapped on balance sheet due to aged inventory as we sold through curtailed units, replacing with fresh inventory that can be pledged to our vehicle floorplan $14m increase in restricted cash primarily driven by increased inventory pledged to floorplan vacc liquidity Higher delinquencies and non-performing collateral resulting in slightly higher usage of available liquidity to originate finance receivables in Q3 (1) Adjusted EBITDA is a non-GAAP measure. For a definition and a reconciliation to the most comparable GAAP measure, please see the appendix. (2) Adjusted SG&A is a non-GAAP measure. For a definition and reconciliation to the most comparable GAAP measure, please see the appendix. We calculate adjusted selling, general & administrative expenses as selling, general & administrative expenses adjusted to exclude realignment costs, acquisition related costs, acceleration of non-cash stock based compensation, non-recurring costs to address operational and customer experience issues, UACC selling, general & administrative expenses and other costs (3) Represents unrestricted cash and cash equivalents. Excludes restricted cash and floorplan availability. (4) Represents warehouse availability as of 9/30/2023 (5) Represents unrestricted cash and cash equivalents and warehouse availability as of 9/30/2023 continued progress on long-term roadmap, recovering cash trapped on balance sheet 9 V
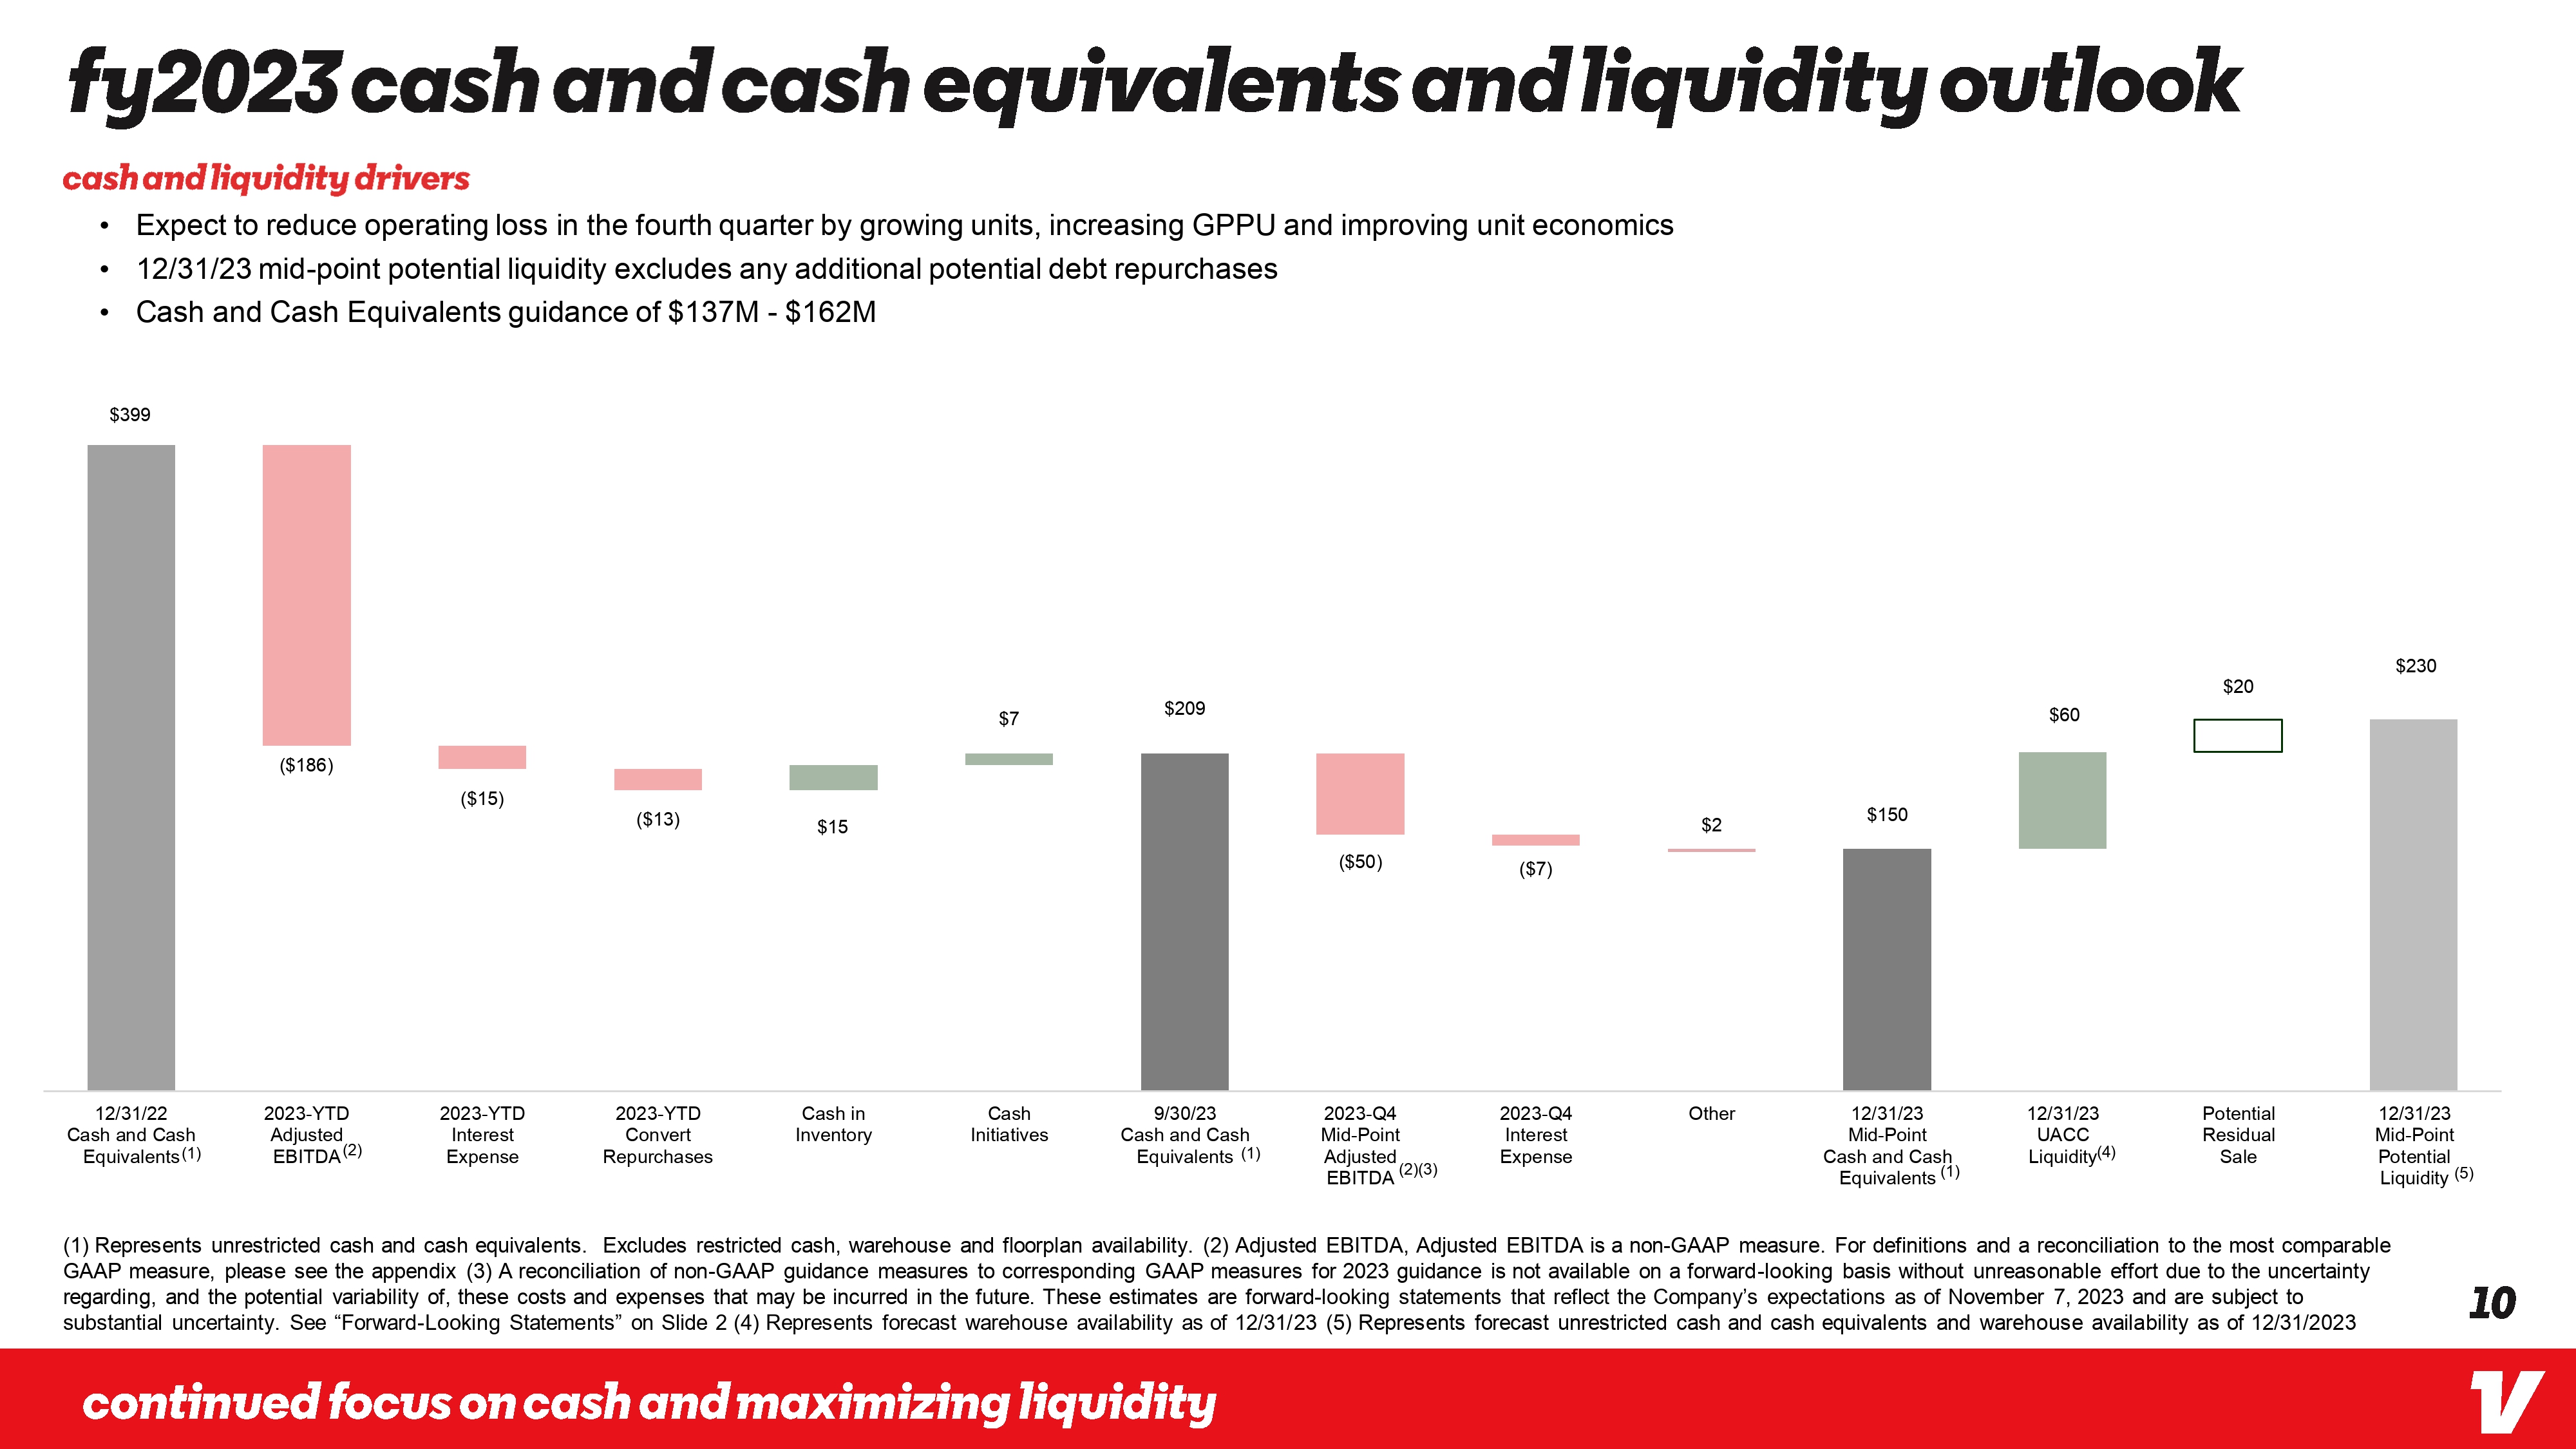
fy2023 cash and cash equivalents and liquidity outlook cash and liquidity drivers • Expect to reduce operating loss in the fourth quarter by growing units, increasing GPPU and improving unit economics · 12/31/23 mid-point potential liquidity excludes any additional potential debt repurchases • Cash and Cash Equivalents guidance of $137M - $162M $399 ($186) ($15) ($13) $15 $209 $7 $2 32 ($50) ($7) $150 $230 $20 $60 12/31/22 Cash and Cash Equivalents (1) 2023-YTD Adjusted EBITDA (2) 2023-YTD Interest Expense 2023-YTD Convert Repurchases Cash in Inventory Cash Initiatives 9/30/23 Cash and Cash Equivalents (1) 2023-Q4 Mid-Point Adjusted EBITDA (2)(3) 2023-Q4 Interest Expense Other 12/31/23 Mid-Point Cash and Cash Equivalents (1) 12/31/23 UACC Potential Residual Liquidity(4) Sale 12/31/23 Mid-Point Potential Liquidity (5) (1) Represents unrestricted cash and cash equivalents. Excludes restricted cash, warehouse and floorplan availability. (2) Adjusted EBITDA, Adjusted EBITDA is a non-GAAP measure. For definitions and a reconciliation to the most comparable GAAP measure, please see the appendix (3) A reconciliation of non-GAAP guidance measures to corresponding GAAP measures for 2023 guidance is not available on a forward-looking basis without unreasonable effort due to the uncertainty regarding, and the potential variability of, these costs and expenses that may be incurred in the future. These estimates are forward-looking statements that reflect the Company's expectations as of November 7, 2023 and are subject to substantial uncertainty. See "Forward-Looking Statements" on Slide 2 (4) Represents forecast warehouse availability as of 12/31/23 (5) Represents forecast unrestricted cash and cash equivalents and warehouse availability as of 12/31/2023 continued focus on cash and maximizing liquidity 10 V
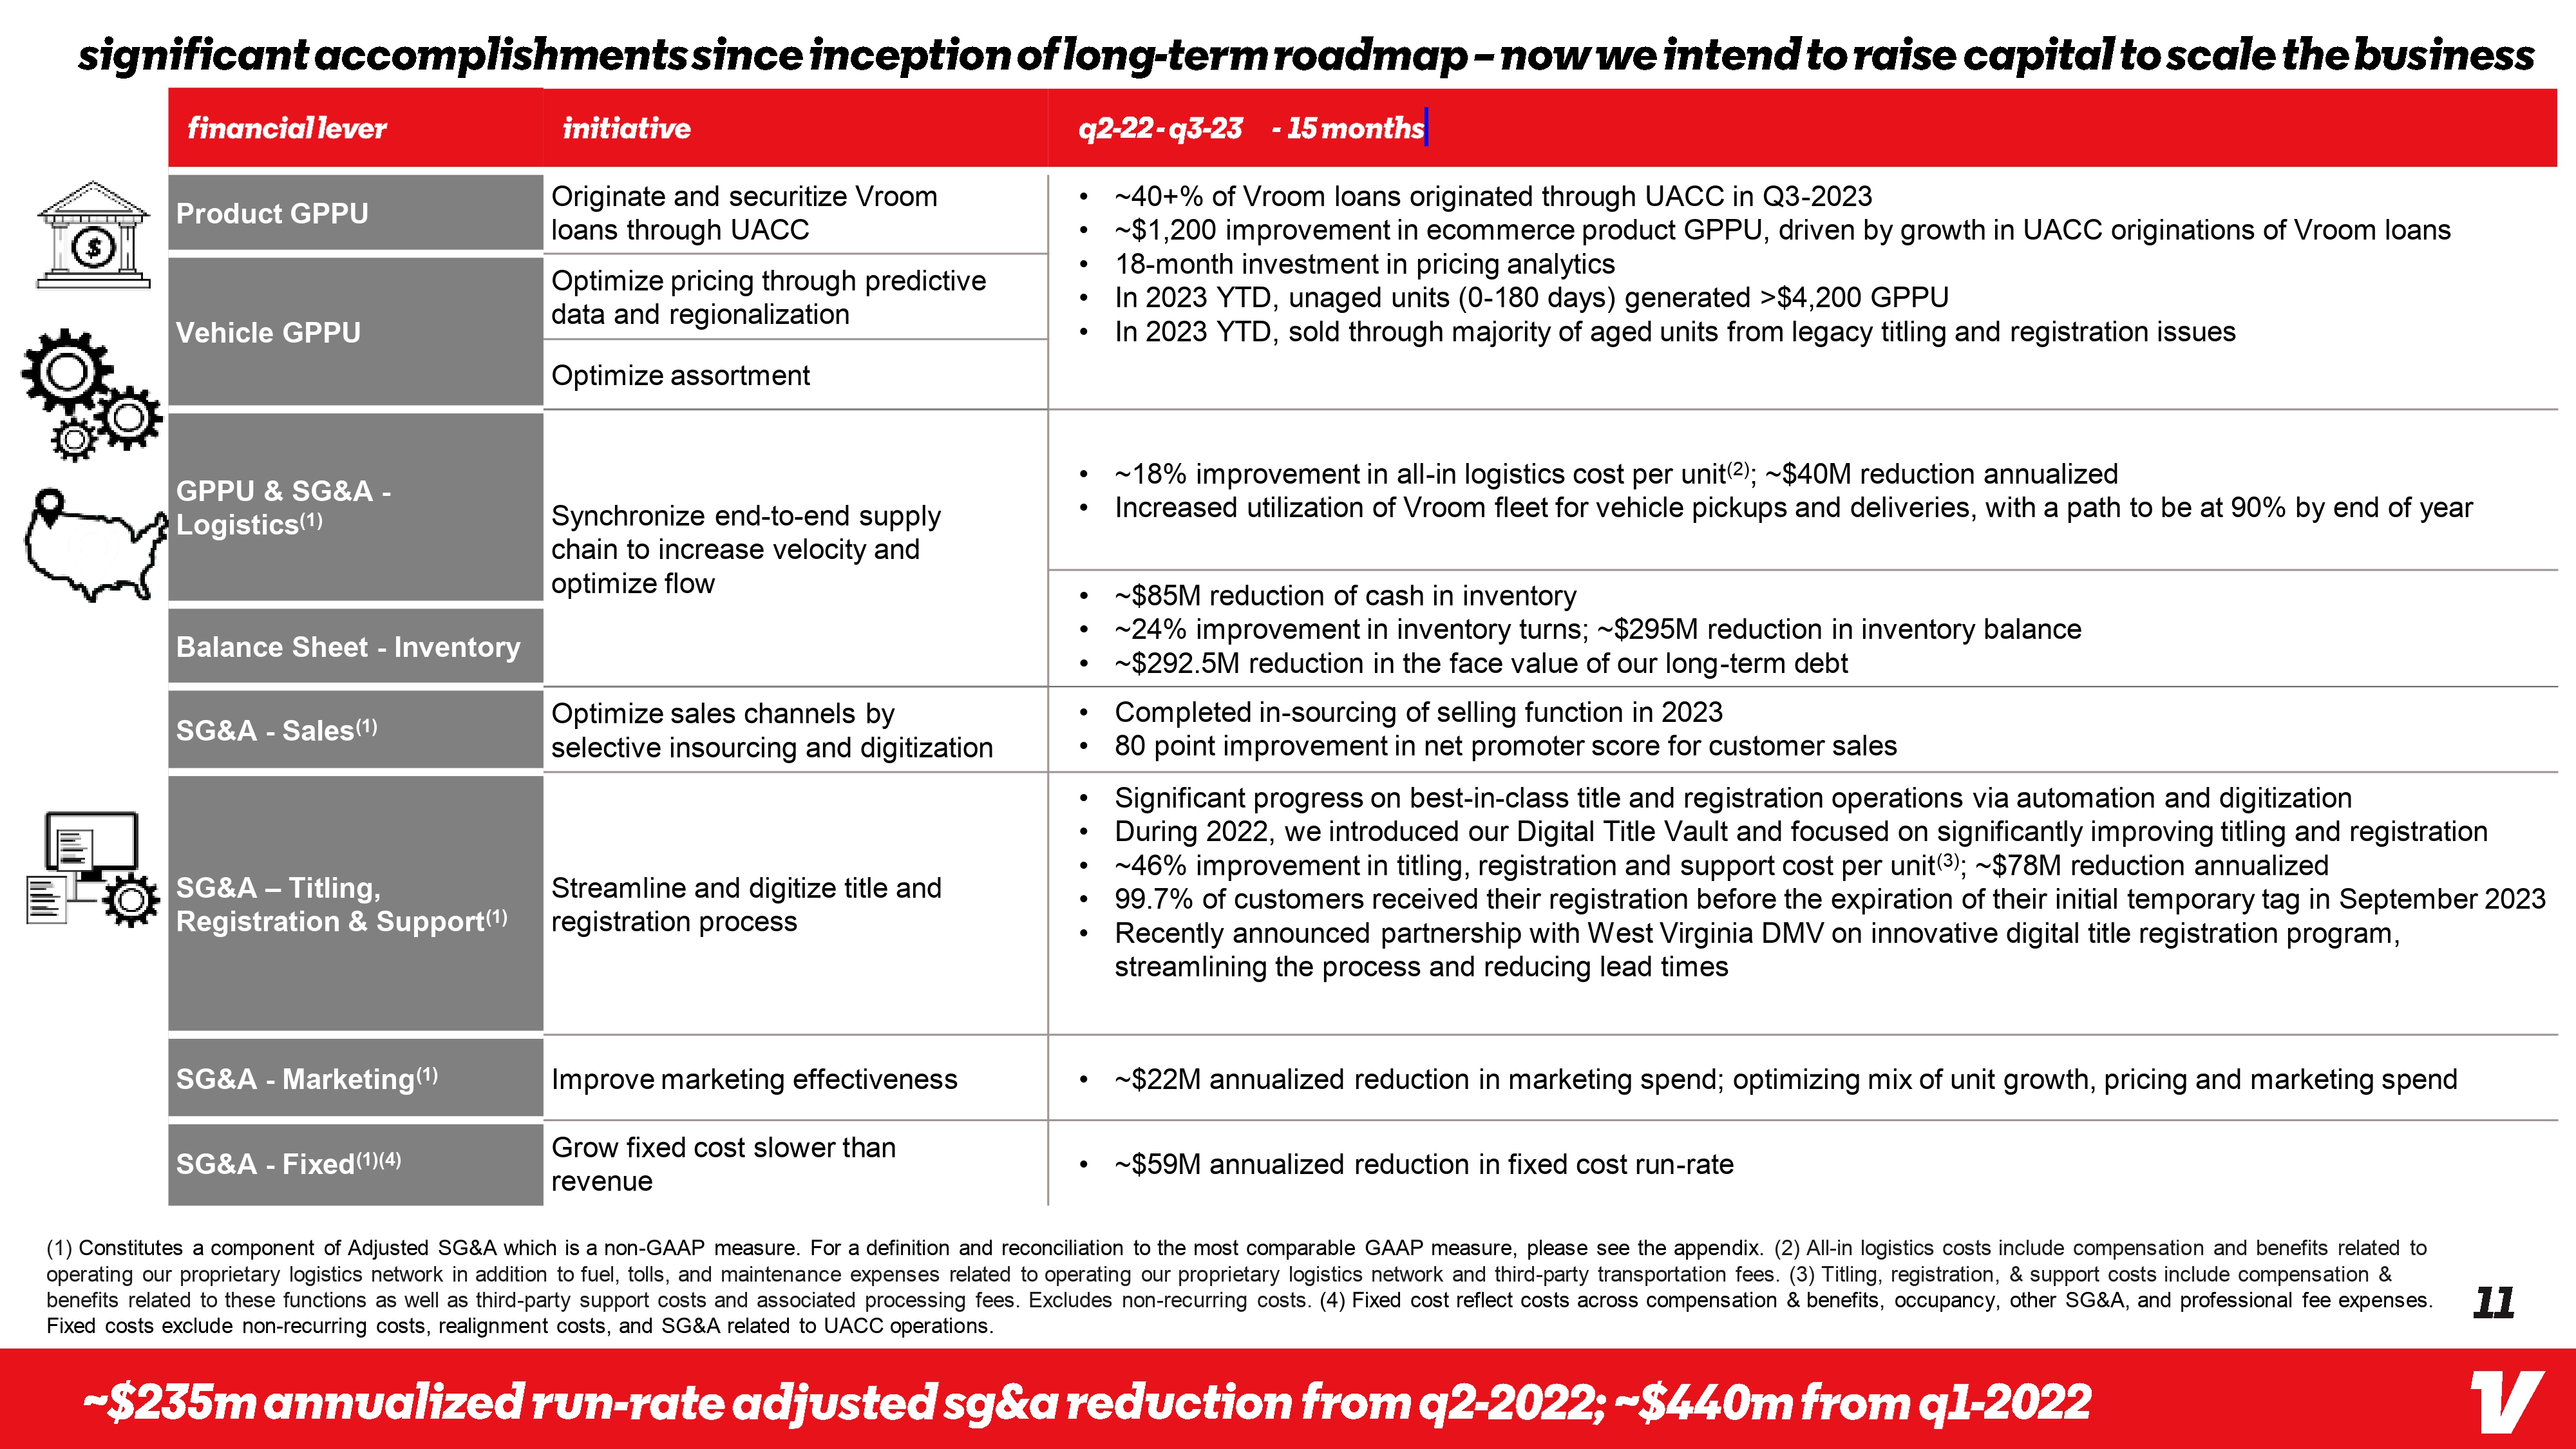
significant accomplishments since inception of long-term roadmap-now we intend to raise capital to scale the business financial lever Product GPPU Vehicle GPPU initiative Originate and securitize Vroom loans through UACC Optimize pricing through predictive data and regionalization Optimize assortment q2-22-q3-23 -15 months • ~40+% of Vroom loans originated through UACC in Q3-2023 ~$1,200 improvement in ecommerce product GPPU, driven by growth in UACC originations of Vroom loans 18-month investment in pricing analytics • In 2023 YTD, unaged units (0-180 days) generated >$4,200 GPPU • In 2023 YTD, sold through majority of aged units from legacy titling and registration issues GPPU & SG&A - Logistics(1) Balance Sheet - Inventory SG&A - Sales(1) SG&A - Titling, Registration & Support(1) Synchronize end-to-end supply chain to increase velocity and optimize flow Optimize sales channels by selective in sourcing and digitization Streamline and digitize title and registration process • ~18% improvement in all-in logistics cost per unit(2); ~$40M reduction annualized • • • • • Increased utilization of Vroom fleet for vehicle pickups and deliveries, with a path to be at 90% by end of year ~$85M reduction of cash in inventory ~24% improvement in inventory turns; ~$295M reduction in inventory balance ~$292.5M reduction in the face value of our long-term debt Completed in-sourcing of selling function in 2023 • 80 point improvement in net promoter score for customer sales • · • • Significant progress on best-in-class title and registration operations via automation and digitization During 2022, we introduced our Digital Title Vault and focused on significantly improving titling and registration ~46% improvement in titling, registration and support cost per unit(3); ~$78M reduction annualized 99.7% of customers received their registration before the expiration of their initial temporary tag in September 2023 Recently announced partnership with West Virginia DMV on innovative digital title registration program, streamlining the process and reducing lead times SG&A - Marketing(1) SG&A - Fixed(1)(4) Improve marketing effectiveness Grow fixed cost slower than revenue • ~$22M annualized reduction in marketing spend; optimizing mix of unit growth, pricing and marketing spend • ~$59M annualized reduction in fixed cost run-rate (1) Constitutes a component of Adjusted SG&A which is a non-GAAP measure. For a definition and reconciliation to the most comparable GAAP measure, please see the appendix. (2) All-in logistics costs include compensation and benefits related to operating our proprietary logistics network in addition to fuel, tolls, and maintenance expenses related to operating our proprietary logistics network and third-party transportation fees. (3) Titling, registration, & support costs include compensation & benefits related to these functions as well as third-party support costs and associated processing fees. Excludes non-recurring costs. (4) Fixed cost reflect costs across compensation & benefits, occupancy, other SG&A, and professional fee expenses. Fixed costs exclude non-recurring costs, realignment costs, and SG&A related to UACC operations. ~$235m annualized run-rate adjusted sg&a reduction from q2-2022; ~$440m from q1-2022 11 V

Vroom Appendix
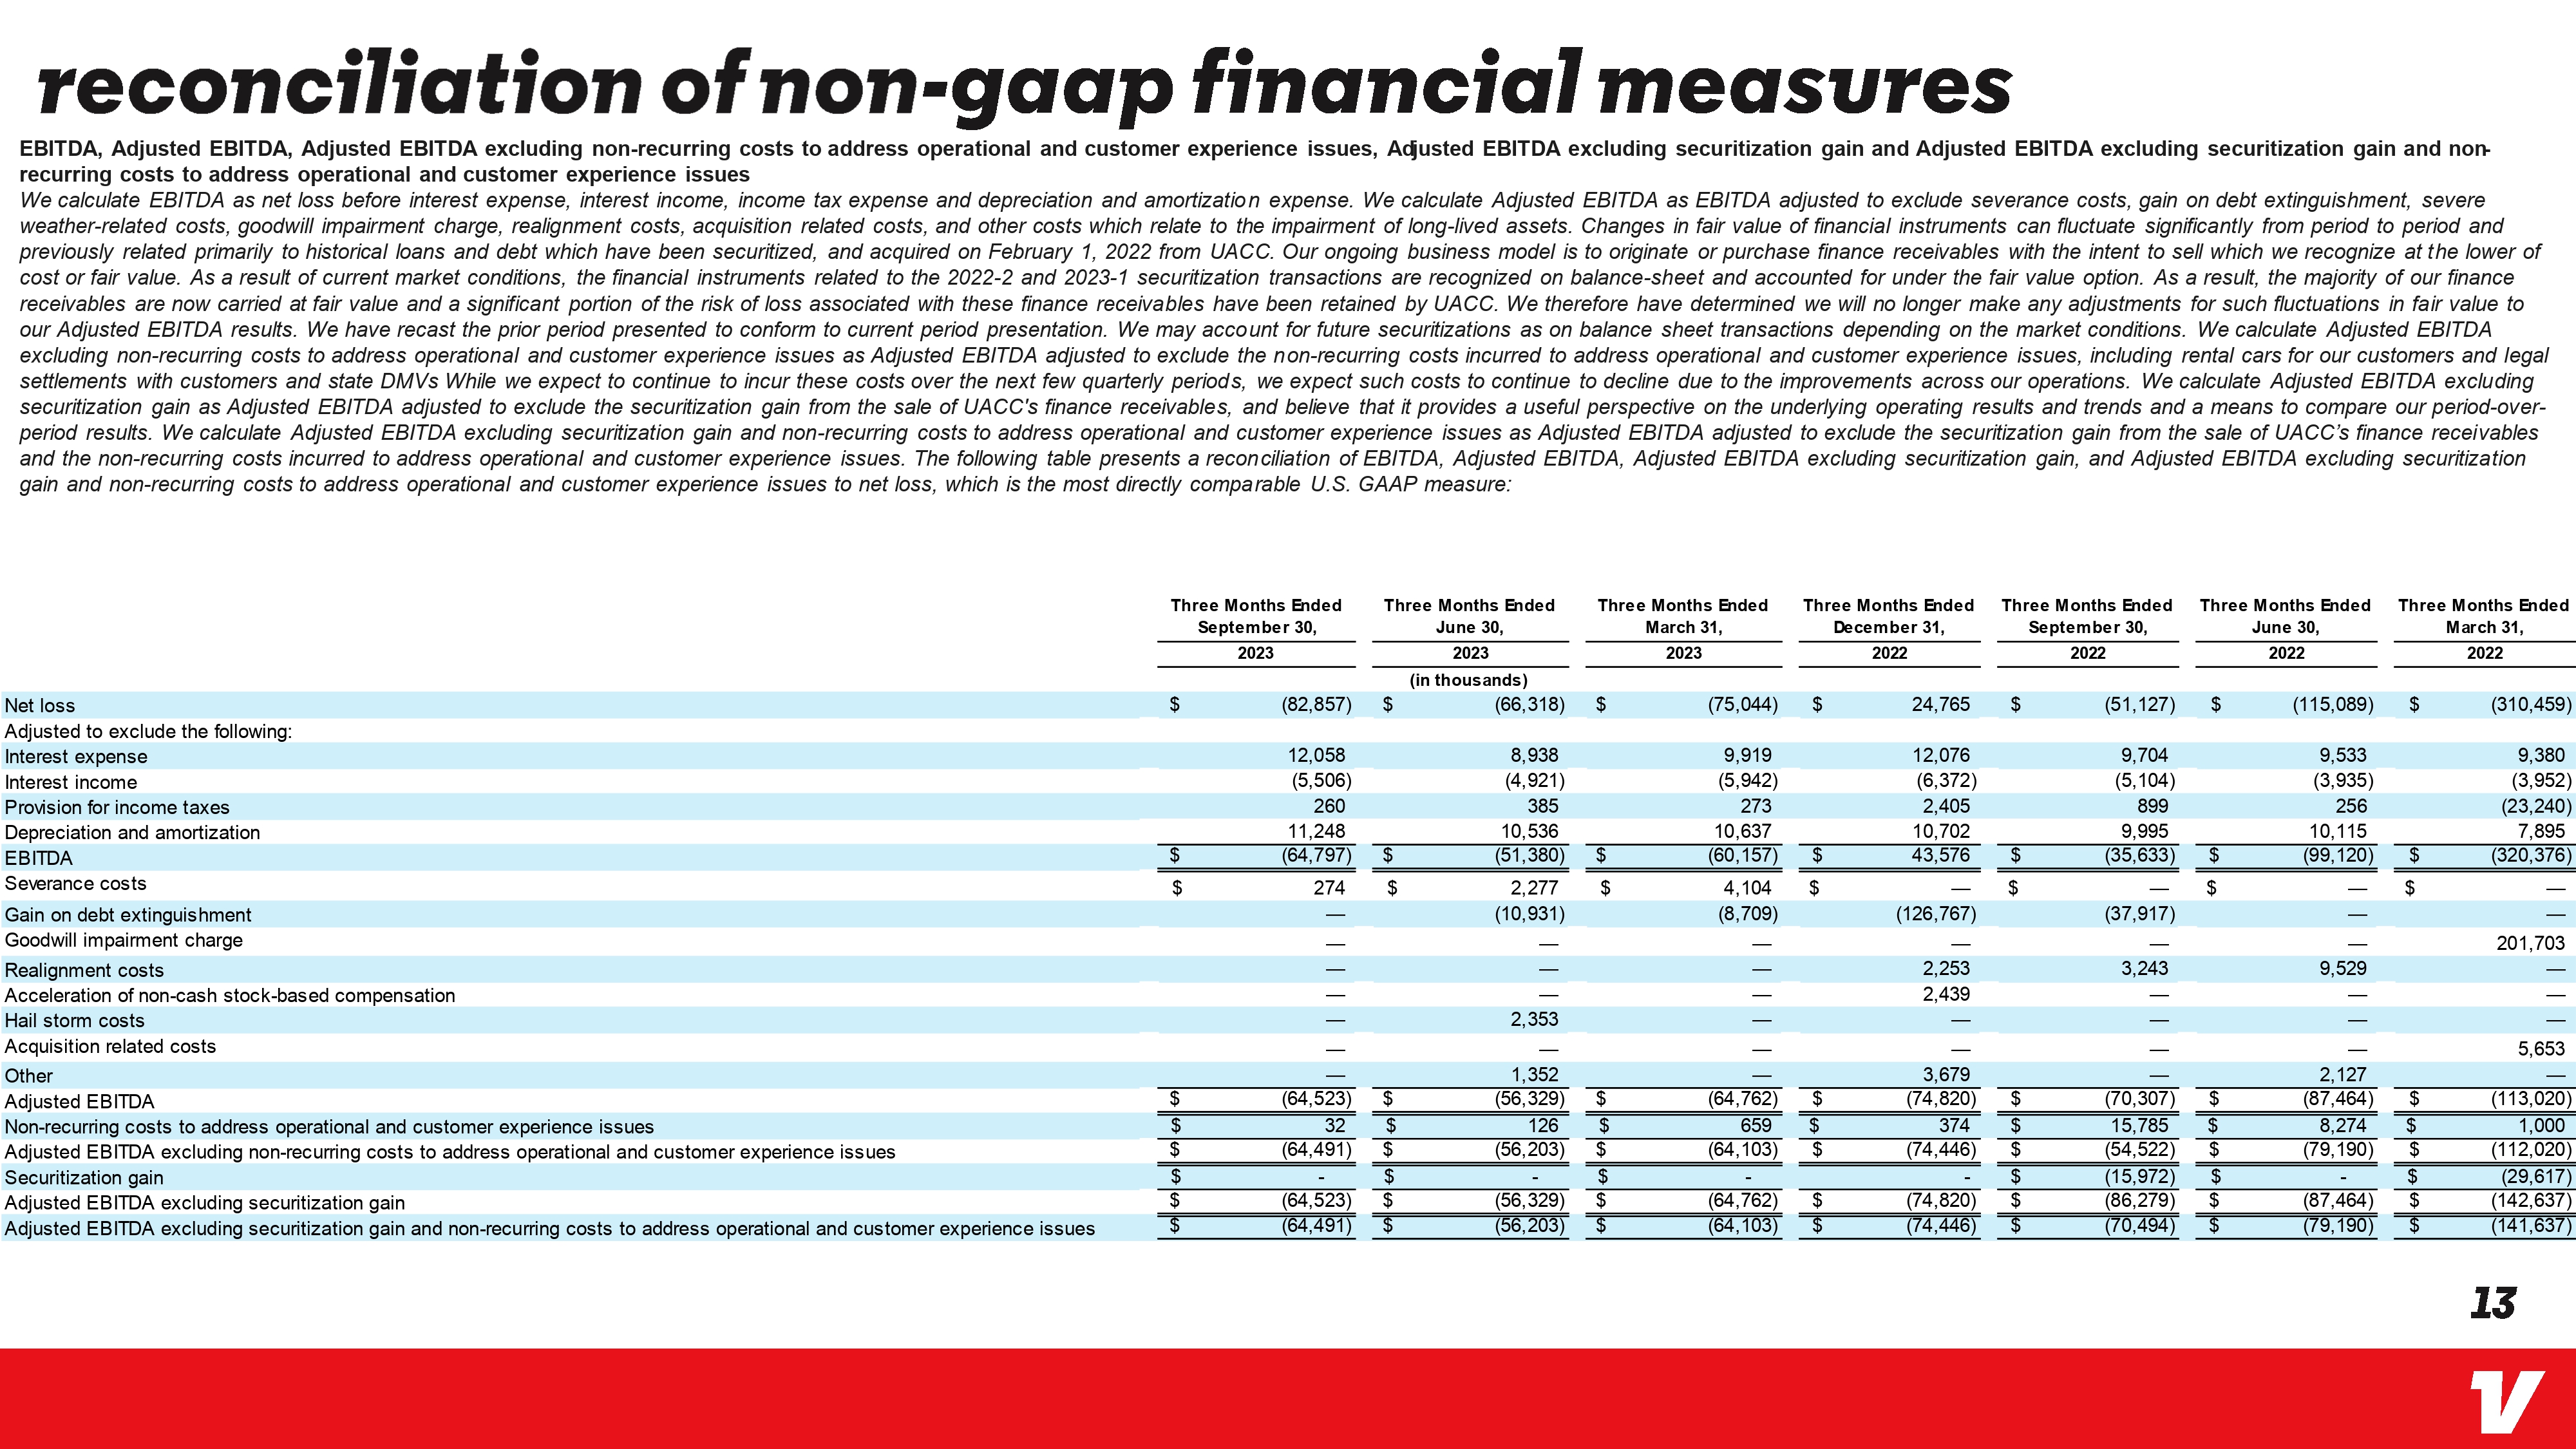
reconciliation of non-gaap financial measures EBITDA, Adjusted EBITDA, Adjusted EBITDA excluding non-recurring costs to address operational and customer experience issues, Adjusted EBITDA excluding securitization gain and Adjusted EBITDA excluding securitization gain and non- recurring costs to address operational and customer experience issues We calculate EBITDA as net loss before interest expense, interest income, income tax expense and depreciation and amortization expense. We calculate Adjusted EBITDA as EBITDA adjusted to exclude severance costs, gain on debt extinguishment, severe weather-related costs, goodwill impairment charge, realignment costs, acquisition related costs, and other costs which relate to the impairment of long-lived assets. Changes in fair value of financial instruments can fluctuate significantly from period to period and previously related primarily to historical loans and debt which have been securitized, and acquired on February 1, 2022 from UACC. Our ongoing business model is to originate or purchase finance receivables with the intent to sell which we recognize at the lower of cost or fair value. As a result of current market conditions, the financial instruments related to the 2022-2 and 2023-1 securitization transactions are recognized on balance-sheet and accounted for under the fair value option. As a result, the majority of our finance receivables are now carried at fair value and a significant portion of the risk of loss associated with these finance receivables have been retained by UACC. We therefore have determined we will no longer make any adjustments for such fluctuations in fair value to our Adjusted EBITDA results. We have recast the prior period presented to conform to current period presentation. We may account for future securitizations as on balance sheet transactions depending on the market conditions. We calculate Adjusted EBITDA excluding non-recurring costs to address operational and customer experience issues as Adjusted EBITDA adjusted to exclude the non-recurring costs incurred to address operational and customer experience issues, including rental cars for our customers and legal settlements with customers and state DMVs While we expect to continue to incur these costs over the next few quarterly periods, we expect such costs to continue to decline due to the improvements across our operations. We calculate Adjusted EBITDA excluding securitization gain as Adjusted EBITDA adjusted to exclude the securitization gain from the sale of UACC's finance receivables, and believe that it provides a useful perspective on the underlying operating results and trends and a means to compare our period-over- period results. We calculate Adjusted EBITDA excluding securitization gain and non-recurring costs to address operational and customer experience issues as Adjusted EBITDA adjusted to exclude the securitization gain from the sale of UACC's finance receivables and the non-recurring costs incurred to address operational and customer experience issues. The following table presents a reconciliation of EBITDA, Adjusted EBITDA, Adjusted EBITDA excluding securitization gain, and Adjusted EBITDA excluding securitization gain and non-recurring costs to address operational and customer experience issues to net loss, which is the most directly comparable U.S. GAAP measure: Net loss Adjusted to exclude the following: Interest expense Interest income Provision for income taxes Depreciation and amortization EBITDA Severance costs Gain on debt extinguishment Goodwill impairment charge Realignment costs Acceleration of non-cash stock-based compensation Hail storm costs Acquisition related costs Other Adjusted EBITDA Non-recurring costs to address operational and customer experience issues Adjusted EBITDA excluding non-recurring costs to address operational and customer experience issues Securitization gain Adjusted EBITDA excluding securitization gain Adjusted EBITDA excluding securitization gain and non-recurring costs to address operational and customer experience issues Three Months Ended September 30, Three Months Ended June 30, Three Months Ended March 31, Three Months Ended December 31, Three Months Ended September 30, Three Months Ended June 30, Three Months Ended 2023 2023 2023 2022 2022 2022 March 31, 2022 (in thousands) (82,857) $ (66,318) $ (75,044) $ 24,765 (51,127) (115,089) $ (310,459) 12,058 8,938 (5,506) (4,921) 9,919 (5,942) 12,076 9,704 (6,372) (5,104) 260 385 273 2,405 899 9,533 (3,935) 256 9,380 (3,952) (23,240) 11,248 10,536 $ (64,797) $ (51,380) $ $ 274 $ 2,277 $ (10,931) 10,637 (60,157) 4,104 (8,709) 10,702 9,995 $ 43,576 $ ― $ (35,633) $ $ 10,115 (99,120) 7,895 $ (320,376) (126,767) (37,917) 2,253 3,243 201,703 9,529 2,439 2,353 5,653 1,352 3,679 AAAA (64,523) $ (56,329) $ (64,762) (74,820) $ (70,307) $ $ 32 $ 126 $ 659 $ 374 $ 15,785 $ 2,127 (87,464) $ 8,274 $ (113,020) 1,000 (64,491) $ (56,203) $ (64,103) (74,446) $ (54,522) $ (79,190) $ (112,020) $ $ $ (15,972) $ $ (29,617) (64,523) $ (64,491) $ (56,329) $ (64,762) $ (74,820) $ (86,279) $ (56,203) $ (64,103) $ (74,446) $ (70,494) $ AA (87,464) $ (79,190) (142,637) (141,637) 13 V
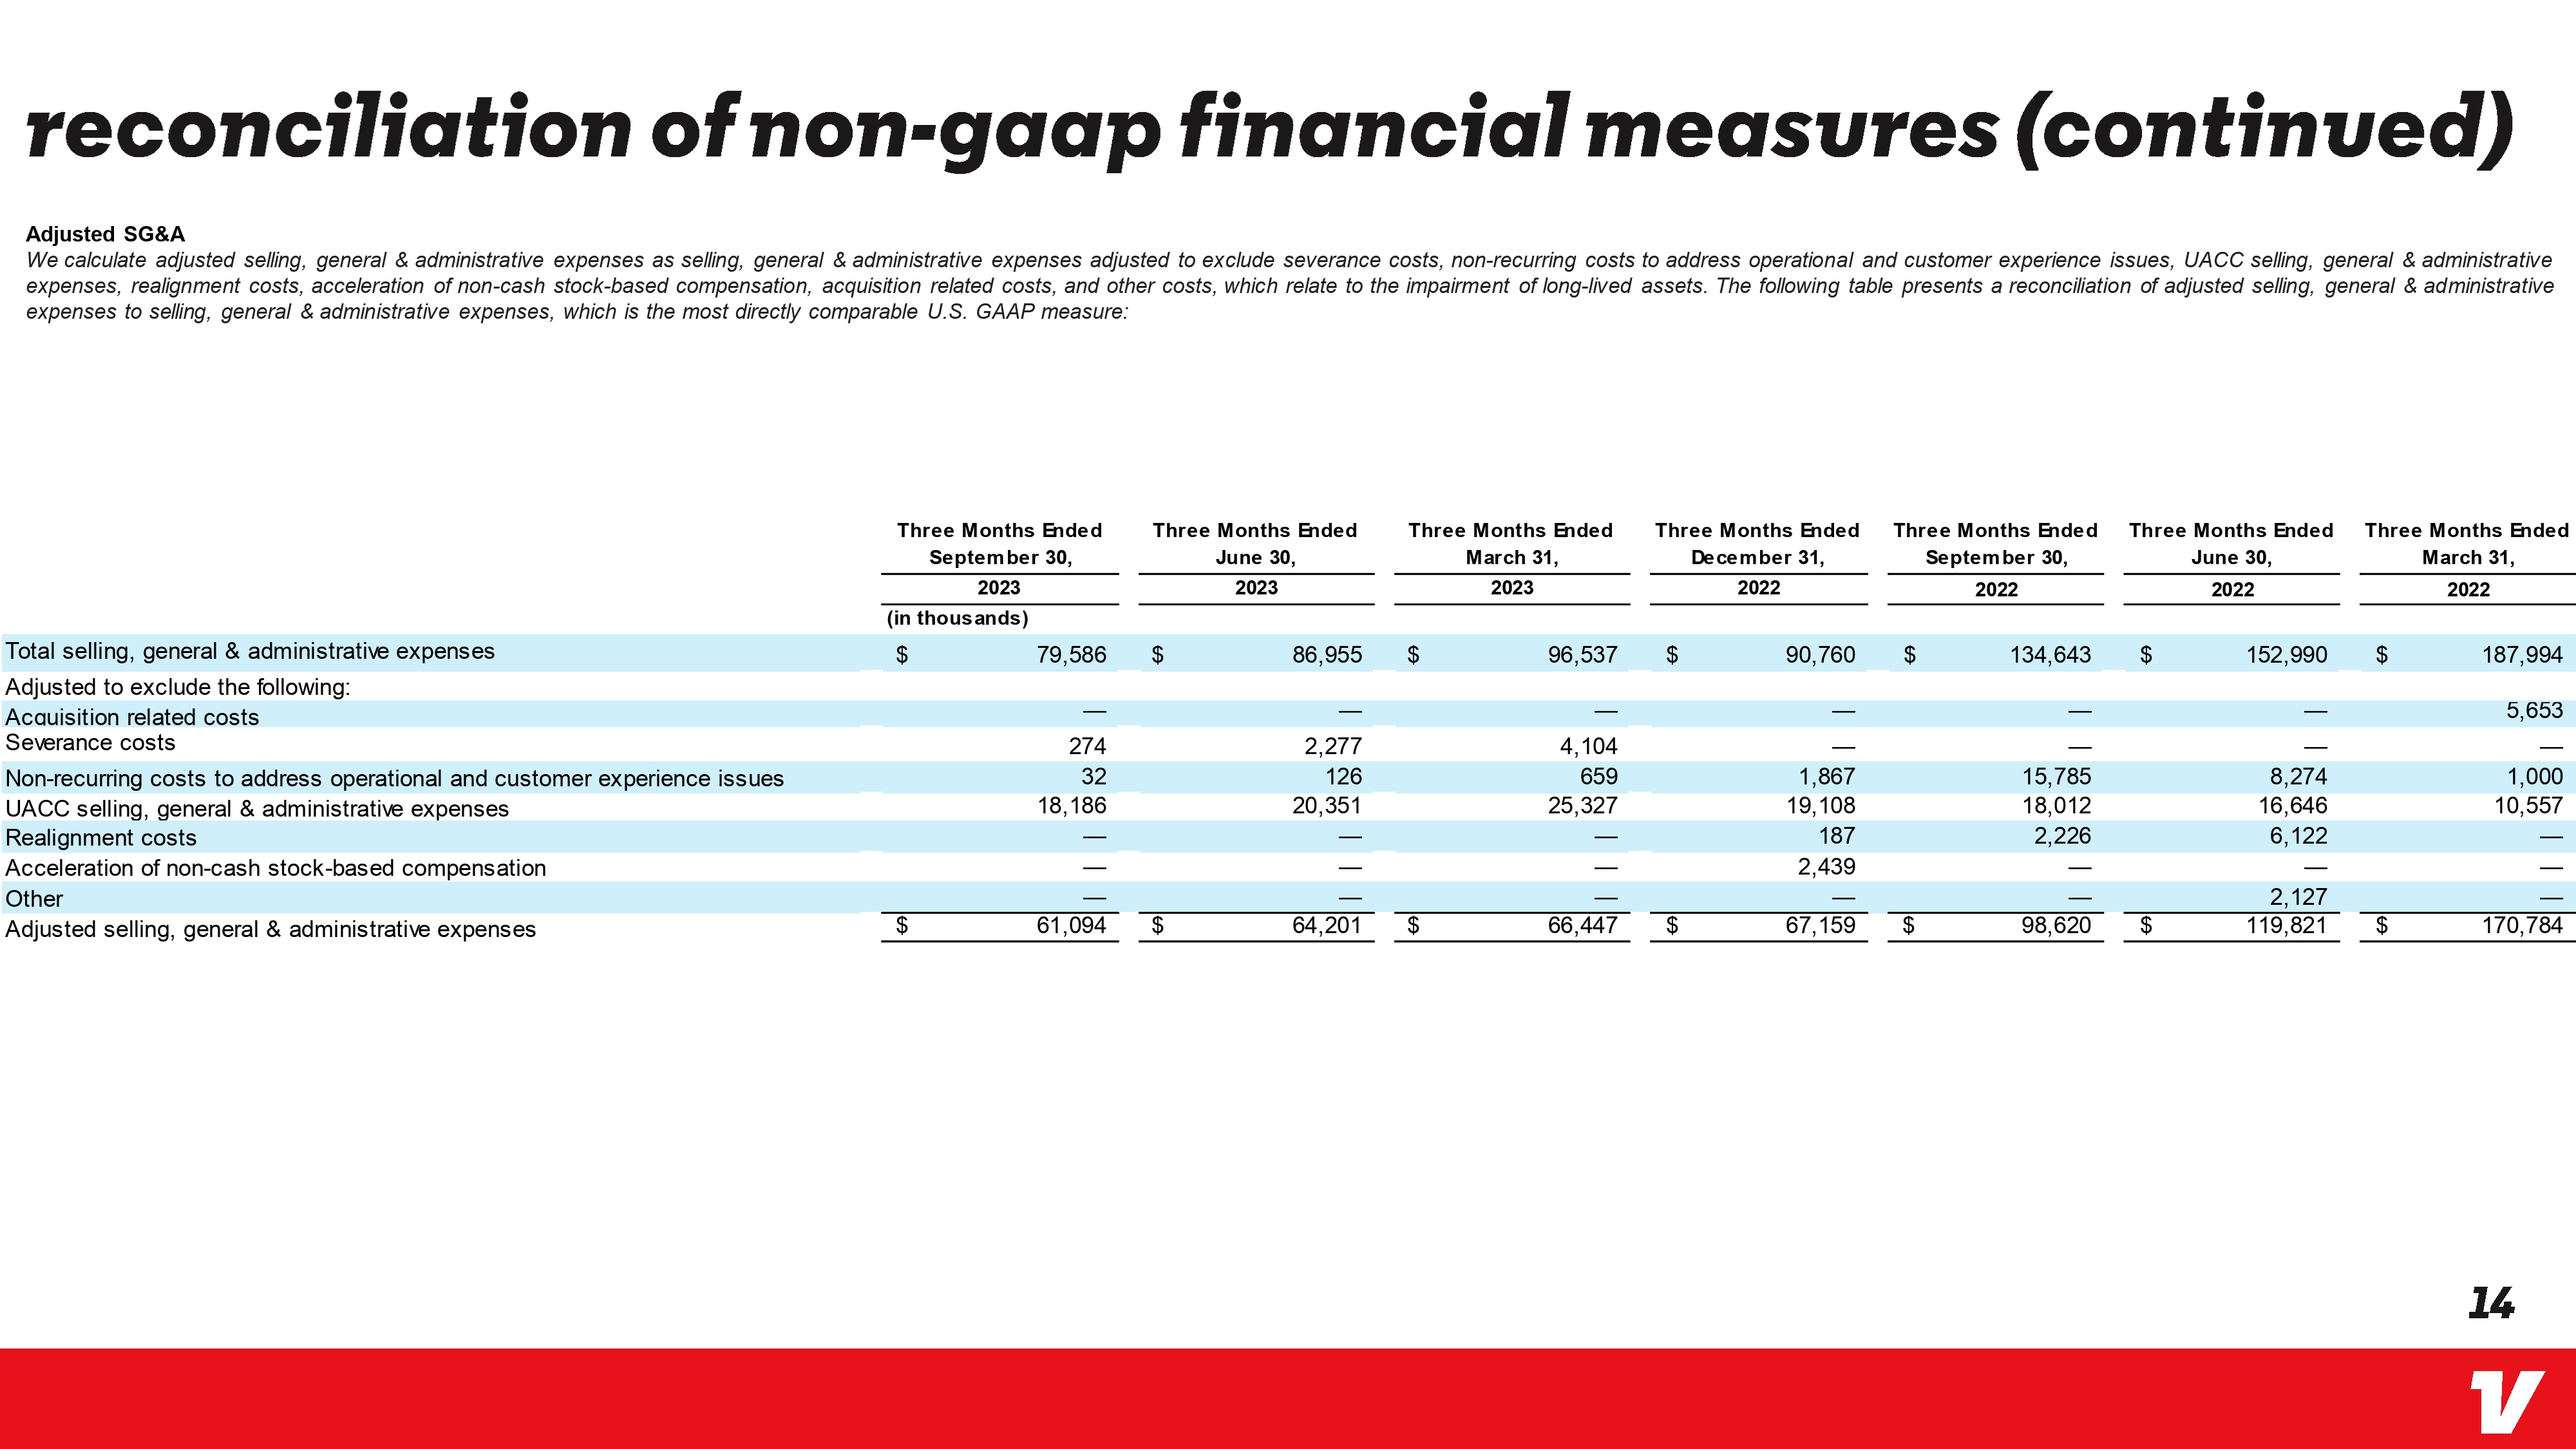
reconciliation of non-gaap financial measures (continued) Adjusted SG&A We calculate adjusted selling, general & administrative expenses as selling, general & administrative expenses adjusted to exclude severance costs, non-recurring costs to address operational and customer experience issues, UACC selling, general & administrative expenses, realignment costs, acceleration of non-cash stock-based compensation, acquisition related costs, and other costs, which relate to the impairment of long-lived assets. The following table presents a reconciliation of adjusted selling, general & administrative expenses to selling, general & administrative expenses, which is the most directly comparable U.S. GAAP measure: Total selling, general & administrative expenses Adjusted to exclude the following: Acquisition related costs Severance costs Non-recurring costs to address operational and customer experience issues UACC selling, general & administrative expenses Realignment costs Acceleration of non-cash stock-based compensation Other Adjusted selling, general & administrative expenses Three Months Ended September 30, Three Months Ended June 30, Three Months Ended Three Months Ended March 31, December 31, 2023 2023 2023 2022 Three Months Ended September 30, 2022 Three Months Ended June 30, Three Months Ended March 31, 2022 2022 (in thousands) 79,586 $ 86,955 $ 96,537 GA 90,760 134,643 GA 152,990 $ 187,994 5,653 274 32 18,186 2,277 126 20,351 4,104 659 25,327 1,867 15,785 8,274 1,000 19,108 18,012 16,646 10,557 187 2,226 6,122 2,439 2,127 $ 61,094 $ 64,201 $ 66,447 $ 67,159 $ 98,620 $ 119,821 $ 170,784 14 V

thank you 15 V
v3.23.3
Document and Entity Information
|
Nov. 07, 2023 |
| Cover [Abstract] |
|
| Amendment Flag |
false
|
| Entity Central Index Key |
0001580864
|
| Document Type |
8-K
|
| Document Period End Date |
Nov. 07, 2023
|
| Entity Registrant Name |
VROOM, INC.
|
| Entity Incorporation, State or Country Code |
DE
|
| Securities Act File Number |
001-39315
|
| Entity Tax Identification Number |
90-1112566
|
| Entity Address, Address Line One |
3600 W Sam Houston Pkwy S
|
| Entity Address, Address Line Two |
Floor 4
|
| Entity Address, City or Town |
Houston
|
| Entity Address, State or Province |
TX
|
| Entity Address, Postal Zip Code |
77042
|
| City Area Code |
518
|
| Local Phone Number |
535-9125
|
| Written Communications |
false
|
| Soliciting Material |
false
|
| Pre-commencement Tender Offer |
false
|
| Pre-commencement Issuer Tender Offer |
false
|
| Security 12b Title |
Common Stock, $0.001 par value per share
|
| Trading Symbol |
VRM
|
| Security Exchange Name |
NASDAQ
|
| Entity Emerging Growth Company |
false
|
| X |
- DefinitionBoolean flag that is true when the XBRL content amends previously-filed or accepted submission.
| Name: |
dei_AmendmentFlag |
| Namespace Prefix: |
dei_ |
| Data Type: |
xbrli:booleanItemType |
| Balance Type: |
na |
| Period Type: |
duration |
|
| X |
- DefinitionFor the EDGAR submission types of Form 8-K: the date of the report, the date of the earliest event reported; for the EDGAR submission types of Form N-1A: the filing date; for all other submission types: the end of the reporting or transition period. The format of the date is YYYY-MM-DD.
| Name: |
dei_DocumentPeriodEndDate |
| Namespace Prefix: |
dei_ |
| Data Type: |
xbrli:dateItemType |
| Balance Type: |
na |
| Period Type: |
duration |
|
| X |
- DefinitionThe type of document being provided (such as 10-K, 10-Q, 485BPOS, etc). The document type is limited to the same value as the supporting SEC submission type, or the word 'Other'.
| Name: |
dei_DocumentType |
| Namespace Prefix: |
dei_ |
| Data Type: |
dei:submissionTypeItemType |
| Balance Type: |
na |
| Period Type: |
duration |
|
| X |
- DefinitionAddress Line 1 such as Attn, Building Name, Street Name
| Name: |
dei_EntityAddressAddressLine1 |
| Namespace Prefix: |
dei_ |
| Data Type: |
xbrli:normalizedStringItemType |
| Balance Type: |
na |
| Period Type: |
duration |
|
| X |
- DefinitionAddress Line 2 such as Street or Suite number
| Name: |
dei_EntityAddressAddressLine2 |
| Namespace Prefix: |
dei_ |
| Data Type: |
xbrli:normalizedStringItemType |
| Balance Type: |
na |
| Period Type: |
duration |
|
| X |
- Definition
+ References
+ Details
| Name: |
dei_EntityAddressCityOrTown |
| Namespace Prefix: |
dei_ |
| Data Type: |
xbrli:normalizedStringItemType |
| Balance Type: |
na |
| Period Type: |
duration |
|
| X |
- DefinitionCode for the postal or zip code
| Name: |
dei_EntityAddressPostalZipCode |
| Namespace Prefix: |
dei_ |
| Data Type: |
xbrli:normalizedStringItemType |
| Balance Type: |
na |
| Period Type: |
duration |
|
| X |
- DefinitionName of the state or province.
| Name: |
dei_EntityAddressStateOrProvince |
| Namespace Prefix: |
dei_ |
| Data Type: |
dei:stateOrProvinceItemType |
| Balance Type: |
na |
| Period Type: |
duration |
|
| X |
- DefinitionA unique 10-digit SEC-issued value to identify entities that have filed disclosures with the SEC. It is commonly abbreviated as CIK. Reference 1: http://www.xbrl.org/2003/role/presentationRef
-Publisher SEC
-Name Exchange Act
-Number 240
-Section 12
-Subsection b-2
| Name: |
dei_EntityCentralIndexKey |
| Namespace Prefix: |
dei_ |
| Data Type: |
dei:centralIndexKeyItemType |
| Balance Type: |
na |
| Period Type: |
duration |
|
| X |
- DefinitionIndicate if registrant meets the emerging growth company criteria. Reference 1: http://www.xbrl.org/2003/role/presentationRef
-Publisher SEC
-Name Exchange Act
-Number 240
-Section 12
-Subsection b-2
| Name: |
dei_EntityEmergingGrowthCompany |
| Namespace Prefix: |
dei_ |
| Data Type: |
xbrli:booleanItemType |
| Balance Type: |
na |
| Period Type: |
duration |
|
| X |
- DefinitionCommission file number. The field allows up to 17 characters. The prefix may contain 1-3 digits, the sequence number may contain 1-8 digits, the optional suffix may contain 1-4 characters, and the fields are separated with a hyphen.
| Name: |
dei_EntityFileNumber |
| Namespace Prefix: |
dei_ |
| Data Type: |
dei:fileNumberItemType |
| Balance Type: |
na |
| Period Type: |
duration |
|
| X |
- DefinitionTwo-character EDGAR code representing the state or country of incorporation.
| Name: |
dei_EntityIncorporationStateCountryCode |
| Namespace Prefix: |
dei_ |
| Data Type: |
dei:edgarStateCountryItemType |
| Balance Type: |
na |
| Period Type: |
duration |
|
| X |
- DefinitionThe exact name of the entity filing the report as specified in its charter, which is required by forms filed with the SEC. Reference 1: http://www.xbrl.org/2003/role/presentationRef
-Publisher SEC
-Name Exchange Act
-Number 240
-Section 12
-Subsection b-2
| Name: |
dei_EntityRegistrantName |
| Namespace Prefix: |
dei_ |
| Data Type: |
xbrli:normalizedStringItemType |
| Balance Type: |
na |
| Period Type: |
duration |
|
| X |
- DefinitionThe Tax Identification Number (TIN), also known as an Employer Identification Number (EIN), is a unique 9-digit value assigned by the IRS. Reference 1: http://www.xbrl.org/2003/role/presentationRef
-Publisher SEC
-Name Exchange Act
-Number 240
-Section 12
-Subsection b-2
| Name: |
dei_EntityTaxIdentificationNumber |
| Namespace Prefix: |
dei_ |
| Data Type: |
dei:employerIdItemType |
| Balance Type: |
na |
| Period Type: |
duration |
|
| X |
- DefinitionLocal phone number for entity.
| Name: |
dei_LocalPhoneNumber |
| Namespace Prefix: |
dei_ |
| Data Type: |
xbrli:normalizedStringItemType |
| Balance Type: |
na |
| Period Type: |
duration |
|
| X |
- DefinitionBoolean flag that is true when the Form 8-K filing is intended to satisfy the filing obligation of the registrant as pre-commencement communications pursuant to Rule 13e-4(c) under the Exchange Act. Reference 1: http://www.xbrl.org/2003/role/presentationRef
-Publisher SEC
-Name Exchange Act
-Number 240
-Section 13e
-Subsection 4c
| Name: |
dei_PreCommencementIssuerTenderOffer |
| Namespace Prefix: |
dei_ |
| Data Type: |
xbrli:booleanItemType |
| Balance Type: |
na |
| Period Type: |
duration |
|
| X |
- DefinitionBoolean flag that is true when the Form 8-K filing is intended to satisfy the filing obligation of the registrant as pre-commencement communications pursuant to Rule 14d-2(b) under the Exchange Act. Reference 1: http://www.xbrl.org/2003/role/presentationRef
-Publisher SEC
-Name Exchange Act
-Number 240
-Section 14d
-Subsection 2b
| Name: |
dei_PreCommencementTenderOffer |
| Namespace Prefix: |
dei_ |
| Data Type: |
xbrli:booleanItemType |
| Balance Type: |
na |
| Period Type: |
duration |
|
| X |
- DefinitionTitle of a 12(b) registered security. Reference 1: http://www.xbrl.org/2003/role/presentationRef
-Publisher SEC
-Name Exchange Act
-Number 240
-Section 12
-Subsection b
| Name: |
dei_Security12bTitle |
| Namespace Prefix: |
dei_ |
| Data Type: |
dei:securityTitleItemType |
| Balance Type: |
na |
| Period Type: |
duration |
|
| X |
- DefinitionName of the Exchange on which a security is registered. Reference 1: http://www.xbrl.org/2003/role/presentationRef
-Publisher SEC
-Name Exchange Act
-Number 240
-Section 12
-Subsection d1-1
| Name: |
dei_SecurityExchangeName |
| Namespace Prefix: |
dei_ |
| Data Type: |
dei:edgarExchangeCodeItemType |
| Balance Type: |
na |
| Period Type: |
duration |
|
| X |
- DefinitionBoolean flag that is true when the Form 8-K filing is intended to satisfy the filing obligation of the registrant as soliciting material pursuant to Rule 14a-12 under the Exchange Act. Reference 1: http://www.xbrl.org/2003/role/presentationRef
-Publisher SEC
-Name Exchange Act
-Section 14a
-Number 240
-Subsection 12
| Name: |
dei_SolicitingMaterial |
| Namespace Prefix: |
dei_ |
| Data Type: |
xbrli:booleanItemType |
| Balance Type: |
na |
| Period Type: |
duration |
|
| X |
- DefinitionTrading symbol of an instrument as listed on an exchange.
| Name: |
dei_TradingSymbol |
| Namespace Prefix: |
dei_ |
| Data Type: |
dei:tradingSymbolItemType |
| Balance Type: |
na |
| Period Type: |
duration |
|
| X |
- DefinitionBoolean flag that is true when the Form 8-K filing is intended to satisfy the filing obligation of the registrant as written communications pursuant to Rule 425 under the Securities Act. Reference 1: http://www.xbrl.org/2003/role/presentationRef
-Publisher SEC
-Name Securities Act
-Number 230
-Section 425
| Name: |
dei_WrittenCommunications |
| Namespace Prefix: |
dei_ |
| Data Type: |
xbrli:booleanItemType |
| Balance Type: |
na |
| Period Type: |
duration |
|
Vroom (NASDAQ:VRM)
Historical Stock Chart
From Mar 2024 to Apr 2024

Vroom (NASDAQ:VRM)
Historical Stock Chart
From Apr 2023 to Apr 2024
