U.S. Index Futures Modestly Higher Before Key Economic Data Release; Early Closure for July 4th Holiday
July 03 2024 - 7:01AM
IH Market News
U.S. index futures are modestly higher this Wednesday, with
investors awaiting a series of significant economic data. U.S.
markets will close early today at 1 PM and remain closed on
Thursday due to the July 4th holiday.
At 6:21 AM, Dow Jones futures (DOWI:DJI) were up 47 points, or
0.12%. S&P 500 futures advanced 0.02%, and Nasdaq-100 futures
gained 0.05%. The 10-year Treasury yield stood at 4.429%.
In the commodities market, West Texas Intermediate crude oil for
August fell 0.05% to $82.77 per barrel. Brent crude oil for
September rose 0.01%, close to $86.25 per barrel. The American
Petroleum Institute (API) reported that crude oil inventories fell
by 9.2 million barrels in the previous week.
The most-traded iron ore contract on the Dalian Commodity
Exchange (DCE) rose 2.55% to $118.79 per metric ton. Benchmark iron
ore for August SZZFQ4 on the Singapore Exchange rose 3.1% to
$113.35 per ton.
Wednesday’s U.S. economic indicator schedule begins at 8:15 AM
with the ADP employment report for June. At 8:30 AM, the Commerce
Department will release the May trade balance. At the same time,
8:30 AM, the Labor Department will report weekly jobless claims for
the week ending last Saturday.
At 9:45 AM, S&P Global will present the revised reading of
the June services sector Purchasing Managers’ Index (PMI). Factory
orders for May will be released at 10 AM by the Commerce
Department. Also at 10 AM, the ISM Services Index for June will be
published by the ISM. At 10:30 AM, the Department of Energy (DoE)
will reveal last week’s crude oil inventory status. Finally, at 2
PM, the Federal Reserve will release the minutes of the last
Federal Open Market Committee (FOMC) meeting.
Asia-Pacific markets mostly rose on Wednesday after a series of
regional data releases. Japan’s composite PMI fell to 49.7 in June
from 52.6 in May, indicating the first contraction in Japan’s
private sector in seven months. China’s Caixin services PMI
registered 51.2 in June, slowing from the previous month (54.0).
Additionally, Alibaba (NYSE:BABA) announced plans
to repurchase 613 million of its own shares for a total of $5.8
billion in the quarter ending in June.
Japan’s Nikkei 225 rose 1.26% to 40,580.76 points, while South
Korea’s Kospi advanced 0.47% to 2,794.01 points, and the Kosdaq
rose 0.75% to 836.1 points. Hong Kong’s Hang Seng climbed 1.14%,
driven by real estate stocks, while Australia’s S&P/ASX 200
closed up 0.28%. In India, the BSE Sensex and Nifty 50 reached new
all-time highs. Conversely, China’s Shanghai Composite Index fell
by 0.49%.
European stock markets are operating higher on Wednesday, with
the Stoxx 600 index led by technology stocks. Among individual
stocks, Maersk (TG:DP4B) shares are up 2.7% after withdrawing from
sales negotiations with DB Schenker. Investors are closely watching
the parliamentary elections in the United Kingdom, with
expectations of a victory for the Labour Party.
On Tuesday, U.S. stocks rose after an uncertain start. The Dow
Jones advanced 0.41%, and the Nasdaq gained 0.84%. The S&P 500
rose 0.62% to close above 5,500 points, its 32nd record this year.
Falling bond yields boosted gains despite concerns about interest
rates following Powell’s speech and the JOLTS report.
The Labor Department reported 8.140 million job openings in May,
an increase of 221,000 from the previous month. Redbook Research
showed a 5.8% increase in the Redbook Index for the week ending
June 29 compared to the same period last year. Powell mentioned
progress on inflation but stated the need for more evidence before
considering lowering interest rates. Among individual stocks,
Tesla (NASDAQ:TSLA) shares closed up 10% after
reporting higher-than-expected sales, AMD
(NASDAQ:AMD) rose 4.2%, while Nike (NYSE:NKE) and
Nvidia (NASDAQ:NVDA) ended lower.
On the earnings front, Constellation Brands
(NYSE:STZ) will report before the market opens.
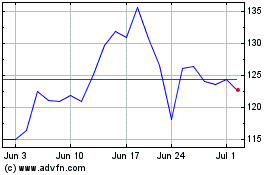
NVIDIA (NASDAQ:NVDA)
Historical Stock Chart
From Jun 2024 to Jul 2024

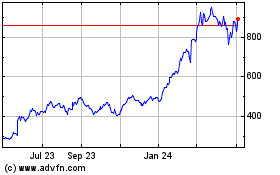
NVIDIA (NASDAQ:NVDA)
Historical Stock Chart
From Jul 2023 to Jul 2024
