TIDMVEIL
RNS Number : 9546M
Vietnam Enterprise Investments Ltd
17 January 2023
17 January 2023
Vietnam Enterprise Investments Limited
("VEIL" or "the Company")
Monthly Update
2.6% NAV Return in December 2022
VEIL is a closed-end fund investing primarily in listed equity
in Vietnam, and a FTSE 250 constituent. The Company's NAV
performance for December 2022 is set out in this notice.
Fund Performance
-- As of 31 December, VEIL's NAV increased 2.6% over the
previous month against a rise of 0.4% for its reference index, the
Vietnam Index ("VNI"), both in US dollar terms.
-- The Company's NAV per share was US$7.85 as of 31 December
(-35.7% YTD) and its total NAV was US$1.6bn.
-- VEIL's NAV per share performance in US dollar terms is -10.7%
over three months, -35.7% over one year and +16.1% over three
years. Over the same time periods, the performance of the Vietnam
Index was -9.7%,
-34.1% and +7.6%, respectively.
-- The share price rose 2.9% in December and has declined 32.3% YTD, both in US dollar terms
-- In GBP terms, the Company's NAV per share was GBP6.53 as of
31 December (1.7% for the month and -27.5% YTD) and its total NAV
was GBP1.3bn. The share price was up 1.9% for the month and down
23.8% YTD.
-- The share price discount to NAV as of 31 December was 10.7%,
compared with 10.9% at the end of November.
-- The Company repurchased 50,000 shares in December, compared
with no shares repurchased in November. In 2022, 3.2% of issued
shares as of 1 January 2022 were repurchased.
Dien Vu, the Portfolio Manager of VEIL commented:
"A solid December closed out a tumultuous year for the Vietnam
equity market, with VEIL outperforming its reference benchmark for
the month but trailing it for the year. This is just the second
time in the last ten years that the fund has underperformed the VNI
on an annual basis. On a three-year rolling basis, the time-period
in which the Company aims to outperform its reference benchmark,
the Company is ahead by 8.5%.
Foreign investors continued to be attracted by Vietnam's
decade-year low valuations, a second consecutive month of strong
inflows amounting to US$566m meant the final two months of the year
totalled US$1.2bn of the US$1.3bn that Vietnam attracted through
the whole of 2022. For contrast, 2021 saw net outflows of US$2.6bn
despite the market rising 39.0% for the year against a drop of
34.1% in 2022.
Eight out of the fund's top ten constituents outperformed the
market in December. Most notably among these were Vietnam
Prosperity Bank ("VPB") and Phu Nhuan Jewelry ("PNJ"), both
managing to deliver double-digit returns. FPT Corporation ("FPT")
also stood out with a solid return. On the downside, PetroVietnam
Gas ("GAS") and Vinhomes ("VHM") were the main laggards.
GAS fell out of favour with investors as global oil prices fell
in December, triggering concerns that 2023 earnings for the company
may decelerate as a result. Attitudes towards VHM soured as
investors were concerned about the risk of delays in property
handovers, which are forecast to have a significant impact on 4Q
2022 and full-year 2022 earnings. A clear slowdown in the property
sector due to a tighter liquidity environment has evidently had a
short-term impact on the stock.
VPB rose 11.2% in December due to investor expectations that the
hurdles needing to be cleared for a strategic investor to take a
position in the bank will be completed soon. If such a transaction
happens, it has the potential to turn VPB into one of the biggest
banks in Vietnam by charter capital.
Vietnam's economy registered a resounding 8.0% growth in 2022 -
the fastest in a decade - to reach US$409bn. With a population of
nearly 100mn this puts GDP per capita at US$4,110, officially
entering the upper middle-income group (above US$4,045).
Vietnam's macro environment was steady in 2022, with inflation
under control averaging 3.2% for the year (below the Government's
4.0% target) and the Vietnamese dong depreciating by just 3.2%
against the US dollar. Further bright spots included a record
US$22.4bn of disbursed FDI (+13.5% year-on-year), US$19bn of inward
remittances (+5.6% year-on-year) and a trade surplus of US$11.2bn,
compared to US$4.0bn in 2021.
Tourism and public investment have the potential to be among
Vietnam's strongest growth drivers in 2023. Chinese arrivals
accounted for 32% of the 18.5mn overseas tourists in 2019, and so
the country's reopening is expected to provide a welcome boost for
the sector, which saw just 3.7mn visitors in 2022. Furthermore, the
Government's budget for public investment is nearly US$30bn and
will go towards key infrastructure projects including airports and
motorways. These drivers, combined with increased manufacturing
from newly relocated FDI companies, should help contribute to
Vietnam achieving its 2023 GDP growth target of 6.0-6.5%.
Economic Overview
-- GDP growth in 2022 reached 8.0%, its highest level in over a
decade. Q4 2022 GDP growth was 5.9%, reflecting the global economic
slowdown.
-- The services sector was the main driver of GDP growth, with
year-on-year increases of 8.12% in Q4 and 10.0% for 2022. The
sector contributed 56.7% to overall GDP growth in 2022 with
accommodation & catering services leading the way, up 37.6% in
Q4 and +40.6% for 2022.
-- December's CPI rose 0.4% month-on-month and 4.4% year-on-year for 2022.
-- The Vietnamese dong appreciated 4.5% against the USD in
December, putting the total depreciation at 3.2% YTD as of 31
December. The Vietnamese dong appreciated 3.7% against the pound
sterling in December and its total appreciation was 7.8% YTD as of
31 December.
-- 2022 exports reached US$371.9bn and imports US$360.2bn,
making a trade surplus of US$11.2bn for the year, compared to a
surplus of U$4.0bn in 2021.
-- Trade did, however, slow down in December, with declines of
14.0% and 8.1% for exports and imports, respectively.
-- The Vietnam Purchasing Manager's Index was reported at 46.4,
a fifteen year low, and a second consecutive month below 50
following thirteen monthly expansions previously.
-- Disbursed FDI was US$2.7bn in December, with the total
year-to-date figure reaching US$22.4bn (+13.5% year-on-year).
Top Ten Holdings (66.3% of NAV)
    Company             Sector               VNI %  NAV %  Monthly Return  One-year
                                                                  %         Return %
    Vietnam Prosperity
1    Bank               Banks                 3.0   12.9        11.2         -27.6
    ==================  ===================  =====  =====  ==============  =========
    Asia Commercial
2    Bank               Banks                 1.8   12.1        3.4          -23.4
    ==================  ===================  =====  =====  ==============  =========
3   Mobile World Group  Retail                1.6    8.0        1.5          -38.6
    ==================  ===================  =====  =====  ==============  =========
4   Hoa Phat Group      Materials/Resources   2.6    6.3        2.1          -50.5
    ==================  ===================  =====  =====  ==============  =========
5   Vietcombank         Banks                 9.5    5.8        3.0          -1.9
    ==================  ===================  =====  =====  ==============  =========
6   FPT Corporation     Software/Services     2.1    4.7        7.5          -2.1
    ==================  ===================  =====  =====  ==============  =========
7   PetroVietnam Gas    Energy                4.9    4.4        -3.9          4.7
    ==================  ===================  =====  =====  ==============  =========
8   Becamex IDC         Real Estate           2.1    4.3        4.1          22.6
    ==================  ===================  =====  =====  ==============  =========
9   Vinhomes            Real Estate           5.2    4.3        -8.1         -41.8
    ==================  ===================  =====  =====  ==============  =========
10  Phu Nhuan Jewelry   Retail                0.6    3.5        10.2         22.6
    ==================  ===================  =====  =====  ==============  =========

    Vietnam, Index               -             -      -         0.4          -34.1
    ==================  ===================  =====  =====  ==============  =========
Source: Bloomberg, Dragon Capital
NB: All returns are given in USD terms
For further information, please contact:
Vietnam Enterprise Investments Limited
Rachel Hill
Phone: +44 122 561 8150
Mobile: +44 797 121 4852
rachelhill@dragoncapital.com
Jefferies International Limited
Stuart Klein
Phone: +44 207 029 8703
stuart.klein@jefferies.com
Buchanan
Charles Ryland / Henry Wilson / George Beale
Phone: +44 20 7466 5111
veil@buchanan.uk.com
LEI: 213800SYT3T4AGEVW864
This information is provided by RNS, the news service of the
London Stock Exchange. RNS is approved by the Financial Conduct
Authority to act as a Primary Information Provider in the United
Kingdom. Terms and conditions relating to the use and distribution
of this information may apply. For further information, please
contact rns@lseg.com or visit www.rns.com.
RNS may use your IP address to confirm compliance with the terms
and conditions, to analyse how you engage with the information
contained in this communication, and to share such analysis on an
anonymised basis with others as part of our commercial services.
For further information about how RNS and the London Stock Exchange
use the personal data you provide us, please see our Privacy
Policy.
END
NAVNKOBNQBKKPDD
(END) Dow Jones Newswires
January 17, 2023 02:00 ET (07:00 GMT)
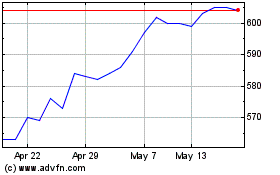
Vietnam Enterprise Inves... (LSE:VEIL)
Historical Stock Chart
From Feb 2025 to Mar 2025

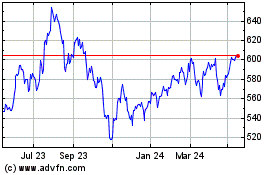
Vietnam Enterprise Inves... (LSE:VEIL)
Historical Stock Chart
From Mar 2024 to Mar 2025
