Consolidated statement of financial position as at 31 December
2014
                                            31/12/14       31/12/13
                                                 EUR            EUR
 Assets
 Non-current assets
 Exploration and evaluation assets       163,375,424    186,052,006
 Equity accounted investments             44,483,000     23,728,594
 Property, plant and equipment            10,831,903     10,514,451
 Other non-current assets                    833,045      3,407,821
 Financial assets                         42,534,544     37,432,083
 Other financial assets                    5,360,034              -
                                         267,417,950    261,134,955
                                       -------------  -------------

   Current assets
 Inventory                                   320,043        229,978
 Trade and other receivables              10,344,339     13,216,437
 Other financial assets                    1,335,361      6,274,202
 Cash and cash equivalents                 1,808,715     11,420,968
 Assets classified as held for
  sale                                             -     15,705,353
                                       -------------  -------------
                                          13,808,458     46,846,938
                                       -------------  -------------
 Total assets                            281,226,408    307,981,893
                                       -------------  -------------

   Equity and liabilities
 Equity
 Called up share capital                 126,778,633    126,560,947
 Share premium account                   164,099,598    164,232,712
 Share based payments reserve             11,424,904     10,213,497
 Currency translation reserve              (571,578)    (1,388,753)
 Fair value reserve                         (76,979)    (3,095,243)
 Retained earnings                      (50,868,681)   (12,604,325)
                                       -------------  -------------
 Attributable to equity holders
  of the Group                           250,785,897    283,918,835
 Non-controlling interest                      2,248        527,851
                                       -------------  -------------
 Total equity                            250,788,145    284,446,686
                                       -------------  -------------

 Non-current liabilities
 Derivative                                    4,017        208,434
 Deferred tax liabilities                 12,198,995      9,329,447
                                       -------------  -------------
                                          12,203,012      9,537,881
                                       -------------  -------------

 Current liabilities
 Trade and other payables                 10,963,732      6,228,211
 Loans and borrowings                      5,814,022              -
 Provisions                                1,457,497      1,397,094
 Liabilities classified as held
  for sale                                         -      6,372,021
                                       -------------  -------------
                                          18,235,251     13,997,326
                                       -------------  -------------

 Total liabilities                        30,438,263     23,535,207
                                       -------------  -------------
 Total equity and liabilities            281,226,408    307,981,893
                                       -------------  -------------
Consolidated statement of cash flows for the year ended 31
December 2014
                                                    31/12/14       31/12/13
                                                         EUR            EUR
 Cash flows from operating activities
 Loss before tax - Continuing operations        (37,419,057)   (13,681,662)
 Profit / (loss) before tax - Discontinued
  operations                                          30,258    (3,350,138)
 Adjustments for:
 Depletion and depreciation                          101,570        118,006
 Finance expense                                   1,796,659      1,587,240
 Finance income                                    (231,352)    (1,751,393)
 Share based payments charge                         249,064        639,954
 Foreign exchange                                (1,739,289)    (1,172,367)
 Gain on Talisman acquisition                              -    (4,229,277)
 Impairment of exploration and
  evaluation assets - continuing
  operations                                       9,149,836      7,036,679
 Impairment of equity accounted
  assets - continuing operations                   3,345,664      3,579,880
 Impairment of exploration and
  evaluation assets - discontinued
  operations                                               -      3,579,880
 Decrease / (increase) in other
  non-current assets                                 457,051    (1,116,161)
 Loss on disposal of subsidiaries                  6,429,007              -
 (Increase) / decrease in inventory                 (90,065)        360,233
 Decrease / (increase) in trade
  and other receivables                            2,398,785    (2,746,657)
 Increase / (decrease) in trade
  and other payables                               5,483,083    (2,766,513)
 Other non-current assets                          2,117,728              -
 Share of loss of equity-accounted
  investments                                         54,002        141,745
 Tax paid                                           (21,031)       (31,122)
 Net cash flows in operating activities          (7,888,087)   (17,381,553)
                                               -------------  -------------

   Cash flows from investing activities
 Expenditure on exploration and
  evaluation assets                             (19,909,050)   (31,250,052)
 Joint venture partner share of
  exploration costs                                  363,293      4,045,909
 Purchases of property, plant and
  equipment                                      (1,701,433)    (1,854,578)
 Interest received                                     3,515         36,699
 Decrease / (increase) in restricted
  cash                                               325,354    (5,517,332)
 Advances to equity-accounted investments        (1,054,618)    (1,631,488)
 Proceeds of farm-out arrangement                 14,806,537              -
 Proceeds of offshore Morocco farm-out                     -      1,210,217
 Net cash acquired with subsidiary                         -     31,897,712
 Cash acquired with asset acquisition                      -      3,949,107
 Payment to acquire financial assets                       -    (1,329,349)
 Net cash outflow from investing
  activities                                     (7,166,402)      (443,155)
                                               -------------  -------------

   Cash flows from financing activities
 Proceeds from issue of share capital,
  net of costs                                             -     35,769,754
 Cost of issue of shares in 2013                   (473,715)
 Proceeds from drawdown of other
  loans                                            8,415,037      2,612,315
 Repayment of other loans                        (3,070,671)    (9,258,223)
 Movement in director loan                         2,201,471      (859,373)
 Interest and arrangement fees
  paid                                           (1,641,403)      (881,298)
 Net cash inflow from financing
  activities                                       5,430,719     27,383,175
                                               -------------  -------------

   Net (decrease) / increase in cash
   and cash equivalents                          (9,623,770)      9,558,467
 Effect of foreign exchange fluctuation
  on cash and cash equivalents                        11,517         37,702
 Cash and cash equivalents at start
  of year                                         11,420,968      1,824,799
                                               -------------  -------------

   Cash and cash equivalents at end
   of year                                         1,808,715     11,420,968
                                               -------------  -------------
General
San Leon Energy plc ("the Company") is a company incorporated in
Ireland. The Group financial statements consolidate those of the
Company with those of its subsidiaries (together referred to as
"the Group").
The financial information presented in this report has been
prepared using accounting policies consistent with International
Financial Reporting Standards ("IFRS") as adopted by the European
Union and as set out in the Group's annual financial statements in
respect of the year ended 31 December 2014. The financial
information herein does not include all the information and
disclosures required in the annual financial statements, however
the full financial statements are included within the Annual Report
which are being distributed to shareholders and which are available
on the Company's website www.sanleonenergy.com. It will also be
filed with the Company's Annual Return in the Companies
Registration Office. The financial information herein for the prior
year ended 31 December 2013 represents an abbreviated version of
the Group's statutory financial statements and the financial
statements for the year ended 31 December 2013 have been filed with
the Companies Registration Office.
Annual Report and Accounts
Copies of the Annual Report and Accounts, together with a notice
of the annual general meeting, are being posted to shareholders
today and are available within the Investor Relations section of
the Company's website www.sanleonenergy.com
This information is provided by RNS
The company news service from the London Stock Exchange
END
FR PKCDBDBKBPAB
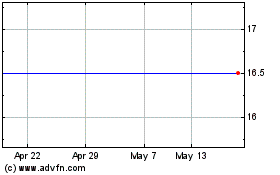
San Leon Energy (LSE:SLE)
Historical Stock Chart
From Jun 2024 to Jul 2024

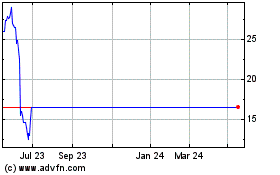
San Leon Energy (LSE:SLE)
Historical Stock Chart
From Jul 2023 to Jul 2024
