Keller Group PLC Full Year Results -6-
March 03 2014 - 2:01AM
UK Regulatory
  interest                -         -            -             -         -         -          -              -               1.7      1.7
 Acquisition of
  non-controlling
  interest                -         -            -             -         -         -          -              -             (0.2)    (0.2)
-----------------  --------  --------  -----------  ------------  --------  --------  ---------  -------------  ----------------  -------
 At 31 December
  2012
  and 1 January
  2013                  6.6      38.1          7.6          36.6         -         -      236.7          325.6              10.1    335.7
 Profit for the
  period                  -         -            -             -         -         -       29.3           29.3               0.8     30.1
-----------------  --------  --------  -----------  ------------  --------  --------  ---------  -------------  ----------------  -------

 Other
 comprehensive
 income
 Exchange
  differences
  on translation
  of foreign
  operations              -         -            -        (23.6)         -         -          -         (23.6)             (0.3)   (23.9)
 Net investment
  hedge
  losses                  -         -            -         (3.0)         -         -          -          (3.0)                 -    (3.0)
 Cash flow hedge
  gains
  taken to equity         -         -            -             -         -       1.8          -            1.8                 -      1.8
 Cash flow hedge
  transfers
  to income
  statement               -         -            -             -         -     (1.8)          -          (1.8)                 -    (1.8)
 Remeasurements
  of defined
  benefit pension
  schemes                 -         -            -             -         -         -      (5.7)          (5.7)                 -    (5.7)
 Tax on
  remeasurements
  of defined
  benefit
  pension schemes         -         -            -             -         -         -        1.1            1.1                 -      1.1
-----------------  --------  --------  -----------  ------------  --------  --------  ---------  -------------  ----------------  -------
 Other
  comprehensive
  income for the
  period,
  net of tax              -         -            -        (26.6)         -         -      (4.6)         (31.2)             (0.3)   (31.5)
-----------------  --------  --------  -----------  ------------  --------  --------  ---------  -------------  ----------------  -------

 Total
  comprehensive
  income for the
  period                  -         -            -        (26.6)         -         -       24.7          (1.9)               0.5    (1.4)
 Dividends                -         -            -             -         -         -     (15.4)         (15.4)             (0.2)   (15.6)
 Share-based
  payments                -         -            -             -         -         -        1.9            1.9                 -      1.9
 Share capital
  issued                0.7         -            -             -      56.9         -          -           57.6                 -     57.6
 Acquisition of
  non-controlling
  interest                -         -            -             -         -         -          -              -             (5.6)    (5.6)
 At 31 December
  2013                  7.3      38.1          7.6          10.0      56.9         -      247.9          367.8               4.8    372.6
-----------------  --------  --------  -----------  ------------  --------  --------  ---------  -------------  ----------------  -------
Consolidated cash flow statement
For the year ended 31 December 2013
                                                            2013     2012
                                                            GBPm     GBPm
------------------------------------------------------  --------  -------

 Cash flows from operating activities
 Operating profit before exceptional items                  77.8     48.3
 Depreciation of property, plant and equipment              45.0     42.1
 Amortisation of intangible assets                           1.4      1.5
 (Profit)/loss on sale of property, plant and
  equipment                                                (0.3)      0.8
 Other non-cash movements                                    7.1      2.5
 Foreign exchange losses                                       -    (1.0)
------------------------------------------------------  --------  -------
 Operating cash flows before movements in working
  capital                                                  131.0     94.2
 Increase in inventories                                  (22.5)    (5.2)
 Increase in trade and other receivables                  (37.4)   (21.3)
 Increase in trade and other payables                       65.5     44.2
 Change in provisions, retirement benefit and
  other non-current liabilities                            (4.6)    (3.5)
------------------------------------------------------  --------  -------
 Cash generated from operations                            132.0    108.4
 Interest paid                                             (5.4)    (4.6)
 Income tax paid                                          (21.5)   (10.7)
------------------------------------------------------  --------  -------
 Net cash inflow from operating activities                 105.1     93.1
------------------------------------------------------  --------  -------

 Cash flows from investing activities
 Interest received                                           0.4      0.5
 Proceeds from sale of property, plant and equipment         3.6      1.9
 Acquisition of subsidiaries, net of cash acquired       (200.4)        -
 Acquisition of property, plant and equipment             (44.8)   (33.7)
 Acquisition of intangible assets                          (1.4)    (0.9)
 Net cash outflow from investing activities              (242.6)   (32.2)
------------------------------------------------------  --------  -------

 Cash flows from financing activities
 Proceeds from the issue of share capital                   57.6        -
 Capital contribution from non-controlling interest            -      1.7
 New borrowings                                            118.5     20.5
 Repayment of borrowings                                  (24.2)   (60.0)
 Payment of finance lease liabilities                      (0.7)    (0.7)
 Dividends paid                                           (15.6)   (15.4)
------------------------------------------------------  --------  -------
 Net cash inflow/(outflow) from financing activities       135.6   (53.9)
------------------------------------------------------  --------  -------

 Net (decrease)/increase in cash and cash equivalents      (1.9)      7.0
 Cash and cash equivalents at beginning of period           54.8     43.3
 Effect of exchange rate fluctuations                      (2.2)      4.5
------------------------------------------------------  --------  -------
 Cash and cash equivalents at end of period                 50.7     54.8
------------------------------------------------------  --------  -------

   1.     Basis of preparation
The Group's 2013 results have been prepared in accordance with
International Financial Reporting Standards ('IFRS') as adopted by
the EU.
The same accounting policies and presentation are followed in
the financial statements that were applied in the preparation of
the Company's published consolidated financial statements for the
year ended 31 December 2012, except for:
-- the adoption of amendments to IAS 19, 'Employee benefits'.
There is no material change as a result of adopting the amendments
to IAS 19. The financial impact of adopting this standard has been
reflected in the current period statement of comprehensive income.
The comparative period has therefore not been restated to reflect
the financial impact of adopting this standard but the comparative
period finance income and finance costs have been reclassified in
the income statement to net the expected return on pension scheme
assets and pension interest cost into a single net pension interest
cost line.
-- the adoption of amendments to IAS 1, 'Financial statement
presentation' which requires items within Other Comprehensive
Income to be classified as whether they may be reclassified
subsequently to profit or loss or not.
There were no other new standards, interpretations or amendments
to standards issued and effective for the year which materially
impacted the Group's financial statements.
The financial information set out above does not constitute the
Company's statutory accounts for the years ended 31 December 2013
or 2012 but is derived from the 2013 accounts. Statutory accounts
for 2012 have been delivered to the Registrar of Companies. Those
for 2013, prepared under IFRS as adopted by the EU, will be
delivered to the Registrar of Companies and made available on the
Company's website at www.keller.co.uk in April 2014. The auditors
have reported on those accounts; their reports were (i)
unqualified, (ii) did not include references to any matters to
which the auditors drew attention by way of emphasis without
qualifying their reports and (iii) did not contain statements under
section 498(2) or (3) of the Companies Act 2006.
2. Foreign currencies
The exchange rates used in respect of principal currencies
are:
                       Average for     Period end
                          period
-------------------  --------------  -------------
                       2013    2012    2013   2012
-------------------  ------  ------  ------  -----
 US dollar             1.56    1.58    1.65   1.62
 Canadian dollar       1.61    1.58    1.76   1.60
 Euro                  1.18    1.23    1.20   1.22
 Singapore dollar      1.96    1.98    2.09   1.98
 Australian dollar     1.62    1.53    1.86   1.56
-------------------  ------  ------  ------  -----

   3.     Segmental analysis
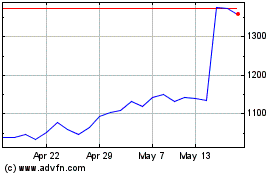
Keller (LSE:KLR)
Historical Stock Chart
From Jun 2024 to Jul 2024

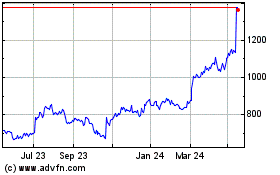
Keller (LSE:KLR)
Historical Stock Chart
From Jul 2023 to Jul 2024
