TIDMDPEU
RNS Number : 8249M
DP Eurasia N.V
26 January 2021
For Immediate Release 26 January 2021
DP Eurasia N.V.
("DP Eurasia" or the "Company", and together with its
subsidiaries, the " Group ")
Trading Update for the Year Ended 31 December 2020
Continued growth in online channels drives robust
performance
                                  For the year ended 31
                                         December
                            ---------------------------------
                                2020              2019           Change
                            ------------  -------------------  ---------
                                   (in millions of TRY,
                                unless otherwise indicated)

 Number of stores                771           765            6

 Group system sales (1)
 Turkey                        1,069.1        845.7         26.4%
 Russia                         471.6         503.3         -6.3%
 Azerbaijan & Georgia           29.2           21.2         37.9%
 Total                         1,569.9       1,370.3        14.6%

 Group system sales like-for-like
  growth(2)
 Group(5)                       17.4%         10.7%
 Turkey                         26.0%         13.1%
 Russia (based on RUB)         -12.6%          0.7%
Highlights
-- Group system sales increased 14.6%, despite Covid-19 related
operational constraints and increased competition in Russia due to
aggregators
o Turkish systems sales growth of 26.4%
o Russian system sales decrease of 6.3% (15.3% based on RUB)
-- Group online system sales(4) growth of 40.3%
o Turkish online system sales growth of 55.2%
o Russian online system sales growth of 20.3% (8.8% based on
RUB)
-- Online delivery system sales(3) as a share of delivery system
sales surpassed 75% (2019: 70%), reflecting our strong online
offering and positioning
-- Strong liquidity position - TRY 128 million of cash on hand
and additional available bank lines of TRY 142 million as at 31
December 2020
-- Robust franchisee demand in Turkey more than offset the store
closures in Turkey and Russia due to Covid-19 - 33 new store
openings vs. 27 store closures in 2020
Commenting on the update, Chief Executive Officer, Aslan Saranga
said:
"The strong trading environment continued in Turkey through the
last two months of the year. Despite ongoing operational
constraints, such as weekend and nightly curfews that were put in
place from the middle of November, our Turkish operations have
maintained a high like-for-like growth rate of 38.6% in
November/December. This was in part driven by the tailwinds from a
temporary reduction in the VAT rate to 1% from 8%, which the
government extended until 1 June 2021. However, there has also been
a Covid-19 inspired shift to home delivery across all consumer
sectors, which has brought us new customers. Provided that we give
a good service and provide an appealing product, we hope to grow
customer loyalty in a post Covid-19 market.
"The recovery in Russia has also been continuing where our
November/December like-for-like growth rate has been -1.9%, in line
with our October performance. Television advertising is highly
regionalised in Russia and our recently launched new and improved
pizza enjoyed a targeted television campaign in Greater Moscow that
has been effective in driving delivery sales; however, our take
away/eat in channel has been lagging in its recovery so far due to
ongoing Covid-19 restrictions.
"The strong trading in Turkey has resulted in very encouraging
interest from both existing and new franchisees. In 2020, we
successfully opened 33 new stores in total, more than offsetting
the 27 Covid-19 related store closures across Turkey and
Russia.
"In 2020, we also reached important milestones in our digital
delivery system sales in both Turkey and Russia as well as at the
Group level. Our Turkish and Russian operations have reached 75%
and 90%, respectively, in digital delivery sales as a percentage of
total delivery sales, signifying improvements of six and eight
percentage points from 2019, respectively. At the Group level 75%
of our delivery system sales originated from digital channels.
"As previously announced, the Board is considering an additional
listing on a major stock exchange to complement its current listing
on the Main Market of the London Stock Exchange. Upon its initial
review, the Board has taken the decision to further investigate the
dual listing of DP Eurasia at the Borsa Istanbul and will provide a
further update in due course.
"Whilst the Board is conscious of the risks posed by the
on-going uncertainty due to the pandemic, these trading results
give us confidence regarding our market positioning and the
prospects for our business in the long term."
Enquiries
 DP Eurasia N.V.
 Selim Kender, Chief Strategy Officer &
  Head of Investor Relations                 +90 212 280 9636

 Buchanan (Financial Communications)
 Richard Oldworth / Giles Stewart / Tilly    +44 20 7466 5000
  Abraham                                     dp@buchanan.uk.com
A conference call for investors and analysts will be held at
9.00am this morning, which will be accessible using the following
details:
 Conference call:   UK Toll Free: 08003589473
                    UK Toll: 03333000804
                    Participant PIN code: 27680520#
                    URL for international dial in numbers:
                    http://events.arkadin.com/ev/docs/NE_W2_TF_Events_International_Access_List.pdf
A recording of the conference call will subsequently be
available at www.dpeurasia.com .
Notes to Editors
DP Eurasia N.V. is the exclusive master franchisee of the
Domino's Pizza brand in Turkey, Russia, Azerbaijan and Georgia. The
Company was admitted to the premium listing segment of the Official
List of the Financial Conduct Authority and to trading on the main
market for listed securities of the London Stock Exchange plc on 3
July 2017. The Company (together with its subsidiaries, the " Group
" ) is the largest pizza delivery company in Turkey and the third
largest in Russia. The Group offers pizza delivery and takeaway/
eat-in facilities at its 771 stores (568 in Turkey, 190 in Russia,
nine in Azerbaijan and four in Georgia as at 31 December 2020), and
operates through its owned corporate stores (29%) and franchised
stores (71%). The Group maintains a strategic balance between
corporate and franchised stores, establishing networks of corporate
stores in its most densely populated areas to provide a development
platform upon which to promote best practice and maximise
profitability. The Group has adapted the Domino's Pizza globally
proven business model to its local markets.
Performance Review
 Store count                                  As at 31 December
               ------------------------------------------------------------------------------
                              2020                                       2019
                Corporate   Franchised    Total           Corporate   Franchised      Total
 Turkey            106         462         568               123         427           550
 Russia            115          75         190               121          82           203
 Azerbaijan         -           9           9                 -           8             8
 Georgia            -           4           4                 -           4             4
 Total             221         550         771               244         521           765
Delivery channel mix and online like-for-like growth
The following table shows the Group's delivery system sales (3)
, broken down by ordering channel and by the Group's two largest
countries in which it operates, as a percentage of delivery system
sales for the periods ended 31 December 2020 and 2019:
                                           For the year ended 31 December
                                 --------------------------------------------------
                                           2020                      2019
                                 ------------------------  ------------------------
                                  Turkey   Russia   Total   Turkey   Russia   Total
 Store                            28.5%    10.3%    23.9%   32.0%    18.0%    27.8%
                Group's online
 Online             platform      25.9%    71.4%    40.0%   28.5%    80.5%    47.0%
           Aggregator             44.3%    18.3%    35.3%   35.7%     1.5%    22.8%
          Total online            70.2%    89.7%    75.3%   64.2%    82.0%    69.9%
 Call centre                       1.3%      -      0.9%     3.8%      -      2.1%
 Total                             100%     100%    100%     100%     100%    100%
The following table shows the Group's online like-for-like
growth (2) , broken down by the Group's two largest countries in
which it operates, for the periods ended 31 December 2020 and
2019:
                                             For the year ended 31
                                                    December
                                           ------------------------
                                               2020         2019
                                           -----------  -----------
 Group online system sales like-for-like
  growth(2)
 Group(5)                                     45.2%        29.0%
 Turkey                                       54.4%        32.6%
 Russia (based on RUB)                        13.1%        15.4%
Liquidity
The Group continues to have a strong liquidity position, having
access to cash on hand and additional borrowing capacity available
from its Turkish banks. As at 31 December 2020, the Group had TRY
128 million of cash on hand and additional available bank lines of
TRY 142 million.
The Group's strong liquidity position enables it to prepay its
bank borrowings in Russia if required, and still maintain a strong
liquidity position. The Group obtained a waiver from Sberbank with
respect to its covenants for the first and second quarters of 2021
and is in negotiations to reset the covenants or repay the
remaining loan. The principal outstanding under the Sberbank loan
currently amounts to RUB 1.0 billion, of which RUB 0.2 billion is
supported by a cash collateral deposit.
Notes
(1) System sales are sales generated by the Group's corporate
and franchised stores to external customers and do not represent
revenue of the Group.
(2) Like-for-like growth is a comparison of sales between two
periods that compares system sales of existing system stores. The
Group's system stores that are included in like-for-like system
sales comparisons are those the Group considers to be mature
operations. The Group considers mature stores to be those stores
that have operated for at least 52 weeks preceding the beginning of
the first month of the period used in the like-for-like comparisons
for a certain reporting period, assuming the relevant system store
has not subsequently closed or been "split" (which involves the
Group opening an additional store within the same map of an
existing store or in an overlapping area).
(3) Delivery system sales are system sales of the Group
generated through the Group's delivery distribution channel.
(4) Online system sales are system sales of the Group generated
through its online ordering channel.
(5) Group like-for-like growth is a weighted average of the
country like-for-like growths based on store numbers as described
in Note (2).
Appendices
Exchange Rates
                          For the year ended 31 December
            ----------------------------------------------------------
                        2020                          2019
            ----------------------------  ----------------------------
 Currency    Period End   Period Average   Period End   Period Average
            -----------  ---------------  -----------  ---------------
 EUR/TRY       9.008          8.014          6.651          6.348
 RUB/TRY       0.098          0.096          0.096          0.087
 EUR/RUB       90.682         82.408         69.341         72.513
Delivery - Take away / Eat in mix
                             For the year ended 31 December
                   --------------------------------------------------
                             2020                      2019
                   ------------------------  ------------------------
                    Turkey   Russia   Total   Turkey   Russia   Total
 Delivery           72.5%    77.7%    74.0%   63.8%    62.2%    63.1%
 Take away / Eat
  in                27.5%    22.3%    26.0%   36.2%    37.8%    36.9%
 Total(2)            100%     100%    100%     100%     100%    100%
Forward looking statements
This press release includes forward-looking statements which
involve known and unknown risks and uncertainties, many of which
are beyond the Group's control and all of which are based on the
Directors' current beliefs and expectations about future events.
They appear in a number of places throughout this press release and
include all matters that are not historical facts and include
predictions, statements regarding the intentions, beliefs or
current expectations of the Directors or the Group concerning,
among other things, the results of operations, financial condition,
prospects, growth and strategies of the Group and the industry in
which it operates.
No assurance can be given that such future results will be
achieved; actual events or results may differ materially as a
result of risks and uncertainties facing the Group. Such risks and
uncertainties could cause actual results to vary materially from
the future results indicated, expressed, or implied in such
forward-looking statements.
Forward-looking statements contained in this press release speak
only as of the date of this press release. The Company and the
Directors expressly disclaim any obligation or undertaking to
update these forward-looking statements contained in this press
release to reflect any change in their expectations or any change
in events, conditions, or circumstances on which such statements
are based.
This information is provided by RNS, the news service of the
London Stock Exchange. RNS is approved by the Financial Conduct
Authority to act as a Primary Information Provider in the United
Kingdom. Terms and conditions relating to the use and distribution
of this information may apply. For further information, please
contact rns@lseg.com or visit www.rns.com.
RNS may use your IP address to confirm compliance with the terms
and conditions, to analyse how you engage with the information
contained in this communication, and to share such analysis on an
anonymised basis with others as part of our commercial services.
For further information about how RNS and the London Stock Exchange
use the personal data you provide us, please see our Privacy
Policy.
END
TSTSEEFWIEFSEEF
(END) Dow Jones Newswires
January 26, 2021 02:00 ET (07:00 GMT)
Dp Eurasia N.v (LSE:DPEU)
Historical Stock Chart
From Jul 2024 to Jul 2024

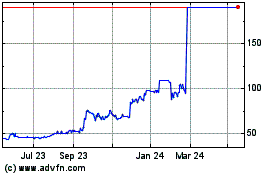
Dp Eurasia N.v (LSE:DPEU)
Historical Stock Chart
From Jul 2023 to Jul 2024
