Definitive Materials Filed by Investment Companies. (497)
June 28 2013 - 9:03AM
Edgar (US Regulatory)
Effective immediately, the sub-sections entitled “Compensation,” “Ownership of Fund Shares,” and “Other Accounts” in Appendix C entitled “Portfolio Manager(s)” are hereby restated in their entirety as follows:
Compensation
Portfolio manager compensation is reviewed annually. As of December 31, 2012, portfolio manager total cash compensation is a combination of base salary and performance bonus:
Base Salary
– Base salary represents a smaller percentage of portfolio manager total cash compensation than performance bonus.
Performance Bonus
– Generally, the performance bonus represents more than a majority of portfolio manager total cash compensation.
The performance bonus is based on a combination of quantitative and qualitative factors, generally with more weight given to the former and less weight given to the latter.
The quantitative portion is based on the pre-tax
performance of assets managed by the portfolio manager over one-, three-, and five-year periods relative to peer group universes and/or indices (“benchmarks”). As of December 31, 2012, the following benchmarks were used to measure the following portfolio managers' performance for the following Fund:
|
Fund
|
Portfolio Manager
|
Benchmark(s)
|
|
MFS Total Return Fund
|
Brooks A. Taylor
|
Russell 1000 Value Index
Lipper Large-Cap Value Funds
|
|
Nevin P. Chitkara
|
Russell 1000 Value Index
Lipper Large-Cap Value Funds
Lipper Large-Cap Core Funds
|
|
William P. Douglas
|
Barclays U.S. Mortgage-Backed Securities Index
|
|
Steven R. Gorham
|
Russell 1000 Value Index
Lipper Large-Cap Value Funds
Lipper Large-Cap Core Funds
|
|
Richard O. Hawkins
|
Barclays U.S. Aggregate Bond Index
|
|
Joshua P. Marston
|
Barclays U.S. Aggregate Bond Index
|
As of December 31, 2012, no benchmarks were used to measure the performance of Jonathan W. Sage for the Fund because the portfolio manager wasn't a portfolio manager of the Fund at that time.
Additional or different benchmarks, including versions of indices, custom indices, and linked indices that include performance of different indices for different portions of the time period, may also be used. Primary weight is given to portfolio performance over a three-year time period with lesser consideration given to portfolio performance over one- and five-year periods (adjusted as appropriate if the portfolio manager has served for less than five years).
The qualitative portion is based on the results of an annual internal peer review process (conducted by other portfolio managers, analysts, and traders) and management’s assessment of overall portfolio manager contributions to investor relations and the investment process (distinct from fund and other account performance). This performance bonus may be in the form of cash and/or a deferred cash award, at the discretion of management. A deferred cash award is issued for a cash value and becomes payable over a three-year vesting period if the portfolio manager remains in the continuous employ of MFS or its affiliates. During the vesting period, the value of the unfunded deferred cash award will fluctuate as though the portfolio manager had invested the cash value of the award in an MFS Fund(s) selected by the portfolio manager. A selected fund may be, but is not required to be, a fund that is managed by the portfolio manager.
Portfolio managers also typically benefit from the opportunity to participate in the MFS Equity Plan. Equity interests and/or options to acquire equity interests in MFS or its parent company are awarded by management, on a discretionary basis, taking into account tenure at MFS, contribution to the investment process, and other factors.
Finally, portfolio managers also participate in benefit plans (including a defined contribution plan and health and other insurance plans) and programs available generally to other employees of MFS. The percentage such benefits represent of any portfolio manager’s compensation depends upon the length of the individual’s tenure at MFS and salary level, as well as other factors.
223062
1
MTR-PM-SAI-SUP-062813
The following table shows the dollar range of equity securities of the Fund beneficially owned by the Fund’s portfolio manager(s) as of the Fund’s fiscal year ended September 30, 2012. The following dollar ranges apply:
N. None
A. $1 – $10,000
B. $10,001 – $50,000
C. $50,001 – $100,000
D. $100,001 – $500,000
E. $500,001 – $1,000,000
F. Over $1,000,000
|
Name of Portfolio Manager
|
Dollar Range of Equity Securities in Fund
|
|
Brooks A. Taylor
|
D
|
|
Nevin P. Chitkara
|
N
|
|
William P. Douglas
|
C
|
|
Steven R. Gorham
|
F
|
|
Richard O. Hawkins
|
D
|
|
Joshua P. Marston
|
N
|
|
Jonathan W. Sage
|
C*
|
|
|
* Information is as of May 1, 2013. The portfolio manager was added to the Fund as of April 30, 2013.
|
Other Accounts
In addition to the Fund, the Fund’s portfolio manager is named as a portfolio manager of certain other accounts managed or subadvised by MFS or an affiliate, the number and assets of which, as of the Fund's fiscal year ended September 30, 2012, were as follows:
|
|
Registered Investment Companies*
|
Other Pooled Investment Vehicles
|
Other Accounts
|
|
Name
|
Number of Accounts
|
Total
Assets
|
Number of Accounts
|
Total Assets
|
Number of Accounts
|
Total Assets
|
|
Brooks A. Taylor
|
7
|
$13.1 billion
|
0
|
N/A
|
0
|
N/A
|
|
Nevin P. Chitkara
|
20
|
$44.7 billion
|
6
|
$2.9 billion
|
37
|
$12.3 billion
|
|
William P. Douglas
|
6
|
$12.1 billion
|
0
|
N/A
|
0
|
N/A
|
|
Steven R. Gorham
|
19
|
$44.7 billion
|
5
|
$2.9 billion
|
37
|
$12.3 billion
|
|
Richard O. Hawkins
|
12
|
$18.4 billion
|
1
|
$1.1 billion
|
5
|
$657.2 million
|
|
Joshua P. Marston
|
8
|
$16.5 billion
|
9
|
$2.9 billion
|
4
|
$639.0 million
|
|
Jonathan W. Sage^
|
10
|
$14.8 billion
|
3
|
$352.5 million
|
18
|
$5.2 billion
|
* Includes the Fund.
|
|
^ Information is as of May 1, 2013. The portfolio manager was added to the Fund as of April 30, 2013.
|
Advisory fees are not based upon performance of any of the accounts identified in the table above.
223062
2
MTR-PM-SAI-SUP-062813
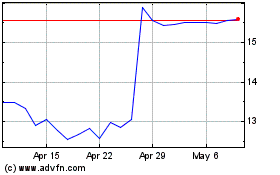
Silica (NYSE:SLCA)
Historical Stock Chart
From Jun 2024 to Jul 2024

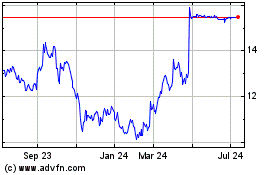
Silica (NYSE:SLCA)
Historical Stock Chart
From Jul 2023 to Jul 2024
