GOVERNANCE AND RELATED MATTERS
management meet as needed with external advisors to discuss risks applicable to the Company and obtains perspectives that inform the Board of Directors’ and senior management’s decisions with respect to risk oversight. The Board of Directors also receives regular reports from senior management, including the Company’s Chief Executive Officer, Chief Financial Officer, Chief Operating Officer, General Counsel, Chief Compliance Officer, Chief Information Security Officer and others regarding financial, operational, cyber, regulatory, sustainability, legal and strategic risks and mitigation strategies for such risks.
The Board of Directors believes that this division of responsibilities is the most effective approach for addressing the risks facing the Company and that the Board’s leadership structure supports this approach.
How Can Shareholders and Other Interested Parties Communicate with the Board of Directors?
Anyone who has a concern about Pediatrix’s conduct, including accounting, internal controls or audit matters, may communicate directly with our Chair of the Board of Directors, our non-management Directors, the Chair of the Audit Committee or the Audit Committee. In addition, at the request of the Board of Directors, communications that do not directly relate to our Board’s duties and responsibilities as directors will be excluded from distribution. Such excluded items include, among others, “spam;” advertisements, mass mailings, form letters, and email campaigns that involve unduly large numbers of similar communications; solicitations for goods, services, employment or contributions; and surveys. Any excluded communication will be made available to any Director upon request. Such communications may be confidential or anonymous and may be submitted in writing to the Chief Compliance Officer, Pediatrix Medical Group, Inc., 1301 Concord Terrace, Sunrise, Florida 33323, or reported by phone at 877-835-5764. Any such concerns will be forwarded to the appropriate Directors for their review and will be simultaneously reviewed and addressed by the Company’s General Counsel or Chief Compliance Officer in the same way that other concerns are addressed. Pediatrix’s Code of Conduct, which is discussed below, prohibits any employee from retaliating or taking any adverse action against anyone who in good faith raises or assists in the resolution of an integrity concern.
Has Pediatrix Adopted a Code of Conduct?
Pediatrix has adopted a Code of Conduct that applies to all Directors, officers, employees and independent contractors of Pediatrix and its subsidiaries, professional corporations, partnerships, associations and other affiliated entities. Pediatrix intends to disclose any amendments to, or waivers from, any provision of the Code of Conduct that applies to any of Pediatrix’s executive officers or Directors by posting such information on its website at www.Pediatrix.com.
Pediatrix has also adopted a Code of Professional Conduct — Finance that applies to all employees with access to, and responsibility for, matters of finance and financial management, including Pediatrix’s Chief Executive Officer, Chief Financial Officer, Chief Operating Officer and Chief Accounting Officer. Pediatrix intends to disclose any amendments to, or waivers from, any provision of the Code of Professional Conduct — Finance that applies to any of Pediatrix’s Chief Executive Officer, Chief Financial Officer, Chief Operating Officer and Chief Accounting Officer or persons performing similar functions by posting such information on its website at www.Pediatrix.com.
Copies of our Code of Conduct and the Code of Professional Conduct — Finance are available on our website at www.Pediatrix.com and upon request from Pediatrix’s Secretary at 1301 Concord Terrace, Sunrise, Florida 33323.
Has Pediatrix Adopted a Clawback Policy?
Pediatrix has adopted a Clawback Policy that permits the Company to seek to recover certain amounts of incentive compensation, including both cash and equity, paid to any executive officer (as
|
|
|
|
|
| Pediatrix Medical Group, Inc. |
|
10 |
|
2023 Proxy Statement |
EXECUTIVE COMPENSATION: COMPENSATION DISCUSSION AND ANALYSIS (“CD&A”)
termination date, which amount would equal approximately $61,000 in the aggregate, (d) within 60 days of the termination date and on the first anniversary of the termination date, pay Mr. Ordan an amount equal to the greater of (i) his “average annual performance bonus” or (ii) his target performance bonus amount, which amount would equal approximately $3.8 million in the aggregate, and (e) pay Mr. Ordan a pro rata portion of his target bonus amount he would have received for the year in which his employment terminates (in connection with his separation, Mr. Ordan voluntarily declined his earned cash bonus, and the Compensation and Talent Committee accepted this voluntary forfeiture).
Pursuant to Mr. Andreano’s Employment Agreement, if the Company terminated the employment of Mr. Andreano without Cause (which occurred effective October 15, 2022), then the Company will (a) pay his base salary through the termination date plus any reimbursement owed to him for any reasonable business expenses, as well as any other accrued employee benefits, incurred through the date of termination, (b) continue to pay Mr. Andreano’s base salary and health, medical, hospitalization and other similar health insurance costs for a period of 24 months after the termination date, which amount would equal approximately $1.1 million in the aggregate, (c) pay Mr. Andreano an amount equal to the greater of 1.5 times his “average annual performance bonus” or 1.5 times his target bonus amount, which amount would equal approximately $0.8 million, and (d) pay Mr. Andreano a pro rata portion of the target bonus he would have received for the year in which his employment terminates, which amount would equal approximately $0.4 million.
In connection with his termination without Cause effective as of October 15, 2022, the Company and Mr. Andreano entered into a Separation Agreement pursuant to which the parties agreed that Mr. Andreano would be provided with the severance payments and benefits due to him following a termination of employment without Cause under his Employment Agreement, except that (i) his equity awards would continue to be subject to the terms and conditions of the applicable award agreements and 2008 Plan (as defined in the Employment Agreement), including continued vesting for any continuous service as a consultant and (ii) the Company would pay Mr. Andreano a residual bonus in the gross amount of $15,086.57 no later than March 15, 2023.
If the Company terminates the employment of Mr. Richards, Ms. Moore or Dr. Swift without Cause or if the executive terminates his or her employment for Good Reason (each as defined in the executive’s Employment Agreement), then the Company will (a) pay that executive’s base salary through the termination date plus any reimbursement owed to that executive for any reasonable business expenses, as well as any other accrued employee benefits, incurred through the date of termination, (b) continue to pay the executive’s base salary and health, medical, hospitalization and other similar health insurance costs for a period of 24 months after the termination date, (c) pay the executive an amount equal to the greater of 1.5 times his or her “average annual performance bonus” or 1.5 times his or her target bonus amount, and (d) pay the executive a pro rata portion of the target bonus he would have received for the year in which his employment terminates.
Termination by Executive. Each of Mr. Richards, Ms. Moore and Dr. Swift may terminate his or her employment, other than for Good Reason or due to a Change in Control, upon 90 days’ notice to the Company. In such event, the Company will continue to pay the executive his or her base salary through the termination date. The Company may specify a termination date for the employment of any of the NEOs that is less than 90 days after the Company’s receipt of written notice of such termination from the executive.
Continuation of Group Health Coverage. The Employment Agreements for Messrs. Ordan, Richards and Andreano, Ms. Moore and Dr. Swift also provide for the continuation in any self-insured, group health plan sponsored by the Company as if the executive were still an employee of the Company during any severance period or transition period. In addition, in the event Mr. Ordan’s employment was terminated due to Disability or death, without Cause (which occurred effective December 31, 2022), with Good Reason, or in connection with a Change in Control, Mr. Ordan may continue on the Company’s group medical plan until he is eligible for Medicare benefits provided that he timely elects
|
|
|
|
|
| Pediatrix Medical Group, Inc. |
|
54 |
|
2023 Proxy Statement |
Pay vs Performance Disclosure
Unit_pure in Thousands |
12 Months Ended |
|
Dec. 31, 2022
USD ($)
|
Dec. 31, 2021
USD ($)
|
Dec. 31, 2020
USD ($)
|
| Pay vs Performance Disclosure [Table] |
|
|
|
| Pay vs Performance [Table Text Block] |
The following table provides pay versus performance information required by Regulation S-K. For information regarding the Company’s philosophy and how the Company aligns executive compensation with the Company’s performance, refer to “Executive Compensation: Compensation Discussion and Ana lysis.”
|
|
|
|
|
|
|
|
|
|
|
|
|
|
|
|
|
|
|
|
|
|
|
|
|
|
|
|
|
|
|
|
|
|
|
|
|
|
|
|
|
|
|
Summary
Compensation
Table (“SCT”)
Total for First
PEO |
|
|
|
|
|
Compensation Actually Paid (“CAP”) to First PEO |
|
|
|
|
|
Average SCT Total for Non-PEO NEOs |
|
|
Average CAP to Non-PEO NEOs |
|
|
Value of Initial Fixed
$100 Investment Based
On: |
|
|
Income (Loss) from Continuing Operations (“IFCO”) ($ in thousands) |
|
|
Adjusted EBITDA ($ in thousands) |
|
| |
|
|
|
Peer Group Total Shareholder Return |
|
|
|
$ |
4,655,746 |
|
|
|
N/A |
|
|
$ |
540,703 |
|
|
|
N/A |
|
|
$ |
1,699,411 |
|
|
$ |
364,560 |
|
|
$ |
53.47 |
|
|
$ |
102.25 |
|
|
$ |
62,564 |
|
|
$ |
241,033 |
|
|
|
$ |
6,848,969 |
|
|
|
N/A |
|
|
$ |
9,015,601 |
|
|
|
N/A |
|
|
$ |
2,107,197 |
|
|
$ |
2,525,213 |
|
|
$ |
97.91 |
|
|
$ |
138.98 |
|
|
$ |
107,987 |
|
|
$ |
265,476 |
|
|
|
$ |
6,438,682 |
|
|
$ |
7,597,254 |
|
|
$ |
6,438,682 |
|
|
$ |
4,870,493 |
|
|
$ |
3,196,697 |
|
|
$ |
2,468,265 |
|
|
$ |
88.31 |
|
|
$ |
131.41 |
|
|
$ |
(9,580 |
) |
|
$ |
219,872 |
|
(1) |
In 2020, our Chief Executive Officers were Dr. Medel and Mr. Ordan. |
(2) |
Compensation “actually paid” is calculated in accordance with Item 402(v) of Regulation S-K, however, as required, the dollar amounts include (among other items) equity compensation that may be realizable in future periods, and as such, the dollar amounts shown do not fully represent the actual final amount of compensation earned or actually paid during the applicable years. The table below sets forth each adjustment made during the years presented in the table to calculate the compensation “actually paid,” in accordance with Item 402(v) of Regulation S-K, to our NEOs during each year in the table. |
(3) |
During 2022, our non-CEO NEOs consisted of Messrs. Richards and Andreano, Ms. Moore and Dr. Swift. During 2021, our non-CEO NEOs consisted of Messrs. Richards and Andreano, Mr. John C. Pepia, Ms. Moore and Roger “Mack” Hinson, M.D. During 2020, our non-CEO NEOs consisted of Messrs. Richards, Andreano and Pepia, Dr. Hinson, Mr. Stephen D. Farber and Mr. Nicholas J. Nikolopoulos. |
(4) |
The peer group used by the Company consists of the companies used in the Company’s performance graph reported in Part II, Item 5 of its Annual Report on Form 10-K for the fiscal year ended December 31, 2022, namely, the S&P 600 Health Care Index. |
(5) |
Income (loss) from continuing operations has been used as this is the most appropriate measure of income for the periods. |
(6) |
Adjusted EBITDA is the financial measure from the Tabular List of 2022 Most Important Measures shown below, which, in the Company’s assessment, represents for 2022 the most important performance measure used to link compensation actually paid to our CEOs and other NEOs to the Company’s performance. Adjusted EBITDA is defined on page 30 and is a non-GAAP financial measure. |
|
|
|
|
|
|
|
|
|
|
|
|
|
| |
|
|
|
Adjustments to Calculate Compensation “Actually Paid” to First PEO |
|
|
|
|
|
|
|
|
|
|
|
$ |
4,655,746 |
|
|
$ |
6,848,969 |
|
|
$ |
6,438,682 |
|
Minus: Grant Date Fair Value of Awards Granted During the Current Year (8) |
|
$ |
(3,500,013 |
) |
|
$ |
(3,500,021 |
) |
|
$ |
(4,999,998 |
) |
Plus (Minus): Fair Value of Equity Calculated Using SEC Methodology (9) |
|
$ |
(615,030 |
) |
|
$ |
5,666,653 |
|
|
$ |
4,999,998 |
|
|
|
$ |
540,703 |
|
|
$ |
9,015,601 |
|
|
$ |
6,438,682 |
|
|
|
|
|
|
|
|
|
|
|
|
|
|
|
|
|
|
Adjustments to Calculate Compensation “Actually Paid” to Second PEO (7) |
|
|
|
|
|
|
|
|
|
|
|
$ |
7,597,254 |
|
|
|
|
|
|
|
|
|
Minus: Grant Date Fair Value of Awards Granted During the Current Year (8) |
|
$ |
(6,150,001 |
) |
|
|
|
|
|
|
|
|
Plus (Minus): Fair Value of Equity Calculated Using SEC Methodology (9) |
|
$ |
3,423,240 |
|
|
|
|
|
|
|
|
|
|
|
$ |
4,870,493 |
|
|
|
|
|
|
|
|
|
|
|
|
|
|
|
|
|
|
|
|
|
|
| |
|
|
|
Adjustments to Calculate Compensation “Actually Paid” to Non-PEO NEOs |
|
|
|
|
|
|
|
|
|
|
|
$ |
1,699,411 |
|
|
$ |
2,107,197 |
|
|
$ |
3,196,697 |
|
Minus: Grant Date Fair Value of Awards Granted During the Current Year (8) |
|
$ |
(1,081,261 |
) |
|
$ |
(990,016 |
) |
|
$ |
(2,163,436 |
) |
Plus (Minus): Fair Value of Equity Calculated Using SEC Methodology (9) |
|
$ |
(253,590 |
) |
|
$ |
1,408,032 |
|
|
$ |
1,435,004 |
|
|
|
$ |
364,560 |
|
|
$ |
2,525,213 |
|
|
$ |
2,468,265 |
|
(7) |
As shown in these tables, the Compensation “Actually Paid” totals represent the SCT totals for the applicable year, but adjusted as required by SEC rules to include the fair value of current and prior year equity awards that are outstanding, vested or forfeited during the applicable year, instead of the grant date value of awards granted during the applicable year. |
(8) |
Represents the total of the amounts reported in the Stock Awards and Option Awards columns of the SCT for the applicable year. |
(9) |
The fair value of equity component of the CAP calculation was determined in accordance with SEC methodology for this disclosure. Unlike the SCT, which reflects the grant date fair value of equity awards granted during the applicable year, the CAP table reflects equity fair value as follows: |
| |
|
|
for awards granted during the applicable year (and which are still outstanding), the year-end value; plus |
| |
|
|
for awards granted during prior years that were still outstanding as of the applicable year-end, the change in value as of the applicable year-end compared against the prior year-end; plus |
| |
|
|
for awards granted in prior years that vested during the applicable year, the change in value as of the vesting date compared against the prior year-end; plus |
| |
|
|
for any awards granted in the applicable year that vested during the applicable year, the value as of the vesting date; plus |
| |
|
|
for any awards that vested during the applicable year, the value of any dividend equivalents that accrued during the vesting period with respect to those awards and were paid out at the same time as the underlying awards, as of the vesting date; minus |
| |
|
|
for awards granted in prior years that were forfeited during the applicable year, the value as of the prior year-end. | The specific calculations with respect to the CAP fair value of equity for the relevant years are shown in the tables below:
|
|
|
|
|
|
|
|
|
|
|
|
|
| |
|
|
|
First PEO – CAP Fair Value of Equity Calculation |
|
|
|
|
|
|
|
|
|
YE Value of Current Year Awards Outstanding as of YE |
|
$ |
— |
|
|
$ |
4,664,583 |
|
|
$ |
3,000,006 |
|
Change in Value as of YE for Prior Year Awards Outstanding as of YE |
|
$ |
— |
|
|
$ |
— |
|
|
$ |
— |
|
Change in Value as of Vesting Date for Prior Year Awards That Vested During the Year |
|
$ |
(1,748,149 |
) |
|
$ |
1,002,070 |
|
|
$ |
— |
|
Value as of Vesting Date for Current Year Awards That Vested During the Year |
|
$ |
1,133,119 |
|
|
$ |
— |
|
|
$ |
1,999,992 |
|
Value as of Vesting Date for Dividend Equivalents That Vested During the Year |
|
$ |
— |
|
|
$ |
— |
|
|
$ |
— |
|
Value as of Prior YE for Prior Year Awards Forfeited During the Year |
|
$ |
— |
|
|
$ |
— |
|
|
$ |
— |
|
Value of Equity for CAP Purposes |
|
$ |
(615,030 |
) |
|
$ |
5,666,653 |
|
|
$ |
4,999,998 |
|
|
|
|
|
|
|
|
|
|
|
|
|
|
|
|
|
|
Second PEO – CAP Fair Value of Equity Calculation |
|
|
|
|
|
|
|
|
|
YE Value of Current Year Awards Outstanding as of YE |
|
$ |
5,583,464 |
|
|
|
|
|
|
|
|
|
Change in Value as of YE for Prior Year Awards Outstanding as of YE |
|
$ |
(546,293 |
) |
|
|
|
|
|
|
|
|
Change in Value as of Vesting Date for Prior Year Awards That Vested During the Year |
|
$ |
(1,613,931 |
) |
|
|
|
|
|
|
|
|
Value as of Vesting Date for Current Year Awards That Vested During the Year |
|
$ |
— |
|
|
|
|
|
|
|
|
|
Value as of Vesting Date for Dividend Equivalents That Vested During the Year |
|
$ |
— |
|
|
|
|
|
|
|
|
|
Value as of Prior YE for Prior Year Awards Forfeited During the Year |
|
$ |
— |
|
|
|
|
|
|
|
|
|
Value of Equity for CAP Purposes |
|
$ |
3,423,240 |
|
|
|
|
|
|
|
|
|
|
|
|
|
|
|
|
|
|
|
|
|
|
| |
|
|
|
Non-PEO NEOs – CAP Fair Value of Equity Calculation |
|
|
|
|
|
|
|
|
|
YE Value of Current Year Awards Outstanding as of YE |
|
$ |
350,057 |
|
|
$ |
1,310,553 |
|
|
$ |
717,561 |
|
Change in Value as of YE for Prior Year Awards Outstanding as of YE |
|
$ |
(496,890 |
) |
|
$ |
60,423 |
|
|
$ |
(37,398 |
) |
Change in Value as of Vesting Date for Prior Year Awards That Vested During the Year |
|
$ |
(106,757 |
) |
|
$ |
37,056 |
|
|
$ |
(499,755 |
) |
Value as of Vesting Date for Current Year Awards That Vested During the Year |
|
$ |
— |
|
|
$ |
— |
|
|
$ |
1,254,596 |
|
Value as of Vesting Date for Dividend Equivalents That Vested During the Year |
|
$ |
— |
|
|
$ |
— |
|
|
$ |
— |
|
Value as of Prior YE for Prior Year Awards Forfeited During the Year |
|
$ |
— |
|
|
$ |
— |
|
|
$ |
— |
|
Value of Equity for CAP Purposes |
|
$ |
(253,590 |
) |
|
$ |
1,408,032 |
|
|
$ |
1,435,004 |
|
|
|
|
| Company Selected Measure Name |
Adjusted EBITDA
|
|
|
| Named Executive Officers, Footnote [Text Block] |
During 2022, our non-CEO NEOs consisted of Messrs. Richards and Andreano, Ms. Moore and Dr. Swift. During 2021, our non-CEO NEOs consisted of Messrs. Richards and Andreano, Mr. John C. Pepia, Ms. Moore and Roger “Mack” Hinson, M.D. During 2020, our non-CEO NEOs consisted of Messrs. Richards, Andreano and Pepia, Dr. Hinson, Mr. Stephen D. Farber and Mr. Nicholas J. Nikolopoulos
|
|
|
| Peer Group Issuers, Footnote [Text Block] |
The peer group used by the Company consists of the companies used in the Company’s performance graph reported in Part II, Item 5 of its Annual Report on Form 10-K for the fiscal year ended December 31, 2022, namely, the S&P 600 Health Care Index.
|
|
|
| Adjustment To PEO Compensation, Footnote [Text Block] |
(6) |
Adjusted EBITDA is the financial measure from the Tabular List of 2022 Most Important Measures shown below, which, in the Company’s assessment, represents for 2022 the most important performance measure used to link compensation actually paid to our CEOs and other NEOs to the Company’s performance. Adjusted EBITDA is defined on page 30 and is a non-GAAP financial measure. |
|
|
|
|
|
|
|
|
|
|
|
|
|
| |
|
|
|
Adjustments to Calculate Compensation “Actually Paid” to First PEO |
|
|
|
|
|
|
|
|
|
|
|
$ |
4,655,746 |
|
|
$ |
6,848,969 |
|
|
$ |
6,438,682 |
|
Minus: Grant Date Fair Value of Awards Granted During the Current Year (8) |
|
$ |
(3,500,013 |
) |
|
$ |
(3,500,021 |
) |
|
$ |
(4,999,998 |
) |
Plus (Minus): Fair Value of Equity Calculated Using SEC Methodology (9) |
|
$ |
(615,030 |
) |
|
$ |
5,666,653 |
|
|
$ |
4,999,998 |
|
|
|
$ |
540,703 |
|
|
$ |
9,015,601 |
|
|
$ |
6,438,682 |
|
|
|
|
|
|
|
|
|
|
|
|
|
|
|
|
|
|
Adjustments to Calculate Compensation “Actually Paid” to Second PEO (7) |
|
|
|
|
|
|
|
|
|
|
|
$ |
7,597,254 |
|
|
|
|
|
|
|
|
|
Minus: Grant Date Fair Value of Awards Granted During the Current Year (8) |
|
$ |
(6,150,001 |
) |
|
|
|
|
|
|
|
|
Plus (Minus): Fair Value of Equity Calculated Using SEC Methodology (9) |
|
$ |
3,423,240 |
|
|
|
|
|
|
|
|
|
|
|
$ |
4,870,493 |
|
|
|
|
|
|
|
|
|
|
|
|
|
|
|
|
|
|
|
|
|
|
| |
|
|
|
First PEO – CAP Fair Value of Equity Calculation |
|
|
|
|
|
|
|
|
|
YE Value of Current Year Awards Outstanding as of YE |
|
$ |
— |
|
|
$ |
4,664,583 |
|
|
$ |
3,000,006 |
|
Change in Value as of YE for Prior Year Awards Outstanding as of YE |
|
$ |
— |
|
|
$ |
— |
|
|
$ |
— |
|
Change in Value as of Vesting Date for Prior Year Awards That Vested During the Year |
|
$ |
(1,748,149 |
) |
|
$ |
1,002,070 |
|
|
$ |
— |
|
Value as of Vesting Date for Current Year Awards That Vested During the Year |
|
$ |
1,133,119 |
|
|
$ |
— |
|
|
$ |
1,999,992 |
|
Value as of Vesting Date for Dividend Equivalents That Vested During the Year |
|
$ |
— |
|
|
$ |
— |
|
|
$ |
— |
|
Value as of Prior YE for Prior Year Awards Forfeited During the Year |
|
$ |
— |
|
|
$ |
— |
|
|
$ |
— |
|
Value of Equity for CAP Purposes |
|
$ |
(615,030 |
) |
|
$ |
5,666,653 |
|
|
$ |
4,999,998 |
|
|
|
|
|
|
|
|
|
|
|
|
|
|
|
|
|
|
Second PEO – CAP Fair Value of Equity Calculation |
|
|
|
|
|
|
|
|
|
YE Value of Current Year Awards Outstanding as of YE |
|
$ |
5,583,464 |
|
|
|
|
|
|
|
|
|
Change in Value as of YE for Prior Year Awards Outstanding as of YE |
|
$ |
(546,293 |
) |
|
|
|
|
|
|
|
|
Change in Value as of Vesting Date for Prior Year Awards That Vested During the Year |
|
$ |
(1,613,931 |
) |
|
|
|
|
|
|
|
|
Value as of Vesting Date for Current Year Awards That Vested During the Year |
|
$ |
— |
|
|
|
|
|
|
|
|
|
Value as of Vesting Date for Dividend Equivalents That Vested During the Year |
|
$ |
— |
|
|
|
|
|
|
|
|
|
Value as of Prior YE for Prior Year Awards Forfeited During the Year |
|
$ |
— |
|
|
|
|
|
|
|
|
|
Value of Equity for CAP Purposes |
|
$ |
3,423,240 |
|
|
|
|
|
|
|
|
|
|
|
|
| Non-PEO NEO Average Total Compensation Amount |
$ 1,699,411
|
$ 2,107,197
|
$ 3,196,697
|
| Non-PEO NEO Average Compensation Actually Paid Amount |
$ 364,560
|
2,525,213
|
2,468,265
|
| Adjustment to Non-PEO NEO Compensation Footnote [Text Block] |
|
|
|
|
|
|
|
|
|
|
|
|
|
| |
|
|
|
Adjustments to Calculate Compensation “Actually Paid” to Non-PEO NEOs |
|
|
|
|
|
|
|
|
|
|
|
$ |
1,699,411 |
|
|
$ |
2,107,197 |
|
|
$ |
3,196,697 |
|
Minus: Grant Date Fair Value of Awards Granted During the Current Year (8) |
|
$ |
(1,081,261 |
) |
|
$ |
(990,016 |
) |
|
$ |
(2,163,436 |
) |
Plus (Minus): Fair Value of Equity Calculated Using SEC Methodology (9) |
|
$ |
(253,590 |
) |
|
$ |
1,408,032 |
|
|
$ |
1,435,004 |
|
|
|
$ |
364,560 |
|
|
$ |
2,525,213 |
|
|
$ |
2,468,265 |
|
|
|
|
|
|
|
|
|
|
|
|
|
|
| |
|
|
|
Non-PEO NEOs – CAP Fair Value of Equity Calculation |
|
|
|
|
|
|
|
|
|
YE Value of Current Year Awards Outstanding as of YE |
|
$ |
350,057 |
|
|
$ |
1,310,553 |
|
|
$ |
717,561 |
|
Change in Value as of YE for Prior Year Awards Outstanding as of YE |
|
$ |
(496,890 |
) |
|
$ |
60,423 |
|
|
$ |
(37,398 |
) |
Change in Value as of Vesting Date for Prior Year Awards That Vested During the Year |
|
$ |
(106,757 |
) |
|
$ |
37,056 |
|
|
$ |
(499,755 |
) |
Value as of Vesting Date for Current Year Awards That Vested During the Year |
|
$ |
— |
|
|
$ |
— |
|
|
$ |
1,254,596 |
|
Value as of Vesting Date for Dividend Equivalents That Vested During the Year |
|
$ |
— |
|
|
$ |
— |
|
|
$ |
— |
|
Value as of Prior YE for Prior Year Awards Forfeited During the Year |
|
$ |
— |
|
|
$ |
— |
|
|
$ |
— |
|
Value of Equity for CAP Purposes |
|
$ |
(253,590 |
) |
|
$ |
1,408,032 |
|
|
$ |
1,435,004 |
|
|
|
|
| Compensation Actually Paid vs. Total Shareholder Return [Text Block] |
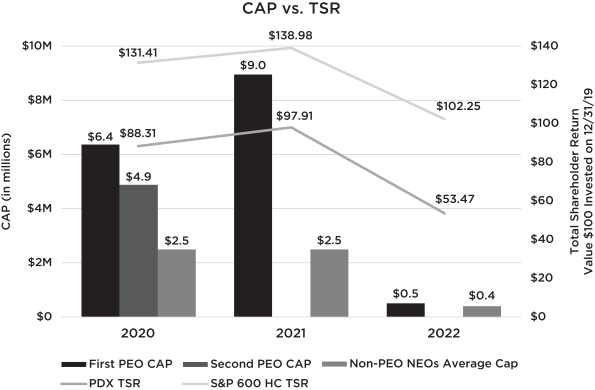
As described in more detail in the section “Compensation Discussion and Analysis,” the Company’s executive compensation program reflects a pay-for-performance philosophy. The Company generally seeks to incentivize long-term performance, and therefore does not specifically align the Company’s performance measures with compensation that is actually paid (as computed in accordance with Item 402(v) of Regulation S-K) (“CAP”) for a particular year. The following chart shows the relationship of the compensation actually paid to our PEOs and the average compensation actually paid to our other non-PEO NEOs to the total shareholder return for the Company (“PDX”) and for the S&P 600 Healthcare Index (“S&P 600 HC”).
|
|
|
| Compensation Actually Paid vs. Company Selected Measure [Text Block] |
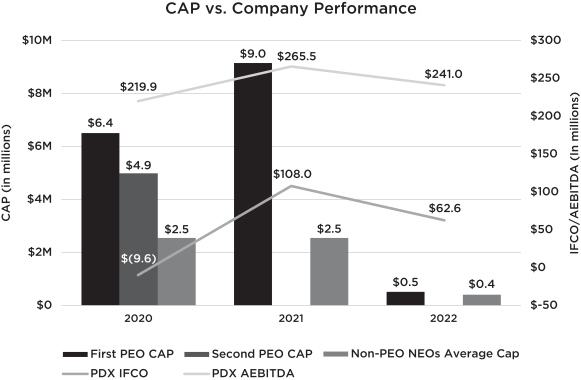
The following chart shows the relationship of the compensation actually paid to our PEOs and the average compensation actually paid to our other non-PEO NEOs as compared to our income (loss) from continuing operations (“IFCO”) and our Adjusted EBITDA (“AEBITDA”).
|
|
|
| Total Shareholder Return Vs Peer Group [Text Block] |
As described in more detail in the section “Compensation Discussion and Analysis,” the Company’s executive compensation program reflects a pay-for-performance philosophy. The Company generally seeks to incentivize long-term performance, and therefore does not specifically align the Company’s performance measures with compensation that is actually paid (as computed in accordance with Item 402(v) of Regulation S-K) (“CAP”) for a particular year. The following chart shows the relationship of the compensation actually paid to our PEOs and the average compensation actually paid to our other non-PEO NEOs to the total shareholder return for the Company (“PDX”) and for the S&P 600 Healthcare Index (“S&P 600 HC”).
|
|
|
| Tabular List [Table Text Block] |
Tabular List of Most Important Financial Performance Measures We consider the below financial performance measures to be the most important measures used by us to link NEO compensation to Company performance. For further information regarding these performance metrics and their function in our executive compensation program, please see “Compensation Discussion and Analysis.”
|
|
|
Most Important Financial Measures |
|
|
• Adjusted Income From Operations |
|
|
|
| Total Shareholder Return Amount |
$ 53.47
|
97.91
|
88.31
|
| Peer Group Total Shareholder Return Amount |
102.25
|
138.98
|
131.41
|
| Net Income (Loss) |
$ 62,564,000
|
$ 107,987,000
|
$ (9,580,000)
|
| Company Selected Measure Amount |
241,033
|
265,476
|
219,872
|
| Measure [Axis]: 1 |
|
|
|
| Pay vs Performance Disclosure [Table] |
|
|
|
| Measure Name |
Adjusted EBITDA
|
|
|
| Non-GAAP Measure Description [Text Block] |
Adjusted EBITDA is the financial measure from the Tabular List of 2022 Most Important Measures shown below, which, in the Company’s assessment, represents for 2022 the most important performance measure used to link compensation actually paid to our CEOs and other NEOs to the Company’s performance. Adjusted EBITDA is defined on page 30 and is a non-GAAP financial measure.
|
|
|
| Measure [Axis]: 2 |
|
|
|
| Pay vs Performance Disclosure [Table] |
|
|
|
| Measure Name |
Adjusted Income From Operations
|
|
|
| Dr. Medel [Member] |
|
|
|
| Pay vs Performance Disclosure [Table] |
|
|
|
| PEO Total Compensation Amount |
|
|
$ 7,597,254
|
| PEO Actually Paid Compensation Amount |
|
|
$ 4,870,493
|
| PEO Name |
|
|
Dr. Medel
|
| Mr. Ordan [Member] |
|
|
|
| Pay vs Performance Disclosure [Table] |
|
|
|
| PEO Total Compensation Amount |
$ 4,655,746
|
$ 6,848,969
|
$ 6,438,682
|
| PEO Actually Paid Compensation Amount |
540,703
|
9,015,601
|
$ 6,438,682
|
| PEO Name |
|
|
Mr. Ordan
|
| PEO [Member] | Dr. Medel [Member] | Grant Date [Member] |
|
|
|
| Pay vs Performance Disclosure [Table] |
|
|
|
| Adjustment to Compensation Amount |
|
|
$ (6,150,001)
|
| PEO [Member] | Dr. Medel [Member] | Fair Value of Equity Calculated Using SEC Methodology [Member] |
|
|
|
| Pay vs Performance Disclosure [Table] |
|
|
|
| Adjustment to Compensation Amount |
|
|
3,423,240
|
| PEO [Member] | Dr. Medel [Member] | YE Value of Current Year Awards Outstanding as of YE [Member] |
|
|
|
| Pay vs Performance Disclosure [Table] |
|
|
|
| Adjustment to Compensation Amount |
|
|
5,583,464
|
| PEO [Member] | Dr. Medel [Member] | Change in Value as of YE for Prior Year Awards Outstanding as of YE [Member] |
|
|
|
| Pay vs Performance Disclosure [Table] |
|
|
|
| Adjustment to Compensation Amount |
|
|
(546,293)
|
| PEO [Member] | Dr. Medel [Member] | Change in Value as of Vesting Date for Prior Year Awards That Vested During the Year [Member] |
|
|
|
| Pay vs Performance Disclosure [Table] |
|
|
|
| Adjustment to Compensation Amount |
|
|
(1,613,931)
|
| PEO [Member] | Dr. Medel [Member] | Value as of Vesting Date for Current Year Awards That Vested During the Year [Member] |
|
|
|
| Pay vs Performance Disclosure [Table] |
|
|
|
| Adjustment to Compensation Amount |
|
|
0
|
| PEO [Member] | Dr. Medel [Member] | Value as of Vesting Date for Dividend Equivalents That Vested During the Year [Member] |
|
|
|
| Pay vs Performance Disclosure [Table] |
|
|
|
| Adjustment to Compensation Amount |
|
|
0
|
| PEO [Member] | Dr. Medel [Member] | Value as of Prior YE for Prior Year Awards Forfeited During the Year [Member] |
|
|
|
| Pay vs Performance Disclosure [Table] |
|
|
|
| Adjustment to Compensation Amount |
|
|
0
|
| PEO [Member] | Dr. Medel [Member] | Value of Equity for CAP Purposes [Member] |
|
|
|
| Pay vs Performance Disclosure [Table] |
|
|
|
| Adjustment to Compensation Amount |
|
|
3,423,240
|
| PEO [Member] | Mr. Ordan [Member] | Grant Date [Member] |
|
|
|
| Pay vs Performance Disclosure [Table] |
|
|
|
| Adjustment to Compensation Amount |
(3,500,013)
|
(3,500,021)
|
(4,999,998)
|
| PEO [Member] | Mr. Ordan [Member] | Fair Value of Equity Calculated Using SEC Methodology [Member] |
|
|
|
| Pay vs Performance Disclosure [Table] |
|
|
|
| Adjustment to Compensation Amount |
(615,030)
|
5,666,653
|
4,999,998
|
| PEO [Member] | Mr. Ordan [Member] | YE Value of Current Year Awards Outstanding as of YE [Member] |
|
|
|
| Pay vs Performance Disclosure [Table] |
|
|
|
| Adjustment to Compensation Amount |
0
|
4,664,583
|
3,000,006
|
| PEO [Member] | Mr. Ordan [Member] | Change in Value as of YE for Prior Year Awards Outstanding as of YE [Member] |
|
|
|
| Pay vs Performance Disclosure [Table] |
|
|
|
| Adjustment to Compensation Amount |
0
|
0
|
0
|
| PEO [Member] | Mr. Ordan [Member] | Change in Value as of Vesting Date for Prior Year Awards That Vested During the Year [Member] |
|
|
|
| Pay vs Performance Disclosure [Table] |
|
|
|
| Adjustment to Compensation Amount |
(1,748,149)
|
1,002,070
|
0
|
| PEO [Member] | Mr. Ordan [Member] | Value as of Vesting Date for Current Year Awards That Vested During the Year [Member] |
|
|
|
| Pay vs Performance Disclosure [Table] |
|
|
|
| Adjustment to Compensation Amount |
1,133,119
|
0
|
1,999,992
|
| PEO [Member] | Mr. Ordan [Member] | Value as of Vesting Date for Dividend Equivalents That Vested During the Year [Member] |
|
|
|
| Pay vs Performance Disclosure [Table] |
|
|
|
| Adjustment to Compensation Amount |
0
|
0
|
0
|
| PEO [Member] | Mr. Ordan [Member] | Value as of Prior YE for Prior Year Awards Forfeited During the Year [Member] |
|
|
|
| Pay vs Performance Disclosure [Table] |
|
|
|
| Adjustment to Compensation Amount |
0
|
0
|
0
|
| PEO [Member] | Mr. Ordan [Member] | Value of Equity for CAP Purposes [Member] |
|
|
|
| Pay vs Performance Disclosure [Table] |
|
|
|
| Adjustment to Compensation Amount |
(615,030)
|
5,666,653
|
4,999,998
|
| Non-PEO NEO [Member] | Grant Date [Member] |
|
|
|
| Pay vs Performance Disclosure [Table] |
|
|
|
| Adjustment to Compensation Amount |
(1,081,261)
|
(990,016)
|
(2,163,436)
|
| Non-PEO NEO [Member] | Fair Value of Equity Calculated Using SEC Methodology [Member] |
|
|
|
| Pay vs Performance Disclosure [Table] |
|
|
|
| Adjustment to Compensation Amount |
(253,590)
|
1,408,032
|
1,435,004
|
| Non-PEO NEO [Member] | YE Value of Current Year Awards Outstanding as of YE [Member] |
|
|
|
| Pay vs Performance Disclosure [Table] |
|
|
|
| Adjustment to Compensation Amount |
350,057
|
1,310,553
|
717,561
|
| Non-PEO NEO [Member] | Change in Value as of YE for Prior Year Awards Outstanding as of YE [Member] |
|
|
|
| Pay vs Performance Disclosure [Table] |
|
|
|
| Adjustment to Compensation Amount |
(496,890)
|
60,423
|
(37,398)
|
| Non-PEO NEO [Member] | Change in Value as of Vesting Date for Prior Year Awards That Vested During the Year [Member] |
|
|
|
| Pay vs Performance Disclosure [Table] |
|
|
|
| Adjustment to Compensation Amount |
(106,757)
|
37,056
|
(499,755)
|
| Non-PEO NEO [Member] | Value as of Vesting Date for Current Year Awards That Vested During the Year [Member] |
|
|
|
| Pay vs Performance Disclosure [Table] |
|
|
|
| Adjustment to Compensation Amount |
0
|
0
|
1,254,596
|
| Non-PEO NEO [Member] | Value as of Vesting Date for Dividend Equivalents That Vested During the Year [Member] |
|
|
|
| Pay vs Performance Disclosure [Table] |
|
|
|
| Adjustment to Compensation Amount |
0
|
0
|
0
|
| Non-PEO NEO [Member] | Value as of Prior YE for Prior Year Awards Forfeited During the Year [Member] |
|
|
|
| Pay vs Performance Disclosure [Table] |
|
|
|
| Adjustment to Compensation Amount |
0
|
0
|
0
|
| Non-PEO NEO [Member] | Value of Equity for CAP Purposes [Member] |
|
|
|
| Pay vs Performance Disclosure [Table] |
|
|
|
| Adjustment to Compensation Amount |
$ (253,590)
|
$ 1,408,032
|
$ 1,435,004
|