Statement of Changes in Beneficial Ownership (4)
May 23 2022 - 12:59PM
Edgar (US Regulatory)
FORM 4
[ ]
Check this box if no longer subject to Section 16. Form 4 or Form 5 obligations may continue. See Instruction 1(b).
|
UNITED STATES SECURITIES AND EXCHANGE COMMISSION
Washington, D.C. 20549
STATEMENT OF CHANGES IN BENEFICIAL OWNERSHIP OF SECURITIES
|
OMB APPROVAL
OMB Number:
3235-0287
Estimated average burden
hours per response...
0.5
|
|
Filed pursuant to Section 16(a) of the Securities Exchange Act of 1934 or Section 30(h) of the Investment Company Act of 1940
|
|
|
1. Name and Address of Reporting Person
*
Filliol Olivier A |
2. Issuer Name and Ticker or Trading Symbol
METTLER TOLEDO INTERNATIONAL INC/
[
MTD
]
|
5. Relationship of Reporting Person(s) to Issuer
(Check all applicable)
__X__ Director _____ 10% Owner
_____ Officer (give title below) _____ Other (specify below)
|
|
(Last)
(First)
(Middle)
IM LANGACHER 44 |
3. Date of Earliest Transaction
(MM/DD/YYYY)
5/19/2022 |
|
(Street)
GREIFENSEE, V8 8606
(City)
(State)
(Zip)
|
4. If Amendment, Date Original Filed
(MM/DD/YYYY)
|
6. Individual or Joint/Group Filing
(Check Applicable Line)
_X
_ Form filed by One Reporting Person
___ Form filed by More than One Reporting Person
|
Table I - Non-Derivative Securities Acquired, Disposed of, or Beneficially Owned
|
1.Title of Security
(Instr. 3)
|
2. Trans. Date
|
2A. Deemed Execution Date, if any
|
3. Trans. Code
(Instr. 8)
|
4. Securities Acquired (A) or Disposed of (D)
(Instr. 3, 4 and 5)
|
5. Amount of Securities Beneficially Owned Following Reported Transaction(s)
(Instr. 3 and 4)
|
6. Ownership Form: Direct (D) or Indirect (I) (Instr. 4)
|
7. Nature of Indirect Beneficial Ownership (Instr. 4)
|
|
Code
|
V
|
Amount
|
(A) or (D)
|
Price
|
| Common Stock, par value $0.01 per share | 5/19/2022 | | S | | 100 | D | $1204.20 | 21083 | D | |
| Common Stock, par value $0.01 per share | 5/19/2022 | | S | | 100 | D | $1207.90 | 20983 | D | |
| Common Stock, par value $0.01 per share | 5/19/2022 | | S | | 100 | D | $1209.40 | 20883 | D | |
| Common Stock, par value $0.01 per share | 5/19/2022 | | S | | 200 | D | $1210.69 (1) | 20683 | D | |
| Common Stock, par value $0.01 per share | 5/19/2022 | | S | | 672 | D | $1213.11 (2) | 20011 | D | |
| Common Stock, par value $0.01 per share | 5/19/2022 | | S | | 128 | D | $1213.98 (3) | 19883 | D | |
| Common Stock, par value $0.01 per share | 5/19/2022 | | S | | 400 | D | $1215.32 (4) | 19483 | D | |
| Common Stock, par value $0.01 per share | 5/19/2022 | | S | | 537 | D | $1216.49 (5) | 18946 | D | |
| Common Stock, par value $0.01 per share | 5/19/2022 | | S | | 400 | D | $1217.54 (6) | 18546 | D | |
| Common Stock, par value $0.01 per share | 5/19/2022 | | S | | 500 | D | $1218.63 (7) | 18046 | D | |
| Common Stock, par value $0.01 per share | 5/19/2022 | | S | | 300 | D | $1220.25 (8) | 17746 | D | |
| Common Stock, par value $0.01 per share | 5/19/2022 | | S | | 697 | D | $1221.42 (9) | 17049 | D | |
| Common Stock, par value $0.01 per share | 5/19/2022 | | S | | 463 | D | $1222.51 (10) | 16586 | D | |
| Common Stock, par value $0.01 per share | 5/19/2022 | | S | | 177 | D | $1223.81 (11) | 16409 | D | |
| Common Stock, par value $0.01 per share | 5/19/2022 | | S | | 100 | D | $1224.70 | 16309 | D | |
Table II - Derivative Securities Beneficially Owned (e.g., puts, calls, warrants, options, convertible securities)
|
1. Title of Derivate Security
(Instr. 3) | 2. Conversion or Exercise Price of Derivative Security | 3. Trans. Date | 3A. Deemed Execution Date, if any | 4. Trans. Code
(Instr. 8) | 5. Number of Derivative Securities Acquired (A) or Disposed of (D)
(Instr. 3, 4 and 5) | 6. Date Exercisable and Expiration Date | 7. Title and Amount of Securities Underlying Derivative Security
(Instr. 3 and 4) | 8. Price of Derivative Security
(Instr. 5) | 9. Number of derivative Securities Beneficially Owned Following Reported Transaction(s) (Instr. 4) | 10. Ownership Form of Derivative Security: Direct (D) or Indirect (I) (Instr. 4) | 11. Nature of Indirect Beneficial Ownership (Instr. 4) |
| Code | V | (A) | (D) | Date Exercisable | Expiration Date | Title | Amount or Number of Shares |
| Explanation of Responses: |
| (1) | Represents the average sales price of multiple individual transactions at prices between $1,210.46 and $1,210.91. Filer agrees to provide, upon request by the Commission staff, full information regarding the number of shares purchased or sold at each separate price. |
| (2) | Represents the average sales price of multiple individual transactions at prices between $1,212.62 and $1,213.46. Filer agrees to provide, upon request by the Commission staff, full information regarding the number of shares purchased or sold at each separate price. |
| (3) | Represents the average sales price of multiple individual transactions at prices between $1,213.79 and $1,214.02. Filer agrees to provide, upon request by the Commission staff, full information regarding the number of shares purchased or sold at each separate price. |
| (4) | Represents the average sales price of multiple individual transactions at prices between $1,214.99 and $1,215.93. Filer agrees to provide, upon request by the Commission staff, full information regarding the number of shares purchased or sold at each separate price. |
| (5) | Represents the average sales price of multiple individual transactions at prices between $1,216.02 and $1,216.70. Filer agrees to provide, upon request by the Commission staff, full information regarding the number of shares purchased or sold at each separate price. |
| (6) | Represents the average sales price of multiple individual transactions at prices between $1,217.19 and $1,218.11. Filer agrees to provide, upon request by the Commission staff, full information regarding the number of shares purchased or sold at each separate price. |
| (7) | Represents the average sales price of multiple individual transactions at prices between $1,218.25 and $1,219.02. Filer agrees to provide, upon request by the Commission staff, full information regarding the number of shares purchased or sold at each separate price. |
| (8) | Represents the average sales price of multiple individual transactions at prices between $1,219.70 and $1,220.67. Filer agrees to provide, upon request by the Commission staff, full information regarding the number of shares purchased or sold at each separate price. |
| (9) | Represents the average sales price of multiple individual transactions at prices between $1,221.07 and $1,221.91. Filer agrees to provide, upon request by the Commission staff, full information regarding the number of shares purchased or sold at each separate price. |
| (10) | Represents the average sales price of multiple individual transactions at prices between $1,222.17 and $1,222.94. Filer agrees to provide, upon request by the Commission staff, full information regarding the number of shares purchased or sold at each separate price. |
| (11) | Represents the average sales price of multiple individual transactions at prices between $1,223.46 and $1,224.08. Filer agrees to provide, upon request by the Commission staff, full information regarding the number of shares purchased or sold at each separate price. |
Reporting Owners
|
| Reporting Owner Name / Address | Relationships |
| Director | 10% Owner | Officer | Other |
Filliol Olivier A
IM LANGACHER 44
GREIFENSEE, V8 8606 | X |
|
|
|
Signatures
|
| Michelle M. Roe, Attorney in Fact | | 5/23/2022 |
| **Signature of Reporting Person | Date |
| Reminder: Report on a separate line for each class of securities beneficially owned directly or indirectly. |
| * | If the form is filed by more than one reporting person, see Instruction 4(b)(v). |
| ** | Intentional misstatements or omissions of facts constitute Federal Criminal Violations. See 18 U.S.C. 1001 and 15 U.S.C. 78ff(a). |
| Note: | File three copies of this Form, one of which must be manually signed. If space is insufficient, see Instruction 6 for procedure. |
| Persons who respond to the collection of information contained in this form are not required to respond unless the form displays a currently valid OMB control number. |
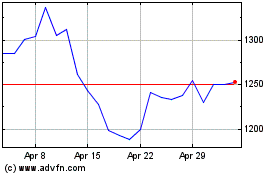
Mettler Toledo (NYSE:MTD)
Historical Stock Chart
From Aug 2024 to Sep 2024

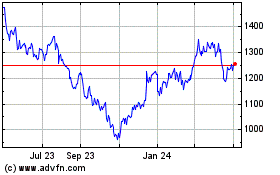
Mettler Toledo (NYSE:MTD)
Historical Stock Chart
From Sep 2023 to Sep 2024
