CHESAPEAKE UTILITIES CORP 734-6799 false 0000019745 0000019745 2024-02-22 2024-02-22
UNITED STATES
SECURITIES AND EXCHANGE COMMISSION
WASHINGTON, D.C. 20549
FORM 8-K
CURRENT REPORT
Pursuant to Section 13 or 15(d)
of the Securities Exchange Act of 1934
Date of Report (Date of Earliest Event Reported): February 22, 2024
Chesapeake Utilities Corporation
(Exact name of registrant as specified in its charter)
|
|
|
|
|
| Delaware |
|
001-11590 |
|
51-0064146 |
| (State or other jurisdiction of incorporation) |
|
(Commission File Number) |
|
(I.R.S. Employer Identification No.) |
|
|
|
| 500 Energy Lane, Dover, Delaware |
|
19901 |
| (Address of principal executive offices) |
|
(Zip Code) |
Registrant’s telephone number, including area code: 302. 734.6799
Not Applicable
Former name or former address, if changed since last report
Check the appropriate box below if the Form 8-K filing is intended to simultaneously satisfy the filing obligation of the registrant under any of the following provisions (see General Instruction A.2. below):
| ☐ |
Written communications pursuant to Rule 425 under the Securities Act (17 CFR 230.425) |
| ☐ |
Soliciting material pursuant to Rule 14a-12 under the Exchange Act (17 CFR 240.14a-12) |
| ☐ |
Pre-commencement communications pursuant to Rule 14d-2(b) under the Exchange Act (17 CFR 240.14d-2(b)) |
| ☐ |
Pre-commencement communications pursuant to Rule 13e-4(c) under the Exchange Act (17 CFR 240.13e-4(c)) |
Securities registered pursuant to Section 12(b) of the Act:
|
|
|
|
|
| Title of each class |
|
Trading Symbol(s) |
|
Name of each exchange on which registered |
| Common Stock - par value per share $0.4867 |
|
CPK |
|
New York Stock Exchange |
Indicate by check mark whether the registrant is an emerging growth company as defined in Rule 405 of the Securities Act of 1933 (§230.405 of this chapter) or Rule 12b-2 of the Securities Exchange Act of 1934 (§240.12b-2 of this chapter).
Emerging growth company ☐
If an emerging growth company, indicate by check mark if the registrant has elected not to use the extended transition period for complying with any new or revised financial accounting standards provided pursuant to Section 13(a) of the Exchange Act. ☐
| Item 7.01 |
Regulation FD Disclosure. |
On February 22, 2024, Chesapeake Utilities Corporation (the “Company”) posted a presentation that will be used during its conference call on February 22, 2024, to discuss the Company’s financial results for the fourth quarter and full year ended December 31, 2023, on its website (www.chpk.com) under the “Investors” section. This presentation is being furnished as Exhibit 99.1 to this Current Report on Form 8-K (this “Report”).
The information contained in this Item 7.01 and in Exhibit 99.1 attached to this Report is being furnished and shall not be deemed filed for purposes of Section 18 of the Securities Exchange Act of 1934, as amended, or otherwise subject to the liabilities of such section. Furthermore, such information shall not be deemed to be incorporated by reference into any registration statement or other document filed pursuant to the Securities Act of 1933, as amended.
| Item 9.01 |
Financial Statements and Exhibits. |
(d) Exhibits.
SIGNATURES
Pursuant to the requirements of the Securities Exchange Act of 1934, the registrant has duly caused this report to be signed on its behalf by the undersigned hereunto duly authorized.
|
|
|
|
|
|
|
|
|
|
|
Chesapeake Utilities Corporation |
|
|
|
|
| February 22, 2024 |
|
|
|
By: |
|
/s/ Beth W. Cooper |
|
|
|
|
Name: |
|
Beth W. Cooper |
|
|
|
|
Title: |
|
Executive Vice President, Chief Financial Officer, Treasurer, and Assistant Corporate Secretary |

Exhibit 99.1 Fourth Quarter and Full Year 2023 CHE S AP EAKE Earnings
Conference Call UT IL ITIES CORP ORAT ION February 22, 2024 1

Today’s Presenters Jeff Householder Chairman of the Board,
President, and Chief Executive Officer Beth Cooper Executive Vice President, Chief Financial Officer, Treasurer, and Assistant Corporate Secretary Jim Moriarty Executive Vice President, General Counsel, Corporate Secretary, and Chief Policy and Risk
Officer 2

Safe Harbor for Forward-Looking Statements Safe Harbor Statement Some of
the statements in this presentation are “forward-looking statements” within the meaning of the Private Securities Litigation Reform Act of 1995 and other applicable law. Such forward--looking statements may be identified by the use of
words, such as “project,” “believe,” “expect,” “anticipate,” “intend,” “plan,” “estimate,” “continue,” “potential,” “forecast” or
other similar words, or future or conditional verbs such as “may,” “will,” “should,” “would” or “could.” These statements represent our intentions, plans, expectations, assumptions and
beliefs about our future financial performance, business strategy, projected plans and objectives. These statements are subject to many risks and uncertainties and actual results may materially differ from those expressed in these forward-looking
statements. Please refer to Chesapeake Utilities Annual Report on Form 10-K for the year ended December 31, 2023 filed with the SEC and other SEC filings concerning factors that could cause those results to be different than contemplated in this
presentation. Non-GAAP Financial Information This presentation includes non-GAAP financial measures including Adjusted Gross Margin, Adjusted Net Income and Adjusted Earnings Per Share (“EPS*”). A non-GAAP financial measure is generally
defined as a numerical measure of a company's historical or future performance that includes or excludes amounts, or that is subject to adjustments, so as to be different from the most directly comparable measure calculated or presented in
accordance with GAAP. Our management believes certain non-GAAP financial measures, when considered together with GAAP financial measures, provide information that is useful to investors in understanding period-over-period operating results separate
and apart from items that may, or could, have a disproportionately positive or negative impact on results in any particular period. The Company calculates Adjusted Gross Margin by deducting the purchased cost of natural gas, propane and electricity
and the cost of labor spent on direct revenue-producing activities from operating revenues. The costs included in Adjusted Gross Margin exclude depreciation and amortization and certain costs presented in operations and maintenance expenses in
accordance with regulatory requirements. The Company calculates Adjusted Net Income and Adjusted EPS by deducting costs and expenses associated with significant acquisitions that may affect the comparison of period-over-period results. These
non-GAAP financial measures are not in accordance with, or an alternative to, GAAP and should be considered in addition to, and not as a substitute for, the comparable GAAP measures. The Company believes that these non-GAAP measures are useful and
meaningful to investors as a basis for making investment decisions and provide investors with information that demonstrates the profitability achieved by the Company under allowed rates for regulated energy operations and under the Company's
competitive pricing structures for unregulated energy operations. The Company's management uses these non-GAAP financial measures in assessing a business unit and Company performance. Other companies may calculate these non-GAAP financial measures
in a different manner. See Appendix for a reconciliation of Gross Margin, Net Income and EPS, all as defined under GAAP, to our non-GAAP measures of Adjusted Gross Margin, Adjusted Net Income, and Adjusted EPS for each of the periods presented.
*Unless otherwise noted, EPS and Adjusted EPS information is presented on a diluted basis. 3

Year End 2023 Financial Highlights EXTENDING our 1/ • Adjusted EPS
of $5.31 , reflecting a greater than 5% growth rate over the prior year consecutive th 2/ • 17 consecutive year with increased earnings earnings and rd th • 63 consecutive year of paying dividends and 20 consecutive year annualized
dividends increased dividend record driven by STRONG • Adjusted gross margin growth of $33.9 million over 2022, driven by regulatory initiatives, continued pipeline expansion projects, INVESTMENT and natural gas organic growth, incremental
margin from Florida City Gas (FCG) and strong propane margin and fees REGULATORY • Continued strong residential customer growth - average annual increase of 5.4% and 3.9%, respectively, on Delmarva and in Florida INITIATIVES in our •
Deployed $211 million on new capital investments in our legacy businesses - 80% are regulated investments legacy • Four additional transmission projects currently in the regulatory/permitting review process businesses while executing
SUCCESSFUL • Completed the acquisition of Florida City Gas for $923 million in just over two months, doubling our presence in high growth Florida strategic • Integration is underway on this largest acquisition in company history, and
will continue during 2024 acquisitions that • Several projects pending to connect locally landfill-produced RNG to FCG’s distribution system will help propel • Along with continued investment in our legacy businesses, will lead to
transformational growth over the next several years future growth • Expanded our propane footprint in North Carolina, adding 3,000 new customers, by acquiring J.T. Lee and Son’s and confidently REAFFIRMING our • Providing 2024 EPS
guidance between $5.33-$5.45 previous guidance • Reaffirming our 5-year capital expenditure guidance of $1.5B-$1.8B by 2028, with $300M-$360M expected in 2024 and PROVIDING • Reaffirming our EPS guidance between $6.15-$6.35 for 2025 and
$7.75-$8.00 for 2028 2024 guidance. 1/ See appendix for GAAP to non-GAAP reconciliation for adjusted diluted earnings per share 2/ 4 Excludes TCJA impact in 2017; 2023 excludes transaction-related costs associated with the FCG acquisition

2023 Financial Performance Key Adjusted Gross Margin Drivers Adjusted
Diluted Earnings Per 1/ Share $8.8M $15.6M $11.0M $5.31 Regulated Pipeline Expansions Higher Propane $5.04 Margins per Gallon Infrastructure and Natural Gas Programs Organic Growth and Fees and Recovery Mechanisms $8.7M $1.1M $1.0M $1.64 $1.47
Contribution from Increased Gathering Adjusted Gross Acquisition of FCG Fees for Aspire Margin from Off- Energy System Natural Gas Capacity Sales Q4 2022 Q4 2023 2022 2023 Lower Customer Consumption Related to Warmer -$13.6M Weather 5 1/ Diluted
Earnings Per Share Growth from Continuing Operations; 2023 excludes transaction-related costs associated with the FCG acquisition

Significant Investment in Our Legacy Businesses In 2023, we invested
$211 million in our legacy businesses, with 80% of that in our regulated operations 2023 Capital Investment in Legacy Businesses Regulated Capital by Type (in millions) 2% $42 8% $20 $40 32% $169M in the Regulated Businesses 58% 80% of Legacy
Business Capital $109 NG Distribution NG Transmission Elec. Distribution Unregulated Growth Infrastructure Technology Other Customer growth in our service jurisdictions remains strong and will continue to drive significant capital investment through
the 2028 guidance period 6

Regulated Natural Gas Distribution Customer Growth Our average annual
residential customer growth rate for our legacy natural gas distribution businesses far outpaces the 1/ national average annual customer growth rate . 2/ Average Number of Customers • Above average annual growth rate for residential customers
over the period 2021 to 2023 Expect an nd • From April 2020 to July 2023, Florida ranked 2 average annual 3/ in the nation for population growth growth rate of Projection • Our Delaware service territory includes Sussex approximately
Florida City Gas 3/ County, the fastest growing county in the state 3% for Florida Florida NG • Growth in the Maryland counties we serve and 4% for Delmarva NG 3/ outpaced statewide growth Delmarva over the next 5 years • As of the end
of 2023, current backlog of 60,000 lots in existing communities 2024 - 2028 1/ Source: EIA. Over the period 2019-2022, the latest year available, the average annual natural gas distribution customer growth rate in the U.S. was approximately 1%. 2/
FCG customer count reflects number of customers as of December 31, 2023 7 3/ U.S. Census Bureau, Population Division

Major Projects and Initiatives Update Our projects and initiatives
underway will continue to drive margin growth while new projects and regulatory initiatives will drive additional margin growth across our guidance period Project/Initiative Year Ended December Estimate for Fiscal (in thousands) 2021 2022 2023 2024
2025 Pipeline Expansions: New projects in various stages of the regulatory / Guernsey Power Station $ 187 $ 1,377 $ 1,478 $ 1,482 $ 1,478 permitting process Southern Expansion - - 586 2,344 2,344 Winter Haven Expansion - 260 637 626 626 Worcester
Resiliency Upgrade Project - $80 million Beachside Pipeline Extension - - 1,810 2,451 2,414 North Ocean City Connector - - - - 494 • LNG storage peaking facility to meet critical service St. Cloud / Twin Lakes Expansion - - 264 584 584 needs
on the Delmarva Peninsula 1 Clean Energy - 126 1,064 1,009 1,079 Wildlight - - 471 2,000 2,038 East Coast Reinforcement Projects - $35.8 million Lake Wales - - 265 454 454 • Two projects (Boynton Beach and New Smyrna Beach) Newberry - - - 862
2 ,585 Total Pipeline Expansions 187 1,763 6,575 11,812 14,096 to increase supply capability and enhance reliability for FPU’s distribution systems CNG/RNG/LNG Transportation and Infrastructure 7,566 11,100 11,181 $ 12,500 $ 1 3,969 Central
Florida Reinforcement Projects Regulatory Initiatives: • Two projects (Plant City, Lake Mattie) to enhance Florida GUARD Program - - 353 2,421 5,136 delivery to FPU’s distribution systems FCG SAFE Program - - - 2,683 5,293 Capital Cost
Surcharge Programs 1,199 2,001 2,829 3,979 4,374 2 Florida Rate Case Proceeding FCG RNG Projects - 2,474 15,835 17,153 17,153 3 Maryland Rate Case Proceeding - - - TBD TBD • Several projects pending to connect locally landfill- Electric Storm
Protection Plan - 486 1,326 2,433 3,951 produced RNG to FCG’s distribution system Total Regulatory Initiatives 1,199 4,961 20,343 28,669 35,907 Total $ 8,952 $ 1 7,824 $ 38,099 $ 52,981 $ 6 3,972 Year-Over-Year Change $ 14,882 $ 10,991 1
Includes adjusted gross margin generated from interim services through the project in-service date in September 2023. 8 2 Includes adjusted gross margin during 2023 comprised of both interim rates and permanent base rates which became effective in
March 2023. 3 Rate case application filed with the Maryland PSC in January 2024.

Florida City Gas Acquisition and Integration Progress 178 Florida City
Gas employees joined the Chesapeake Utilities Corporation team Largest acquisition in CPK history completed on November 30, 2023 Expands Platform in Florida• Financed with net proceeds of an equity offering of High growth utility $366M and
$550M of uncollateralized senior notes jurisdiction; gas system expansion opportunities • Immediately more than doubled our customer base in Florida Enhances Scale and Efficiency Integration efforts are ongoing and will continue CPK has
extensive throughout 2024 operational and regulatory expertise • Introduced HyperCare team to make “Day One” and near-term onboarding process as smooth as possible Financial Benefits • Anticipate successful integration and
moving Builds on CPK’s track record of forward together as one company successful M&A • Operating synergies to continue in 2024 with expected additional benefit in future years 9

Sharp Energy propane acquisition - JT Lee and Son’s Acquisition
expands Sharp Energy’s footprint once again in North Carolina • Acquisition highlights: Our propane presence in the Carolinas continues to grow Sharp first Approximately Bulk plant with established a Approximately 800,000 gallons 60,000
gallons 3,000 new of propane presence in of propane customers distributed North Carolina storage annually in 2021 The acquisition of J.T. Lee and • Expands Wilmington, North Carolina-area Son’s is footprint nd Sharp’s 2 •
Expected to provide cost savings and other acquisition in synergistic benefits North Carolina since that time • Efficiencies include additional storage capacity 10

Key Drivers of Performance – Year Ended December 31, 2023 Despite
warmer weather and challenging interest rate and economic environments, our core businesses performed well, complimented by earnings related to the Florida City Gas acquisition on November 30, 2023 1/ Adjusted Diluted Earnings Per Share Lower
customer consumption Depreciation, related to Operating amortization warmer expenses and property weather Core (excluding 2/ Florida City tax costs Interest business FCG) Gas growth (not and other 3/ Absence of Reduction acquisition impacted by
changes 2022 non- in state tax weather recurring rate YTD YTD and items excluding 2022 2023 FCG) $0.03 net impact from one- time, non-recurring items 1/ See appendix for GAAP to non-GAAP reconciliation for adjusted diluted earnings per share 2/
Includes a benefit from RSAM of $5.1 million, pre-tax, or $0.20 per share 11 3/ Does not include RSAM benefit, which is included in depreciation expense

Year-End 2023 Financial Summary Solid performance, despite
significantly warmer weather and continued inflationary environment Consolidated Fiscal Year Change (in thousands except per share data) 2023 2022 $ % Excluding transaction- 1 Total Adjusted Gross Margin $ 454,123 $ 420,198 $ 3 3,925 8.1% related
expenses, operating income Operating Income 1 50,803 1 42,933 7,870 5.5% increased $18.2 million, Other Income (Expense), Net 1,438 5,051 (3,613) -71.5% or 12.8% Interest Charges 36,951 24,356 12,595 51.7% Pre-tax Income 1 15,290 1 23,628 (8,338)
-6.7% Income Taxes 28,078 33,832 (5,754) -17.0% Net Income $ 87,212 $ 8 9,796 $ ( 2,584) -2.9% Diluted EPS $ 4.73 $ 5.04 $ (0.31) -6.2% Net Income (GAAP) $ 87,212 $ 89,796 $ ( 2,584) -2.9% 2 Transaction-related expenses, net 10,625 - 10,625 N/A 1
Adjusted Net Income (Non-GAAP) $ 9 7,837 $ 8 9,796 $ 8,041 9.0% 1 Adjusted Earnings Per Share - Diluted (Non-GAAP) $ 5.31 $ 5.04 $ 0.27 5.4% 1 See appendix for GAAP to non-GAAP reconciliations. 2 12 Transaction-related expenses represent costs
incurred attributable to the announced acquisition of FCG including, but not limited to, legal, consulting, audit and financing fees.

Regulated Energy Segment – Financial Summary Our legacy business
results reflect continued expansion efforts and customer growth; The Florida City Gas acquisition contributed one month of strong earnings Fiscal Year Change (in thousands) 2023 2022 $ % 1 Adjusted Gross Margin $ 333,587 $ 302,252 $ 31,335 10.4%
Dep., amort. & property taxes 7 1,653 73,961 (2,308) (3.1)% 2 FCG transaction-related expenses 10,355 - 1 0,355 N/A Other operating expenses 1 25,380 112,974 12,406 11.0% Operating income $ 1 26,199 $ 115,317 $ 10,882 9.4% 2023 Highlights
• Operating income up 18.4% (excluding FCG transaction costs) driven by: • Permanent rate changes associated with Florida natural gas base rate proceeding • Contribution for one full month of earnings in 2023 attributable to
Florida City Gas • Organic growth in natural gas distribution operations, including propane CGS conversions • Pipeline expansions by our natural gas transmission entities • Incremental margins from regulated infrastructure programs
• Partially offset by reduced customer consumptionZKLFKZDVGXHSULPDULOWRZDUPHU ZHDWKHU 1 See appendix for GAAP to non-GAAP reconciliation of adjusted gross margin 13 2 Transaction-related expenses represent costs incurred attributable to the
acquisition of FCG including, but not limited to, legal, consulting, audit and financing fees.

Unregulated Energy Segment – Financial Summary Higher propane
margins and fees as well as increased margins for the other unregulated energy businesses significantly offset warmer weather Fiscal Year Change (in thousands) 2023 2022 $ % 1 Adjusted Gross Margin $ 120,656 $1 18,067 $ 2,589 2.2% Dep., amort. &
property taxes 19,525 17,809 1,716 9.6% Other operating expenses 76,705 72,908 3,797 5.2% Operating income $ 24,426 $ 2 7,350 $ (2,924) -10.7% 2023 Highlights •Warmer weather impacted operating income • Increased propane margins and
service fees offset much of the impact related to reduced customer consumption, which was primarily due to warmer weather • Increase in gathering margins and consumption for Aspire Energy • Increase in electric generation margins for our
Eight Flags CHP facility 1 See appendix for GAAP to non-GAAP reconciliation of adjusted gross margin 14

Three Decades of Dividend Growth Drive Shareholder Return 12%+ Compound
Annual Shareholder Return over 10 years Annualized Dividend per Share 63 Consecutive Years of Dividend Payments – Since 1960 20 Consecutive Years of Dividend Increases – Since 2004 Dividend Increases 28 of the last 30 Years – Since
1994 Quarterly Dividend History Ex-Dividend Record Payable Amount per Date Date Date Share 4Q 2023 12/14/2023 11/2/2023 1/5/2024 $0.5900 3Q 2023 9/14/2023 8/3/2023 10/5/2023 $0.5900 2Q 2023 6/14/2023 5/3/2023 7/5/2023 $0.5900 1Q 2023 3/14/2023
2/22/2023 4/5/2023 $0.5350 4Q 2022 12/14/2022 11/3/2022 1/5/2023 $0.5350 3Q 2022 9/14/2022 8/4/2022 10/5/2022 $0.5350 2Q 2022 6/14/2022 5/4/2022 7/5/2022 $0.5350 1Q 2022 3/14/2022 2/23/2022 4/5/2022 $0.4800 4Q 2021 12/14/2021 11/3/2021 1/5/2022
$0.4800 3Q 2021 9/14/2021 8/11/2021 10/5/2021 $0.4800 2Q 2021 6/14/2021 5/5/2021 7/6/2021 $0.4800 1Q 2021 3/12/2021 2/24/2021 4/5/2021 $0.4400 15

Earnings Outlook Guidance expected to drive increased shareholder value
Earnings Per Share - Diluted Earnings Growth 1 • 2023 Earnings Per Share of $5.31 Driven by Capital • ~9% CAGR over last 10 years Investment • 17 yrs of consecutive Adjusted EPS growth • 2024 EPS Guidance of $5.33 to $5.45
• 2028 EPS Guidance reiterated: $7.75 to $8.00 Dividend Growth • 20 Consecutive Years of Dividend Increases Supported by • Current Annualized Dividend of $2.36/share • ~9% CAGR over last 10 years Earnings 2 • Targeting
Long-term DPO of 45 - 50% • Enables CPK to reinvest more back into growth plan Best in Class th • Annual shareholder return >85 percentile among 3 Shareholder peer group the past 5, 10, 15 & 20 year periods Return • >300%
increase in stock price over the past 15 years drives a $2.1B Increase in Market Cap 2 CPK Guidance: 45 to 50% Dividend Payout 4 3 • Highest P/E ratio in peer group at year end 2023 1 Adjusted EPS excludes transaction-related expenses incurred
attributable to the acquisition of FCG 2 Future dividends are subject to board approval 3 Peer Group includes select group of 10 CKP peer companies. Details can be found in the Annual Report on Form 10-K 16 4 Price-to-Earnings ratio based on analyst
consensus next twelve months EPS

1/ Pathway to 2024 EPS Guidance Our 2024 target is based on continued
growth from our legacy businesses, a full year of contribution from the acquisition of 2/ FCG, and additional opportunities we have identified 1/ Adjusted Diluted Earnings Per Share Identified Additional Opportunities Range: $0.20 - $0.30 Full year
of base contribution from FCG & financing Range: Dilution from $5.33 $0.35 - $0.45 incremental shares to Continued growth ~ $(1.00) 2023 $5.45 from legacy businesses Adjusted 2024 1/ EPS Adjusted Range: 1/ EPS $0.40 - $0.50 Target Range 1/
Diluted Earnings Per Share Growth from Continuing Operations; 2023 excludes transaction-related costs associated with the FCG acquisition 17 2/ The actual contributions of each category, as well as others not defined above, may vary

Executing on the Identified 2024 Pathway Our team has already begun to
execute on additional opportunities to propel earnings growth in 2024 and will continue to evaluate and execute opportunities Regulatory Post acquisition synergies strategies & financing Payroll savings due to multiple leadership roles not
opportunities joining CPK as well as NextEra allocated costs being eliminated Technology enhancements Synergies and efficiencies will Executed on additional opportunities We are provide a Cost and already bringing: operating significant Asset on the
synergies & Additional margin Expense savings optimization contribution to pathway efficiencies / utilization Accelerating project in-service Operating costs savings our 2024 for dates and executing new service across CPK enterprise agreements
2024 earnings New margin through the Acceleration of value chain Identified new projects with the potential for infrastructure programs / new a 2024 impact capital projects Three projects planned to connect locally produced landfill RNG to
FCG’s system 18 1/ The actual contributions of each opportunity category, as well as others not defined above, may vary

Long Track Record of Growing Capital Expenditures We reaffirm our
previous capital investment plan guidance of $1.5B-$1.8B by 2028. ~$300-$360M/yr. run rate ($1.5B-$1.8B 5-yr plan) $927 ~$150-$250M/yr. avg. $283 ~$75-$100M/yr. avg. $228 $195 $196 $199 $192 $169 $141 ~$50M/ $108 yr. avg. $98 $240 $211 $78 $193 $180
$174 $174 $169 $49 $144 $44 $130 $98 $92 $78 $47 $44 Capital investments Acquisitions Hurricane Michael 19 Amounts in chart reflected in millions

5-year Projected Capital Expenditures Breakdown 89% of our 5-year
capital expenditure plan is projected to be invested into our regulated businesses. Key Drivers of Investment Plan Regulated / Unregulated Forecast • Investment in natural gas distribution systems to serve growing customer base and ensure
safety and reliability (both legacy systems and FCG) Capital Spend 2024-2028 • Investment in gas transmission pipelines to support the utility systems, 11% serve large users and uphold safety and reliability, including pipeline opportunities
related to the FCG acquisition • Investments in our unregulated operating business to support continued growth • Investments in sustainable energy, such as pipelines and interconnects, to create a pathway to market for sustainable fuels
• Investments in technology to support enterprise resource planning and other systems necessary to support growth Regulated 5-Year Projected Capital Spend Type 89% Investment Range (in millions) Unregulated/Other Regulated Distribution Growth
$600 - $645 Regulated Transmission Growth $435 - $590 Regulated Infrastructure $300 - $340 Unregulated $140 - $165 Technology $70 - $90 20

Capital Structure Overview – Strong Balance Sheet to Support
Growth (in thousands) 12/31/2023 12/31/2022 FCG Acquisition Permanent Financing Stockholders' equity $ 1 ,246,104 $ 832,801 Strong Balance Sheet Pre-FCG Long-term debt, net of current maturities 1,187,075 578,388 53% Equity to Capitalization at
9/30/23 Total permanent capitalization $ 2,433,179 $ 1,411,189 New Long-Term Debt • $550M: Issued in Nov 2023 Current portion of long-term debt 1 8,505 21,483 • ~6.5% Avg. Interest Rate Short-term debt 1 79,853 202,157 • 6 tranches
with tenors from 3-15 yrs Total capitalization and short-term financing $ 2 ,631,537 $ 1 ,634,829 New CPK Equity • ~4.4M: New shares in Nov 2023 Equity to Permanent Capital 51.2% 59.0% • ~$380M Gross proceeds Equity to Total
Capitalization 47.4% 50.9% Long-Term Debt New Long-Term Debt Issuance $ 6 30,000 $ 50,000 • ~$1.2B with an Average Interest Rate <5% Net New Equity Issuances $ 371,508 $ 8 ,916 Short-Term Debt Stockholders’ Equity increased $413M
since the end of 2022 primarily driven by: • $375M Facility with ~$180M outstanding • Permanent Equity Financing for the Florida City Gas Acquisition of ~$366M • 1 year tranche: $175M, SOFR +0.75% • Strong Net Income
performance of ~$87M • 5 year tranche: $200M, SOFR + 0.95% • Dividend Reinvestment and Stock Compensation Plans increases of ~$5M • Maintaining a $50M interest rate swap at • Reduced by Continued Dividend payments of ~$44M
3.98% through September 2025 21

Long-Term Debt Profile – Positioned to Execute Growth Plan (In
Millions) Minimal maturities over next 2 yrs enables CPK the flexibility to: • Execute on a robust growing organic capital plan • Fully integrate Florida City Gas and capitalize on commercial synergies & opportunities •
Navigate through the uncertain economic environment 22
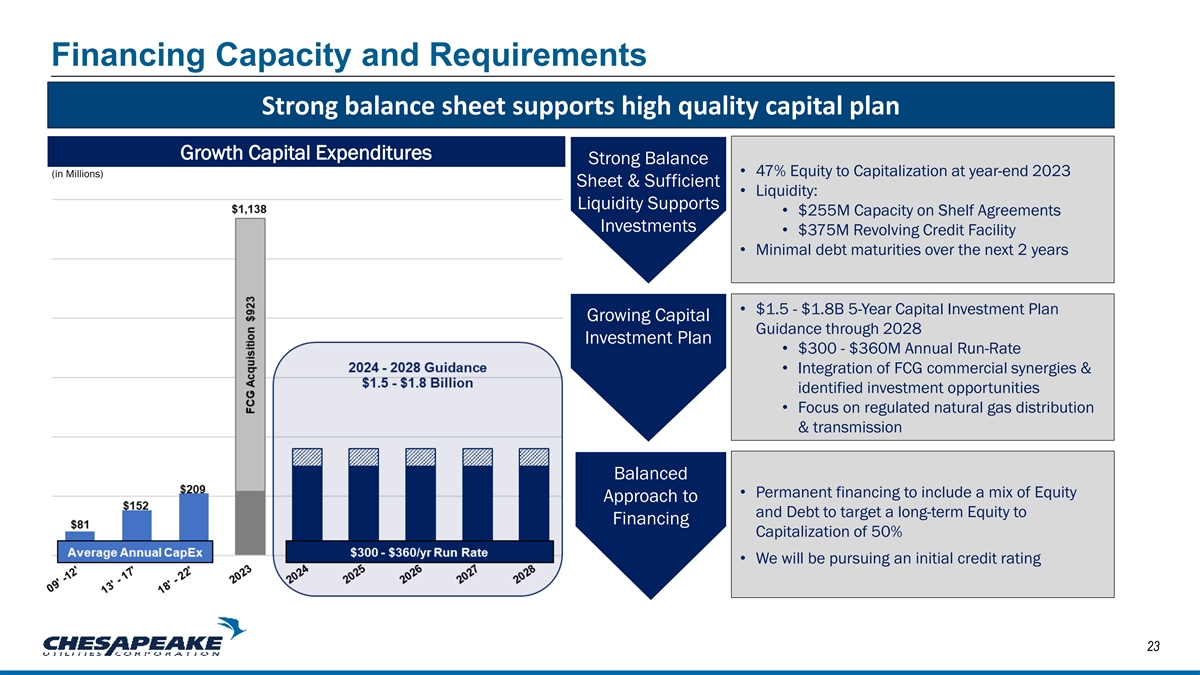
Financing Capacity and Requirements Strong balance sheet supports high
quality capital plan Growth Capital Expenditures Strong Balance • 47% Equity to Capitalization at year-end 2023 (in Millions) Sheet & Sufficient • Liquidity: Liquidity Supports • $255M Capacity on Shelf Agreements Investments
• $375M Revolving Credit Facility • Minimal debt maturities over the next 2 years • $1.5 - $1.8B 5-Year Capital Investment Plan Growing Capital Guidance through 2028 Investment Plan • $300 - $360M Annual Run-Rate •
Integration of FCG commercial synergies & identified investment opportunities • Focus on regulated natural gas distribution & transmission Balanced • Permanent financing to include a mix of Equity Approach to and Debt to target a
long-term Equity to Financing Capitalization of 50% • We will be pursuing an initial credit rating 23

Regulatory Strategy Drives Earnings Florida Public Utilities Florida
Public Utilities and Florida City Gas • GUARD and SAFE programs – combined projected capital • Rates became effective March 1, 2023 investment of $410 million over a 10-year period • $17.2 million rate increase; allowed ROE
of 10.25% and equity percentage of 55% • Programs enhance the safety, reliability and accessibility of • Consolidated four natural gas distribution entities portions of our Florida natural gas distribution systems Florida City Gas
Florida Public Utilities-Electric • Rates became effective May 1, 2023 • Storm Protection Plan and Storm Protection Plan Cost Recovery mechanisms • $14.1 million rate increase; allowed ROE of 8.5%- 10.5% • Capital investment
of over $8 million for 2023 with continued • Reserve surplus amortization mechanism authorizes investment going forward FPU Natural Gas FCG to earn within its approved ROE range Maryland LDCs Eastern Shore Natural Gas • No specified
limit on capital investment or time frame • Rate case filed January 30, 2024 • Recovery mechanism for capital costs associated with • Propose consolidating our three MD distribution companies mandated highway and railroad relocate
projects and compliance with new PHMSA regulations requiring the • Separately filed combined depreciation studies replacement of existing ESNG facilities 24 Rate Case Initiatives Infrastructure Programs

Rate Case: Maryland Natural Gas Distribution Maryland rate case seeking
to consolidate our three Maryland distribution entities 1/ and obtain a rate increase for the first time in 16 years Rate case filed on January 30, 2024 • Required come-back filing • Proposing a $6.9M rate increase • Seeking to
consolidate our three MD natural gas distribution 2/ entities into one legal entity – Chesapeake Utilities of Maryland • Proposing certain other tariff changes, including: • establishing a new technology cost recovery rider,
• rolling certain investments into base rates, • establishing a regulatory asset for an anticipated energy efficiency filing, and • establishing an under-served area (USA) rate and a program for evaluating extensions to
multi-family projects • Separately filed a consolidated depreciation study to revise depreciation rates on a consolidated basis 1/ In 2019, prior to being acquired by CPK, Elkton Gas was approved for a rate increase of approximately $90.5K;
prior to that, Elkton had not increased rates since 2008. 25 2/ Currently: Chesapeake Utilities-Maryland Division, Sandpiper Energy, Inc. and Elkton Gas Company

Federal Certificate Proceeding: Worcester Resiliency Upgrade Eastern
Shore Natural Gas project designed to meet critical energy service to customers during the peak winter heating season • $80 million planned liquefied natural gas storage facility in Bishopville, MD • Project consists of five low-profile
horizontal storage tanks allowing for up to 0.5 million gallons of storage plus pipeline looping and additional upgrades • Improvements will help protect against weather-related disruptions, keeping energy prices affordable • 30-year
agreements with customers July 2023 April 2024 October 2023 ESNG held a FERC’s public Open House Environmental 3Q 2025 information held by ESNG Assessment session for the for the local anticipated to Anticipated in- local community community
be issued service date August 2023 December December 2023 2024 ESNG files project Public scoping FERC’s application with session for the issuance of 1/ FERC local community Order held by FERC authorizing the project anticipated 26 1/ FERC =
Federal Energy Regulatory Commission

Chesapeake Utilities’ Hydrogen Focus and Near-term Initiatives
Hydrogen has the potential to become a more common fuel source in the lower-carbon energy future CPK has a two-part strategy to help educate and Developing the foundation for the long-term: further hydrogen’s potential as a common fuel source:
✓ Our Marlin Gas Services subsidiary has invested in hydrogen transport Near- and Medium- Long-Term trailers Terms ✓ Marlin transported hydrogen for blending with natural gas at our Eight Flags CHP facility to demonstrate hydrogen is a
viable option for •Helping to •Provide industrial gas users shape hydrogen to end- 1/ hydrogen’s users or for ✓ CPK is an active participant in the Mid-Atlantic Clean Hydrogen Hub – potential to industrial TM MACH2 .
Our role involves: become a processes ▪ Promoting safety and workforce development common fuel though service source in the contracts that through awareness, training and education at our state-of-the- future by align with CPK’s art
Safety Town facility in Dover, DE fostering safety, long-standing awareness, strategy to ▪ Evaluating hydrogen production and delivery to the transportation training, provide energy sector education and that supports a community more ✓
Partnering with higher level educational institutions in multiple service involvement and sustainable territories to advance R&D initiatives conducting real- future world testing ✓ Utilize Safety Town to test hydrogen on company assets,
such as pipes, meters and valves to lead to greater understanding and expansion of hydrogen use Initiatives will continue to evolve as a greater amount of R&D related to hydrogen is conducted and legislation and regulation continue to evolve. 1/
TM 27 MACH2 is a collaboration between Delaware, southern New Jersey and southeastern Pennsylvania, which was awarded federal funding up to $750 million in October 2023, one- third of which is estimated to be allocated to Delaware

Chesapeake Utilities – A Culture of Safety and Innovation First
and foremost, we are focused on the safety of our Our special culture nurtures an entrepreneurial, people, the communities we serve and the reliability of innovative and competitive market mindset across the our systems organization • Our
Safety Data Management System was implemented in • As construction of our first dairy manure RNG facility at Full 2023 and rolled out to all employees in early 2024 Circle Dairy (Lee, Florida) is underway, we are introducing groundbreaking
technology - a fully contained CNG/RNG • We broke ground on our second Safety Town, located in fueled self-contained farm irrigation and waste pumping unit DeBary, Florida, on January 31, 2024 • The unit, expected to be delivered to the
facility in March 2024, opens future opportunities for farms looking to convert equipment to be CNG/RNG-fueled • More information on our safety programs, initiatives, and progress made towards achieving our safety targets will be available in
our upcoming Safety and Reliability report 28

Investment Proposition – Committed to Superior Performance We
continually increase shareholder value Our foundation for growth remains strong through our: Over and over, we have proven we get it done; we have a long history of top-tier earnings and dividend growth TRACK • Consistently beating
expectations, recording 17 years of consecutive earnings per share growth* and 20 RECORD consecutive years of increasing the dividend We have the expertise to balance project development and execution ENERGIZED • Our team prioritizes our
people, our customers, our assets and our communities while striving to deliver growth TEAM and value for our stakeholders We are steadfast in our commitment to top quartile earnings performance & maintaining a strong balance sheet FINANCIAL
• Providing EPS guidance for 2024 between $5.33 to $5.45 and reaffirming our targeted 2025 EPS between DISCIPLINE $6.15 to $6.35, growing to $7.75 to $8.00 by 2028, an 8% CAGR over the period We identify and execute steady, return-oriented
capital investments across our business units PLATFORMS • Building on our most recent five-year expenditures of $1.9 billion, our cap ex guidance of $1.5 billion to $1.8 FOR GROWTH billion through 2028, driven by our legacy businesses and
benefits from Florida City Gas acquisition 29 * Earnings per share growth excludes TCJA impact in 2017; 2023 excludes transaction-related costs associated with the FCG acquisition

CHE S AP EAKE UT IL ITIES Appendix CORP ORAT ION 30

GAAP to Non-GAAP Reconciliation – Consolidated Results Fourth
Quarter Change Fiscal Year Change (in thousands) 2023 2022 $ % 2023 2022 $ % Operating Revenues $ 1 85,335 $ 187,300 $ (1,965) -1.0% $ 6 70,604 $ 680,704 $ (10,100) -1.5% Cost of Sales: Natural gas, propane and electric costs ( 55,004) (72,003)
16,999 -23.6% ( 216,481) (260,506) 4 4,025 -16.9% Depreciation & amortization ( 13,404) (17,441) 4 ,037 -23.1% (65,501) (68,973) 3 ,472 -5.0% 1 Operations &maintenance expense ( 11,395) ( 17,589) 6 ,194 -35.2% ( 58,649) (65,288) 6,639 -10.2%
Gross Margin (GAAP) 105,532 8 0,267 25,265 31.5% 3 29,973 285,937 44,036 15.4% 1 Operations &maintenance expense 11,395 1 7,589 (6,194) -35.2% 58,649 6 5,288 (6,639) -10.2% Depreciation & amortization 1 3,404 17,441 (4,037) -23.1% 65,501
68,973 (3,472) -5.0% Adjusted Gross Margin (non-GAAP) $ 130,331 $ 1 15,297 $ 1 5,034 13.0% $ 4 54,123 $ 420,198 $ 33,925 8.1% 1 Operations & maintenance expenses within the Consolidated Statements of Income are presented in accordance with
regulatory requirements and to provide comparability within the industry. Operations & maintenance expenses which are deemed to be directly attributable to revenue producing activities have been separately presented above in order to calculate
Gross Margin as defined under US GAAP. See Chesapeake Utilities’ Annual Report on Form 10-K for the year ended December 31, 2022 for additional details. 31

GAAP to Non-GAAP Reconciliation – Regulated Energy Segment Fourth
Quarter Change Fiscal Year Change (in thousands) 2023 2022 $ % 2023 2022 $ % Operating Revenues $ 127,774 $ 1 18,360 $ 9 ,414 8.0% $ 473,595 $ 4 29,424 $ 4 4,171 10.3% Cost of Sales: Natural gas, propane and electric costs ( 34,316) ( 38,908) 4,592
-11.8% ( 140,008) ( 127,172) (12,836) 10.1% Depreciation & amortization ( 8,982) (13,211) 4,229 -32.0% (48,162) (52,707) 4 ,545 -8.6% 1 Operations &maintenance expense ( 3,868) (9,779) 5 ,911 -60.4% ( 27,485) (35,472) 7 ,987 -22.5% Gross
Margin (GAAP) 80,608 56,462 24,146 42.8% 2 57,940 214,073 43,867 20.5% 1 Operations &maintenance expense 3,868 9,779 (5,911) -60.4% 2 7,485 3 5,472 (7,987) -22.5% Depreciation & amortization 8,982 13,211 (4,229) -32.0% 48,162 52,707 ( 4,545)
-8.6% Adjusted Gross Margin (non-GAAP) $ 93,458 $ 7 9,452 $ 14,006 17.6% $ 333,587 $ 302,252 $ 31,335 10.4% 1 Operations & maintenance expenses within the Consolidated Statements of Income are presented in accordance with regulatory requirements
and to provide comparability within the industry. Operations & maintenance expenses which are deemed to be directly attributable to revenue producing activities have been separately presented above in order to calculate Gross Margin as defined
under US GAAP. See Chesapeake Utilities’ Annual Report on Form 10-K for the year ended December 31, 2022 for additional details. 32

GAAP to Non-GAAP Reconciliation – Unregulated Energy Segment
Fourth Quarter Change Fiscal Year Change (in thousands) 2023 2022 $ % 2023 2022 $ % Operating Revenues $ 6 4,262 $ 78,081 $ (13,819) -17.7% $ 2 23,148 $ 2 80,750 $ (57,602) -20.5% Cost of Sales: Natural gas, propane and electric costs ( 27,424) (
42,207) 1 4,783 -35.0% (102,492) ( 162,683) 60,191 -37.0% Depreciation & amortization ( 4,424) ( 4,232) (192) 4.5% (17,347) ( 16,257) ( 1,090) 6.7% 1 Operations &maintenance expense ( 7,573) ( 8,114) 541 -6.7% (31,507) ( 29,825) (1,682) 5.6%
Gross Margin (GAAP) 2 4,841 23,528 1 ,313 5.6% 7 1,802 71,985 ( 183) -0.3% 1 Operations &maintenance expense 7,573 8 ,114 (541) -6.7% 31,507 2 9,825 1,682 5.6% Depreciation & amortization 4 ,424 4 ,232 192 4.5% 17,347 16,257 1,090 6.7%
Adjusted Gross Margin (non-GAAP) $ 3 6,838 $ 35,874 $ 964 2.7% $ 1 20,656 $ 118,067 $ 2,589 2.2% 1 Operations & maintenance expenses within the Consolidated Statements of Income are presented in accordance with regulatory requirements and to
provide comparability within the industry. Operations & maintenance expenses which are deemed to be directly attributable to revenue producing activities have been separately presented above in order to calculate Gross Margin as defined under US
GAAP. See Chesapeake Utilities’ Annual Report on Form 10-K for the year ended December 31, 2022 for additional details. 33

GAAP to Non-GAAP Reconciliation – Adjusted Net Income and EPS
Fourth Quarter Fiscal Year (in thousands, except shares and per share data) 2023 2022 2023 2022 Net Income (GAAP) $ 25,328 $ 2 6,150 $ 8 7,212 $ 8 9,796 1 Transaction-related expenses, net 7 ,727 - 10,625 - Adjusted Net Income (Non-GAAP) $ 3 3,055 $
2 6,150 $ 97,837 $ 8 9,796 Weighted average common shares outstanding - diluted 20,178,402 17,825,935 18,434,857 17,804,294 Earnings Per Share - Diluted (GAAP) $ 1 .26 $ 1 .47 $ 4.73 $ 5 .04 1 Transaction-related expenses, net 0.38 - 0.58 - Adjusted
Earnings Per Share - Diluted (Non-GAAP) $ 1.64 $ 1.47 $ 5.31 $ 5.04 1 Transaction-related expenses represent costs incurred attributable to the announced acquisition of FCG including, but not limited to, legal, consulting, audit and financing fees.
34

Weather Impacted Customer Consumption During 2023 Year Ended Variance
December 31, Year-over-Year Delmarva 2023 2022 # % Exceptionally Warm Weather Across Actual HDD 3,416 4,088 (672) -16% All Service Areas 10-yr Avg HDD (“Normal”) 4,161 4,147 14 # (745) (59) Variance from Normal % -18% • Warmer
temperatures throughout the year have significantly impacted our earnings Year Ended Variance December 31, Year-over-Year Ohio 2023 2022 # % • More significant impact on Delmarva and in Ohio given the heat load in our northern service areas
Actual HDD 5,043 5,532 (489) -9% 10-yr Avg HDD (“Normal”) 5,594 5,557 37 • Mitigating actions to overcome warmer weather have included: # (551) (25) Variance from Normal % -10% • regulatory initiatives including changes in
rate design Year Ended Variance • organic growth December 31, Year-over-Year Florida • increased propane margins and fees 2023 2022 # % • contributions from FCG Actual HDD 664 836 (172) -21% 10-yr Avg HDD (“Normal”) 826
828 (2) # (162) 8 Variance from Normal % -20% 35

Key Drivers of Performance – Quarter Ended December 31, 2023
Lower Reduced customer Depreciation, demand consumption amortization for Operating Core related to CNG/LNG/ and property Florida City business expenses Reduction warmer RNG tax costs due Interest Absence Gas (excluding growth (not in state tax
weather interest and other to new acquisition impacted by FCG) rate income 3/ capital changes weather and from federal investments income tax excluding 2/ refund FCG) Q4 Q4 2023 2022 $0.05 net impact from one-time, non- recurring items 1/ See
appendix for GAAP to non-GAAP reconciliation for adjusted diluted earnings per share 2/ Includes a benefit from RSAM of $5.1 million, pre-tax, or $0.19 per share 36 3/ Does not include RSAM benefit, which is included in depreciation
expense

Quarterly Earnings Cadence* Adjusted EPS FY Year Q1 Q2 Q3 Q4 2023 $2.04
$0.90 $0.69* $1.64 $5.31 38% 17% 13% 31% % of FY 2022 $2.08 $0.96 $0.54 $1.47 $5.04 % of FY 41% 19% 11% 29% 2021 $1.96 $0.78 $0.71 $1.28 $4.73 % of FY 41% 16% 15% 27% $1.77 $0.64 $0.56 $1.24 $4.21 2020 % of FY 42% 15% 13% 29% 2019 $1.75 $0.54 $0.38
$1.04 $3.72** % of FY 47% 15% 10% 28% 5yr % Band 38% - 47% 15% - 19% 10% - 15% 27% - 31% Note: Historic Adjusted EPS presented from continuing operations *Beginning in the third quarter of 2023, the Company’s earnings per share metric was
adjusted to exclude transaction-related expenses attributable to the announced acquisition of FCG including, but not limited to, legal, consulting, audit and financing fees. 37 **The sum of the four quarters does not equal the full year amount due
to rounding and the impact of average share counts

Mission, Vision and Values OUR Mission We deliver energy that makes
life better for the people and communities we serve. OUR Vision We will be a leader in delivering energy that contributes to a sustainable future. OUR Values Care Integrity Excellence We put people first. We tell the truth. We achieve great things
Keep them safe. Build trusting Ensure moral and together. relationships. Foster a culture of ethical principles drive our Hold each other accountable to do equity, diversity and inclusion. decision-making. Do the right thing the work that makes us
better, Make a meaningful difference even when no one is watching. every day. Never give up. everywhere we live and work. 38
v3.24.0.1
| X |
- DefinitionBoolean flag that is true when the XBRL content amends previously-filed or accepted submission.
| Name: |
dei_AmendmentFlag |
| Namespace Prefix: |
dei_ |
| Data Type: |
xbrli:booleanItemType |
| Balance Type: |
na |
| Period Type: |
duration |
|
| X |
- DefinitionFor the EDGAR submission types of Form 8-K: the date of the report, the date of the earliest event reported; for the EDGAR submission types of Form N-1A: the filing date; for all other submission types: the end of the reporting or transition period. The format of the date is YYYY-MM-DD.
| Name: |
dei_DocumentPeriodEndDate |
| Namespace Prefix: |
dei_ |
| Data Type: |
xbrli:dateItemType |
| Balance Type: |
na |
| Period Type: |
duration |
|
| X |
- DefinitionThe type of document being provided (such as 10-K, 10-Q, 485BPOS, etc). The document type is limited to the same value as the supporting SEC submission type, or the word 'Other'.
| Name: |
dei_DocumentType |
| Namespace Prefix: |
dei_ |
| Data Type: |
dei:submissionTypeItemType |
| Balance Type: |
na |
| Period Type: |
duration |
|
| X |
- DefinitionAddress Line 1 such as Attn, Building Name, Street Name
| Name: |
dei_EntityAddressAddressLine1 |
| Namespace Prefix: |
dei_ |
| Data Type: |
xbrli:normalizedStringItemType |
| Balance Type: |
na |
| Period Type: |
duration |
|
| X |
- Definition
+ References
+ Details
| Name: |
dei_EntityAddressCityOrTown |
| Namespace Prefix: |
dei_ |
| Data Type: |
xbrli:normalizedStringItemType |
| Balance Type: |
na |
| Period Type: |
duration |
|
| X |
- DefinitionCode for the postal or zip code
| Name: |
dei_EntityAddressPostalZipCode |
| Namespace Prefix: |
dei_ |
| Data Type: |
xbrli:normalizedStringItemType |
| Balance Type: |
na |
| Period Type: |
duration |
|
| X |
- DefinitionName of the state or province.
| Name: |
dei_EntityAddressStateOrProvince |
| Namespace Prefix: |
dei_ |
| Data Type: |
dei:stateOrProvinceItemType |
| Balance Type: |
na |
| Period Type: |
duration |
|
| X |
- DefinitionA unique 10-digit SEC-issued value to identify entities that have filed disclosures with the SEC. It is commonly abbreviated as CIK. Reference 1: http://www.xbrl.org/2003/role/presentationRef
-Publisher SEC
-Name Exchange Act
-Number 240
-Section 12
-Subsection b-2
| Name: |
dei_EntityCentralIndexKey |
| Namespace Prefix: |
dei_ |
| Data Type: |
dei:centralIndexKeyItemType |
| Balance Type: |
na |
| Period Type: |
duration |
|
| X |
- DefinitionIndicate if registrant meets the emerging growth company criteria. Reference 1: http://www.xbrl.org/2003/role/presentationRef
-Publisher SEC
-Name Exchange Act
-Number 240
-Section 12
-Subsection b-2
| Name: |
dei_EntityEmergingGrowthCompany |
| Namespace Prefix: |
dei_ |
| Data Type: |
xbrli:booleanItemType |
| Balance Type: |
na |
| Period Type: |
duration |
|
| X |
- DefinitionCommission file number. The field allows up to 17 characters. The prefix may contain 1-3 digits, the sequence number may contain 1-8 digits, the optional suffix may contain 1-4 characters, and the fields are separated with a hyphen.
| Name: |
dei_EntityFileNumber |
| Namespace Prefix: |
dei_ |
| Data Type: |
dei:fileNumberItemType |
| Balance Type: |
na |
| Period Type: |
duration |
|
| X |
- DefinitionTwo-character EDGAR code representing the state or country of incorporation.
| Name: |
dei_EntityIncorporationStateCountryCode |
| Namespace Prefix: |
dei_ |
| Data Type: |
dei:edgarStateCountryItemType |
| Balance Type: |
na |
| Period Type: |
duration |
|
| X |
- DefinitionThe exact name of the entity filing the report as specified in its charter, which is required by forms filed with the SEC. Reference 1: http://www.xbrl.org/2003/role/presentationRef
-Publisher SEC
-Name Exchange Act
-Number 240
-Section 12
-Subsection b-2
| Name: |
dei_EntityRegistrantName |
| Namespace Prefix: |
dei_ |
| Data Type: |
xbrli:normalizedStringItemType |
| Balance Type: |
na |
| Period Type: |
duration |
|
| X |
- DefinitionThe Tax Identification Number (TIN), also known as an Employer Identification Number (EIN), is a unique 9-digit value assigned by the IRS. Reference 1: http://www.xbrl.org/2003/role/presentationRef
-Publisher SEC
-Name Exchange Act
-Number 240
-Section 12
-Subsection b-2
| Name: |
dei_EntityTaxIdentificationNumber |
| Namespace Prefix: |
dei_ |
| Data Type: |
dei:employerIdItemType |
| Balance Type: |
na |
| Period Type: |
duration |
|
| X |
- DefinitionLocal phone number for entity.
| Name: |
dei_LocalPhoneNumber |
| Namespace Prefix: |
dei_ |
| Data Type: |
xbrli:normalizedStringItemType |
| Balance Type: |
na |
| Period Type: |
duration |
|
| X |
- DefinitionBoolean flag that is true when the Form 8-K filing is intended to satisfy the filing obligation of the registrant as pre-commencement communications pursuant to Rule 13e-4(c) under the Exchange Act. Reference 1: http://www.xbrl.org/2003/role/presentationRef
-Publisher SEC
-Name Exchange Act
-Number 240
-Section 13e
-Subsection 4c
| Name: |
dei_PreCommencementIssuerTenderOffer |
| Namespace Prefix: |
dei_ |
| Data Type: |
xbrli:booleanItemType |
| Balance Type: |
na |
| Period Type: |
duration |
|
| X |
- DefinitionBoolean flag that is true when the Form 8-K filing is intended to satisfy the filing obligation of the registrant as pre-commencement communications pursuant to Rule 14d-2(b) under the Exchange Act. Reference 1: http://www.xbrl.org/2003/role/presentationRef
-Publisher SEC
-Name Exchange Act
-Number 240
-Section 14d
-Subsection 2b
| Name: |
dei_PreCommencementTenderOffer |
| Namespace Prefix: |
dei_ |
| Data Type: |
xbrli:booleanItemType |
| Balance Type: |
na |
| Period Type: |
duration |
|
| X |
- DefinitionTitle of a 12(b) registered security. Reference 1: http://www.xbrl.org/2003/role/presentationRef
-Publisher SEC
-Name Exchange Act
-Number 240
-Section 12
-Subsection b
| Name: |
dei_Security12bTitle |
| Namespace Prefix: |
dei_ |
| Data Type: |
dei:securityTitleItemType |
| Balance Type: |
na |
| Period Type: |
duration |
|
| X |
- DefinitionName of the Exchange on which a security is registered. Reference 1: http://www.xbrl.org/2003/role/presentationRef
-Publisher SEC
-Name Exchange Act
-Number 240
-Section 12
-Subsection d1-1
| Name: |
dei_SecurityExchangeName |
| Namespace Prefix: |
dei_ |
| Data Type: |
dei:edgarExchangeCodeItemType |
| Balance Type: |
na |
| Period Type: |
duration |
|
| X |
- DefinitionBoolean flag that is true when the Form 8-K filing is intended to satisfy the filing obligation of the registrant as soliciting material pursuant to Rule 14a-12 under the Exchange Act. Reference 1: http://www.xbrl.org/2003/role/presentationRef
-Publisher SEC
-Name Exchange Act
-Section 14a
-Number 240
-Subsection 12
| Name: |
dei_SolicitingMaterial |
| Namespace Prefix: |
dei_ |
| Data Type: |
xbrli:booleanItemType |
| Balance Type: |
na |
| Period Type: |
duration |
|
| X |
- DefinitionTrading symbol of an instrument as listed on an exchange.
| Name: |
dei_TradingSymbol |
| Namespace Prefix: |
dei_ |
| Data Type: |
dei:tradingSymbolItemType |
| Balance Type: |
na |
| Period Type: |
duration |
|
| X |
- DefinitionBoolean flag that is true when the Form 8-K filing is intended to satisfy the filing obligation of the registrant as written communications pursuant to Rule 425 under the Securities Act. Reference 1: http://www.xbrl.org/2003/role/presentationRef
-Publisher SEC
-Name Securities Act
-Number 230
-Section 425
| Name: |
dei_WrittenCommunications |
| Namespace Prefix: |
dei_ |
| Data Type: |
xbrli:booleanItemType |
| Balance Type: |
na |
| Period Type: |
duration |
|
Chesapeake Utilities (NYSE:CPK)
Historical Stock Chart
From Mar 2024 to Apr 2024

Chesapeake Utilities (NYSE:CPK)
Historical Stock Chart
From Apr 2023 to Apr 2024
