false
0001169770
0001169770
2024-01-25
2024-01-25
0001169770
us-gaap:CommonStockMember
2024-01-25
2024-01-25
0001169770
banc:DepositarySharesEachRepresenting140Member
2024-01-25
2024-01-25
iso4217:USD
xbrli:shares
iso4217:USD
xbrli:shares
UNITED STATES
SECURITIES AND EXCHANGE COMMISSION
Washington, DC 20549
FORM 8-K
in
Pursuant to Section 13 or 15(d) of the
Securities Exchange Act of 1934
Date of Report (Date of earliest event reported):
January 25, 2024
BANC OF CALIFORNIA, INC.
(Exact name of registrant as specified in its
charter)
| Maryland |
001-35522 |
04-3639825 |
(State or other jurisdiction
of incorporation) |
(Commission
File Number) |
(IRS Employer
Identification No.) |
11611
San Vicente Boulevard, Suite 500 |
|
| Los Angeles,
California |
90049 |
| (Address
of principal executive offices) |
(Zip
Code) |
Registrant’s telephone number, including
area code: (855) 361-2262
N/A
(Former name or former address, if changed
since last report)
Check the appropriate box below if the Form 8-K filing is intended
to simultaneously satisfy the filing obligation of the registrant under any of the following provisions (see General Instruction A.2.):
| ¨ | Written
communications pursuant to Rule 425 under the Securities Act (17 CFR 230.425) |
| | |
| ¨ | Soliciting
material pursuant to Rule 14a-12 under the Exchange Act (17 CFR 240.14a-12) |
| | |
| ¨ | Pre-commencement
communications pursuant to Rule 14d-2(b) under the Exchange Act (17 CFR 240.14d-2(b)) |
| | |
| ¨ | Pre-commencement
communications pursuant to Rule 13e-4(c) under the Exchange Act (17 CFR 240.13e-4(c)) |
Indicate by check mark whether the registrant is an emerging growth
company as defined in Rule 405 of the Securities Act of 1933 (§230.405 of this chapter) or Rule 12b-2 of the Securities Exchange
Act of 1934 (§240.12b-2 of this chapter).
Emerging growth company ¨
If an emerging growth company, indicate by check mark if the registrant
has elected not to use the extended transition period for complying with any new or revised financial accounting standards provided pursuant
to Section 13(a) of the Exchange Act. ¨
Securities registered pursuant to Section 12(b) of the Act:
| Title
of each class |
|
Trading
Symbol(s) |
|
Name
of each exchange
on which registered |
| Common Stock, par value
$0.01 per share |
|
BANC |
|
New York Stock Exchange |
| Depositary Shares, each representing a 1/40th interest
in a share of 7.75% fixed rate reset non-cumulative perpetual preferred stock, Series F |
|
BANC/PF |
|
New York Stock Exchange |
Item 2.02 Results of Operations and Financial Condition.
On January 25, 2024, Banc of California, Inc. (the “Company”)
issued a press release announcing 2023 fourth quarter financial results.
A copy of the press release is attached to this report as Exhibit
99.1 and is incorporated by reference herein.
Item 7.01 Regulation FD Disclosure.
The Company will host a conference call to discuss its fourth
quarter results at 10:00 A.M. Pacific Time on Thursday, January 25, 2024. Interested parties may attend the conference call by
dialing (888) 317-6003, and referencing event code 4864870. A live audio webcast will be available through the webcast link to be
posted on the Company’s Investor Relations website at www.bancofcal.com/investor, in addition to the slide presentation
for investor review prior to the call. A copy of the presentation materials is attached to this report as Exhibit 99.2 and is
incorporated by reference herein.
Item 9.01 Financial Statements and Exhibits.
(d) Exhibits.
| 104 | Cover Page Interactive Data File (embedded within the Inline
XBRL document) |
SIGNATURES
Pursuant to the requirements of the Securities Exchange Act of 1934,
the registrant has duly caused this report to be signed on its behalf by the undersigned hereunto duly authorized.
| |
BANC OF CALIFORNIA,
INC. |
| |
|
| January 25, 2024 |
/s/
Joseph Kauder |
| |
Joseph Kauder |
| |
Executive Vice President and Chief Financial
Officer |
Exhibit 99.1

Banc
of California, Inc. Reports Fourth Quarter 2023 Financial Results Following Completion of Transformational Merger with PacWest Bancorp
Company Release - 1/25/2024

LOS ANGELES, Calif.--(BUSINESS WIRE)--Banc of California, Inc.
(NYSE: BANC) (“Banc of California”), parent of wholly-owned subsidiary Banc of California (the “Bank”), today
reported financial results for the fourth quarter and year ended December 31, 2023. On November 30, 2023, Banc of California
and PacWest Bancorp closed their transformational merger, creating California’s premier business bank. As of December 31,
2023, Banc of California had total assets of $38.5 billion.
Fourth quarter highlights include:
| ● | As
a result of the impact of the merger and the balance sheet repositioning, total assets
of $38.5 billion increased $1.7 billion and total loans increased $3.6 billion, or 16% from
the prior quarter, resulting in a year-end loans to deposits ratio of 84%. |
| ● | Total
deposits of $30.4 billion increased $3.8 billion, an increase of 14% from the prior quarter,
and noninterest-bearing deposits of $7.8 billion increased $2.2 billion, or 39% from the
prior quarter. Borrowings decreased $3.4 billion, or 54% from the prior quarter. |
“Following the merger with PacWest, we have
created California’s premier relationship-focused business bank.”
– Jared
Wolff
President & CEO
| ● | Completed
asset sales of $6.1 billion and completed paydown of $8.6 billion high-cost funding related
to the balance sheet repositioning, which improved the mix of earning assets and reduced
higher cost funding. Wholesale fundings as a percentage of total assets down to 17%, compared
to 28% in the prior quarter. |
| ● | Improved
overall deposit mix, with the period-end noninterest-bearing deposit percentage increasing
from 21% of total deposits at the prior quarter-end to 26% at year-end and brokered time
deposits decreasing from 15% of total deposits at the prior quarter-end to 12% at year-end. |
| ● | Significant
decrease in unrealized losses on securities, with unrealized losses in accumulated other
comprehensive income (“AOCI”) of $434 million at year-end compared to $879 million
at the prior quarter-end, resulting from security sales and decreased market forward rates
in the fourth quarter. |
| ● | High
liquidity levels, with immediately available on-balance sheet liquidity and unused borrowing
capacity of $17.2
billion, which was 2.5 times greater than uninsured and uncollateralized deposits. Cash as
a percentage of total assets was 14%, down from 17% in the prior quarter. |
 | 1 |
| ● | Strong
capital ratios well above the regulatory thresholds for "well capitalized"
banks, including an estimated 16.40%
Total risk-based capital ratio, 12.42% Tier
1 capital ratio, 10.12% CET1 capital ratio and 9.00%
Tier 1 leverage ratio. |
| ● | Allowance
for credit losses of 1.22%, up from 1.15% at the prior quarter-end after a provision
for credit losses of $47.0 million, which includes a $22.2 million initial provision related
to non-purchased credit deteriorated (“non-PCD”) loan balances. |
| ● | Strong
credit quality, with year-end nonperforming loans to total loans at 0.29%, down from
0.57% at the prior quarter-end. |
| ● | Increased
stockholders’ equity as a result of the merger, with total stockholders’
equity increasing by $1.0 billion in the fourth quarter resulting in book value per share
of $17.12
and tangible book value per share(1) of
$14.96. |
| (1) | Non-GAAP
measure; refer to section 'Non-GAAP Measures' |
Jared Wolff, President & CEO of Banc of California,
commented, "Since closing our transformational merger with PacWest Bancorp on November 30, 2023, we have made excellent progress
on the integration and the balance sheet repositioning actions that we indicated at the time of the merger announcement. As a result,
we have created the well capitalized, highly-liquid financial institution we envisioned, with significant earnings potential and a strong
position in key California markets.”
Mr. Wolff continued, “As we move through
2024, we will realize more of the benefits of our balance sheet repositioning, which will positively impact our net interest margin,
as well as steadily reduce our noninterest expense as we complete the system conversion in the second quarter of 2024 and consolidate
some of our branches that are in close proximity to each other. While we will remain conservative in our new loan production until economic
conditions improve, we are already seeing the positive benefits of being a larger, stronger financial institution on our business development
efforts. Given the strength of our franchise and the superior level of service, solutions and expertise that we can provide, we believe
we have great opportunities to consistently add attractive client relationships that provide both operating deposit accounts and high
quality loans, particularly given the significant changes we have seen over the past two years in the California banking landscape with
many competitors exiting or significantly pulling back from the market. We believe we are well-positioned to deliver strong financial
performance for our shareholders in 2024, as well as capitalize on the strong market position we have created in California to greatly
enhance the value of our franchise in the coming years.”
Presentation of Results – PacWest Bancorp
Merger
On November 30, 2023, PacWest Bancorp merged
with and into Banc of California (the “Merger”), with Banc of California continuing as the surviving legal corporation and
Banc of California concurrently closed a $400 million equity capital raise. The Merger was accounted for as a reverse merger using the
acquisition method of accounting, therefore, PacWest Bancorp was deemed the acquirer for financial reporting purposes, even though Banc
of California was the legal acquirer. The Merger was an all-stock transaction and has been accounted for as a business combination. Banc
of California’s financial results for all periods ended prior to November 30, 2023 reflect PacWest Bancorp results only on
a standalone basis. In addition, Banc of California’s reported financial results for the three months and year ended December 31,
2023 reflect PacWest Bancorp financial results only on a standalone basis until the closing of the Merger on November 30, 2023,
and results of the combined company for the month of December 2023. The number of shares issued and outstanding, earnings per share,
and all references to share quantities or metrics of Banc of California have been retrospectively restated to reflect the equivalent
number of shares issued in the Merger as the Merger was accounted for as a reverse merger. Under the reverse merger method of accounting,
the assets and liabilities of legacy Banc of California as of November 30, 2023 were recorded at their respective estimated fair
values.
The Company recorded a net loss of $492.9
million, or a loss of $4.55 per diluted common share, for the fourth
quarter of 2023. This compares to a net loss of $33.3
million, or a loss of $0.42 per diluted common share, for the third
quarter of 2023. The fourth quarter of
2023 included pre-tax amounts of $442.4 million of losses on
security sales relating to our previously announced balance sheet repositioning strategy, merger costs of $111.8 million, an FDIC special
assessment of $32.7 million, and an initial credit provision on acquired loans of $22.2 million, in each case in connection with our
merger with PacWest Bancorp. The fourth quarter also included borrowing facility and termination fees of $19.5 million, additional expenses
related to the HOA business of $16.8 million, and various nonrecurring expenses of approximately $8.7 million.
| | 2 |
INCOME STATEMENT HIGHLIGHTS
| | |
Three
Months Ended | | |
Year Ended | |
| | |
December 31, | | |
September 30, | | |
December 31, | | |
December 31, | |
| Summary Income Statement | |
2023 | | |
2023 | | |
2022 | | |
2023 | | |
2022 | |
| | |
(In thousands) | |
| Total interest income | |
$ | 467,240 | | |
$ | 446,084 | | |
$ | 473,023 | | |
$ | 1,971,000 | | |
$ | 1,556,489 | |
| Total interest expense | |
| 316,189 | | |
| 315,355 | | |
| 150,084 | | |
| 1,223,872 | | |
| 265,727 | |
| Net interest income | |
| 151,051 | | |
| 130,729 | | |
| 322,939 | | |
| 747,128 | | |
| 1,290,762 | |
| Provision for credit losses | |
| 47,000 | | |
| - | | |
| 10,000 | | |
| 52,000 | | |
| 24,500 | |
| (Loss) gain on sale of loans | |
| (3,526 | ) | |
| (1,901 | ) | |
| 388 | | |
| (161,346 | ) | |
| 518 | |
| Loss on sale of securities | |
| (442,413 | ) | |
| - | | |
| (49,302 | ) | |
| (442,413 | ) | |
| (50,321 | ) |
| Other noninterest income | |
| 45,537 | | |
| 45,709 | | |
| 29,958 | | |
| 155,474 | | |
| 124,630 | |
| Total noninterest (loss) income | |
| (400,402 | ) | |
| 43,808 | | |
| (18,956 | ) | |
| (448,285 | ) | |
| 74,827 | |
| Total revenue | |
| (249,351 | ) | |
| 174,537 | | |
| 303,983 | | |
| 298,843 | | |
| 1,365,589 | |
| Goodwill impairment | |
| - | | |
| - | | |
| 29,000 | | |
| 1,376,736 | | |
| 29,000 | |
| Acquisition,
integration and reorganization costs | |
| 111,800 | | |
| 9,925 | | |
| 5,703 | | |
| 142,633 | | |
| 5,703 | |
| Other noninterest expense | |
| 251,838 | | |
| 191,178 | | |
| 192,129 | | |
| 938,812 | | |
| 738,818 | |
| Total noninterest expense | |
| 363,638 | | |
| 201,103 | | |
| 226,832 | | |
| 2,458,181 | | |
| 773,521 | |
| (Loss) earnings before income taxes | |
| (659,989 | ) | |
| (26,566 | ) | |
| 67,151 | | |
| (2,211,338 | ) | |
| 567,568 | |
| Income tax (benefit) expense | |
| (177,034 | ) | |
| (3,222 | ) | |
| 17,642 | | |
| (312,201 | ) | |
| 143,955 | |
| Net (loss) earnings | |
| (482,955 | ) | |
| (23,344 | ) | |
| 49,509 | | |
| (1,899,137 | ) | |
| 423,613 | |
| Preferred stock dividends | |
| 9,947 | | |
| 9,947 | | |
| 9,947 | | |
| 39,788 | | |
| 19,339 | |
| Net (loss) earnings
available to common and equivalent stockholders | |
$ | (492,902 | ) | |
$ | (33,291 | ) | |
$ | 39,562 | | |
$ | (1,938,925 | ) | |
$ | 404,274 | |
Net Interest Income
Q4-2023 vs Q3-2023
Net interest income increased by $20.3
million, or 15.5%, to $151.1 million for
the fourth quarter due primarily to a change in the interest-earning asset mix combined with net
interest margin expansion.
Average interest-earning assets of $35.4
billion decreased by $0.4 billion from the prior quarter due to the
sales of loans and securities, partially offset by acquired legacy Banc of California interest-earning assets. The net interest
margin increased by 24 basis points to 1.69% for the fourth quarter as the yield on average interest-earning assets increased by 29 basis
points, while the cost of average total funds increased by 7 basis points. The net interest margin for the month of December 2023
was 2.15% and the estimated spot net interest margin at December 31, 2023 was 2.75%.
The yield on average interest-earning
assets increased by 29 basis points to 5.23% for the fourth quarter from
4.94% in the third quarter due mainly to the change in the interest-earning
asset mix driven by the increase in the balance of average loans and leases as a percentage of average interest-earning assets from 62%
to 67%, the decrease in the balance of average investment securities as a percentage of average interest-earning assets from 19% to 17%,
and the balance of average deposits in financial institutions as a percentage of average interest-earning assets from 19% to 16%. The
yield on average loans and leases increased by 28 basis points to 5.82% during the fourth
quarter as a result of higher discount accretion income and changes in portfolio mix from loan sales and
acquired loans and leases.
| | 3 |
The cost of average total funds increased
by 7 basis points to 3.68% for the fourth quarter from 3.61%
in the third quarter due mainly to higher market interest rates on borrowings.
The cost of average total deposits decreased by 4 basis points to 2.94% for the fourth quarter
compared to 2.98% in the third quarter.
The cost of average interest-bearing liabilities increased by 17 basis points to 4.51% for
the fourth quarter from 4.34% in the third quarter.
Average noninterest-bearing deposits increased by $0.5 billion for the fourth quarter compared
to the third quarter and average total deposits increased by $0.6 billion.
The estimated spot rates, or exit run-rates, at December 31,
2023 were 6.18% for loans and leases and 5.63% for interest-earning assets. The spot rates at December 31, 2023 were 2.69%
for total deposits and 2.99% for the total cost of funds.
Full Year 2023 vs Full
Year 2022
Net interest income
decreased by $543.6 million, or 42.1%, to $747.1 million
for the year ended December 31, 2023 from
the same period in 2022, due primarily to higher funding costs from higher market interest rates,
changes in the balance sheet mix, and the enhanced liquidity management strategies in the first half of 2023 due to the operating environment.
The net interest margin decreased by
151 basis points to 1.98% as the cost of average total funds increased by 260 basis
points, while the yield on average interest-earning assets increased by 101 basis points.
The yield on average interest-earning
assets increased by 101 basis points to 5.21% for the year ended December 31,
2023 from 4.20% for the same period in 2022 due
mainly to higher market interest rates, partially offset by the changes in the mix of average interest-earning assets. The yield on average
loans and leases increased by 85 basis points to 5.92% for the
year ended December 31, 2023 compared to the year
ended December 31, 2022. The yield on average investment securities
increased by 20 basis points to 2.56% for the same period. Average loans and leases represented 67%
of average interest-earnings assets for the year ended December 31,
2023 compared to 70% for the year ended December 31,
2022. Average loans and leases decreased by $714.1 million due mainly
to loan sales during the year to increase liquidity to fund potential deposit outflows.
The cost of average total funds increased by 260 basis points to 3.34%
for the year ended December 31, 2023 from 0.74% for the year ended December 31, 2022 due mainly to higher market interest rates
and changes in the balance sheet mix. The cost of average total deposits increased by 202 basis points to 2.61% for the year ended December 31,
2023 compared to the same period in 2022. The cost of average interest-bearing liabilities increased by 296 basis points to 4.14% for
the year ended December 31, 2023 compared to 1.18% for the same period in 2022 driven primarily by a 249 basis point increase in
the cost of average interest-bearing deposits to 3.46% from 0.97% for the same period in 2022. The increase in the cost of these funding
sources was due mainly to the impact of higher market interest rates. Average noninterest-bearing deposits decreased by $6.5 billion
for the year ended December 31, 2023 compared to the same period in 2022 and average total deposits decreased by $5.6 billion. Average
noninterest-bearing deposits represented 25% of total average deposits for the year ended December 31, 2023 compared to 40% for
the same period in 2022.
| | 4 |
Provision For Credit Losses
Q4-2023 vs Q3-2023
The provision for credit losses was $47.0
million for the fourth quarter and included an initial provision of $22.2 million for acquired legacy
Banc of California non-PCD loans. Outside this initial provision, the quarter’s expense was driven
by $13.2 million of net charge-offs and a need for increased quantitative reserves resulting from revising the economic forecast to reflect
a 60% probability weighting on recessionary scenarios and updating expected prepayment speeds based on a high interest rate environment.
There was no provision for credit losses for the third quarter which included an $8.0 million
provision for loan losses related to higher qualitative reserves on office loans, offset by an $8.0
million reversal of the provision for credit losses related to lower unfunded loan commitments.
Full Year 2023 vs Full Year 2022
During the year ended December 31,
2023, the provision for credit losses was $52.0 million and included
a $113.5 million provision for loan losses, offset partially by a $61.5 million reversal
of the provision for credit losses related to lower unfunded loan commitments. The provision for loan losses included an initial provision
of $22.2 million for acquired legacy Banc of California non-PCD loans. The provision for credit losses was $23.0 million during
the year ended December 31, 2022, and included a $5.0 million
provision for loan losses and an $18.0 million provision related to higher unfunded loan commitments.
Noninterest Income
Q4-2023 vs Q3-2023
Noninterest income decreased by $444.2
million to a loss of $400.4 million for the fourth quarter due
almost entirely to an increase in the loss on sale of securities of $442.4 million. As part of our balance sheet repositioning strategy,
we sold $2.7 billion of legacy PacWest available-for-sale securities in the fourth quarter resulting in losses of $442.4 million. Additionally,
we sold $0.8 billion of legacy Banc of California available-for-sale securities in December 2023 resulting in no gain or loss as
these securities were marked to fair value at the close of the merger.
Full Year 2023 vs Full Year 2022
Noninterest income for the year
ended December 31, 2023 decreased by $523.1 million to
a loss of $448.3 million compared to the same period in 2022 due
mainly to a $392.1 million increase in the loss on the sale of securities and a $161.9 million increase in the loss on the sale
of loans, offset partially by higher dividends and gains from equity investments, higher leased equipment
income, and higher other income primarily from legal settlements totaling $22.1 million.
| | 5 |
Noninterest Expense
Q4-2023 vs Q3-2023
Noninterest expense increased by $162.5
million to $363.6 million for the fourth quarter compared
to the third quarter. The increase was due mainly to acquisition, integration and reorganization
costs of $111.8 million related to our merger with PacWest, an increase in insurance and assessments expense of $21.7 million, which
includes $32.7 million for the FDIC special assessment, an increase of $18.9 million in customer related expense, and higher compensation
expense of $17.7 million.
Full Year 2023 vs Full Year 2022
Noninterest expense for the year
ended December 31, 2023 increased by $1.7 billion to
$2.5 billion compared to the same period in 2022. The increase
was due mainly to higher (i) goodwill impairment of $1.3 billion, (ii) acquisition, integration
and reorganization costs of $136.9 million, (iii) regulatory assessments of $110.2 million
due to the special FDIC assessment and the generally-applicable FDIC increased assessment rates in 2023,
(iv) customer related expense of $68.8 million, and (v) other expense of $96.8 million,
including $106.8 million of unfunded commitments fair value loss adjustments, offset partially by
lower compensation expense of $74.5 million.
Income Taxes
Q4-2023 vs Q3-2023
An income tax benefit of $177.0 million was recorded for the fourth
quarter resulting in an effective tax rate of 26.8% compared to a benefit of $3.2 million for the third quarter and an effective tax
rate of 12.1%.
Full Year 2023 vs Full Year 2022
Income tax benefit totaled $312.2 million for the year ended December 31,
2023, representing an effective tax rate of 14.1%, compared to tax expense of $144.0 million and an effective tax rate of 25.4% for the
year ended December 31, 2022. The lower effective tax rate in 2023 was primarily due to the effect of the non-deductible goodwill
impairment.
| | 6 |
BALANCE SHEET HIGHLIGHTS
| | |
December 31, | | |
September 30, | | |
December 31, | | |
Increase
(Decrease) | |
| Selected Balance Sheet Items | |
2023 | | |
2023 | | |
2022 | | |
CQ vs PQ | | |
CQ vs PYQ | |
| | |
| | |
| | |
| | |
| | |
| |
| | |
(In thousands) | |
| Cash and cash equivalents | |
$ | 5,377,576 | | |
$ | 6,069,667 | | |
$ | 2,240,222 | | |
$ | (692,091 | ) | |
$ | 3,137,354 | |
| Securities available-for-sale | |
| 2,346,864 | | |
| 4,487,172 | | |
| 4,843,487 | | |
| (2,140,308 | ) | |
| (2,496,623 | ) |
| Securities held-to-maturity | |
| 2,287,291 | | |
| 2,282,586 | | |
| 2,269,135 | | |
| 4,705 | | |
| 18,156 | |
| Loan held for
investment, net of deferred fees | |
| 25,489,687 | | |
| 21,920,946 | | |
| 28,609,129 | | |
| 3,568,741 | | |
| (3,119,442 | ) |
| Total assets | |
| 38,534,064 | | |
| 36,877,833 | | |
| 41,228,936 | | |
| 1,656,231 | | |
| (2,694,872 | ) |
| | |
| | | |
| | | |
| | | |
| | | |
| | |
| Noninterest-bearing deposits | |
$ | 7,774,254 | | |
$ | 5,579,033 | | |
$ | 11,212,357 | | |
$ | 2,195,221 | | |
$ | (3,438,103 | ) |
| Total deposits | |
| 30,401,769 | | |
| 26,598,681 | | |
| 33,936,334 | | |
| 3,803,088 | | |
| (3,534,565 | ) |
| Borrowings | |
| 2,911,322 | | |
| 6,294,525 | | |
| 1,764,030 | | |
| (3,383,203 | ) | |
| 1,147,292 | |
| Total liabilities | |
| 35,143,299 | | |
| 34,478,556 | | |
| 37,278,405 | | |
| 664,743 | | |
| (2,135,106 | ) |
| Total stockholders' equity | |
| 3,390,765 | | |
| 2,399,277 | | |
| 3,950,531 | | |
| 991,488 | | |
| (559,766 | ) |
Securities
The balance of securities held-to-maturity
(“HTM”) remained consistent through the fourth quarter and totaled $2.3 billion at December 31,
2023. As of December 31, 2023, HTM securities had aggregate unrealized
net after-tax losses in AOCI of $181.4 million remaining from the balance established at the time of transfer on June 1,
2022. These HTM unrealized losses are related to changes in overall interest rates.
Securities available-for-sale (“AFS”)
decreased by $2.1 billion during the fourth quarter to $2.3
billion at December 31, 2023, due primarily to legacy PacWest securities sales of $2.7 billion,
offset partially by a reduction in the unrealized net pre-tax losses. The decrease in unrealized
net losses was due to the impact of lower market interest rate forward curves. AFS securities had aggregate
unrealized net after-tax losses in AOCI of $252.2 million. These AFS unrealized net losses related
primarily to changes in overall interest rates and spreads and the resulting impact on valuations.
| | 7 |
Loans
The following table sets forth the composition, by
loan category, of our loan portfolio as of the dates indicated:
| | |
December 31, | | |
September 30, | | |
June 30, | | |
March 31, | | |
December 31, | |
| Composition of Loans and Leases | |
2023 | | |
2023 | | |
2023 | | |
2023 | | |
2022 | |
| | |
| | |
| | |
| | |
| | |
| |
| | |
(Dollars in thousands) | |
| Real estate mortgage: | |
| | | |
| | | |
| | | |
| | | |
| | |
| Commercial | |
$ | 5,026,497 | | |
$ | 3,526,308 | | |
$ | 3,610,320 | | |
$ | 3,808,751 | | |
$ | 3,846,831 | |
| Multi-family | |
| 6,025,179 | | |
| 5,279,659 | | |
| 5,304,544 | | |
| 5,523,320 | | |
| 5,607,865 | |
| Other residential | |
| 5,060,309 | | |
| 5,228,524 | | |
| 5,373,178 | | |
| 6,075,540 | | |
| 6,275,628 | |
| Total real estate
mortgage | |
| 16,111,985 | | |
| 14,034,491 | | |
| 14,288,042 | | |
| 15,407,611 | | |
| 15,730,324 | |
| Real estate construction and land: | |
| | | |
| | | |
| | | |
| | | |
| | |
| Commercial | |
| 759,585 | | |
| 465,266 | | |
| 415,997 | | |
| 910,327 | | |
| 898,592 | |
| Residential | |
| 2,399,684 | | |
| 2,272,271 | | |
| 2,049,526 | | |
| 3,698,113 | | |
| 3,253,580 | |
| Total real estate
construction and land | |
| 3,159,269 | | |
| 2,737,537 | | |
| 2,465,523 | | |
| 4,608,440 | | |
| 4,152,172 | |
| Total real estate | |
| 19,271,254 | | |
| 16,772,028 | | |
| 16,753,565 | | |
| 20,016,051 | | |
| 19,882,496 | |
| Commercial: | |
| | | |
| | | |
| | | |
| | | |
| | |
| Asset-based | |
| 2,189,085 | | |
| 2,287,893 | | |
| 2,357,098 | | |
| 2,068,327 | | |
| 5,140,209 | |
| Venture capital | |
| 1,446,362 | | |
| 1,464,160 | | |
| 1,723,476 | | |
| 2,058,237 | | |
| 2,033,302 | |
| Other commercial | |
| 2,129,860 | | |
| 1,002,377 | | |
| 1,014,212 | | |
| 1,102,543 | | |
| 1,108,451 | |
| Total commercial | |
| 5,765,307 | | |
| 4,754,430 | | |
| 5,094,786 | | |
| 5,229,107 | | |
| 8,281,962 | |
| Consumer | |
| 453,126 | | |
| 394,488 | | |
| 409,859 | | |
| 427,223 | | |
| 444,671 | |
| Total
loans and leases held for investment, net of deferred fees | |
$ | 25,489,687 | | |
$ | 21,920,946 | | |
$ | 22,258,210 | | |
$ | 25,672,381 | | |
$ | 28,609,129 | |
| | |
| | | |
| | | |
| | | |
| | | |
| | |
| Total unfunded loan commitments | |
$ | 5,578,907 | | |
$ | 5,289,221 | | |
$ | 5,845,375 | | |
$ | 9,776,789 | | |
$ | 11,110,264 | |
| Composition as % of Total
| |
December 31, | | |
September 30, | | |
June 30, | | |
March 31, | | |
December 31, | |
| Loans and Leases | |
2023 | | |
2023 | | |
2023 | | |
2023 | | |
2022 | |
| Real estate mortgage: | |
| | | |
| | | |
| | | |
| | | |
| | |
| Commercial | |
| 20 | % | |
| 16 | % | |
| 16 | % | |
| 15 | % | |
| 13 | % |
| Multi-family | |
| 23 | % | |
| 24 | % | |
| 24 | % | |
| 21 | % | |
| 20 | % |
| Other residential | |
| 20 | % | |
| 24 | % | |
| 24 | % | |
| 24 | % | |
| 22 | % |
| Total real estate
mortgage | |
| 63 | % | |
| 64 | % | |
| 64 | % | |
| 60 | % | |
| 55 | % |
| Real estate construction and land: | |
| | | |
| | | |
| | | |
| | | |
| | |
| Commercial | |
| 3 | % | |
| 2 | % | |
| 2 | % | |
| 4 | % | |
| 3 | % |
| Residential | |
| 9 | % | |
| 10 | % | |
| 9 | % | |
| 14 | % | |
| 11 | % |
| Total
real estate construction and land | |
| 12 | % | |
| 12 | % | |
| 11 | % | |
| 18 | % | |
| 14 | % |
| Total real estate | |
| 75 | % | |
| 76 | % | |
| 75 | % | |
| 78 | % | |
| 69 | % |
| Commercial: | |
| | | |
| | | |
| | | |
| | | |
| | |
| Asset-based | |
| 9 | % | |
| 10 | % | |
| 11 | % | |
| 8 | % | |
| 18 | % |
| Venture capital | |
| 6 | % | |
| 7 | % | |
| 8 | % | |
| 8 | % | |
| 7 | % |
| Other commercial | |
| 8 | % | |
| 5 | % | |
| 4 | % | |
| 4 | % | |
| 4 | % |
| Total commercial | |
| 23 | % | |
| 22 | % | |
| 23 | % | |
| 20 | % | |
| 29 | % |
| Consumer | |
| 2 | % | |
| 2 | % | |
| 2 | % | |
| 2 | % | |
| 2 | % |
| | |
| | | |
| | | |
| | | |
| | | |
| | |
| Total
loans and leases held for investment, net of deferred fees | |
| 100 | % | |
| 100 | % | |
| 100 | % | |
| 100 | % | |
| 100 | % |
| | 8 |
Total loans and leases ended the fourth quarter of 2023 at $25.5 billion,
up $3.6 billion from $21.9 billion at September 30, 2023, due primarily to the addition of $6.1 billion of legacy Banc of California
loans at fair value, partially offset by sales of legacy Banc of California loans totaling $2.2 billion in December as part of the
balance sheet repositioning. The loan sales consisted of $1.5 billion of single-family loans and $0.7 billion of multi-family loans.
Loan fundings were $212.2 million in the fourth quarter at a weighted-average rate of 7.37%.
Deposits and Client Investment Funds
The following table sets forth
the composition of our deposits at the dates indicated:
| | |
December 31, | | |
September 30, | | |
June 30, | | |
March 31, | | |
December 31, | |
| Composition of Deposits | |
2023 | | |
2023 | | |
2023 | | |
2023 | | |
2022 | |
| | |
| | |
| | |
| | |
| | |
| |
| | |
(Dollars in thousands) | |
| Noninterest-bearing checking | |
$ | 7,774,254 | | |
$ | 5,579,033 | | |
$ | 6,055,358 | | |
$ | 7,030,759 | | |
$ | 11,212,357 | |
| Interest-bearing: | |
| | | |
| | | |
| | | |
| | | |
| | |
| Checking | |
| 7,808,764 | | |
| 7,038,808 | | |
| 7,112,807 | | |
| 5,360,622 | | |
| 7,938,911 | |
| Money market | |
| 6,187,889 | | |
| 5,424,347 | | |
| 5,678,323 | | |
| 8,195,670 | | |
| 9,469,586 | |
| Savings | |
| 1,997,989 | | |
| 1,441,700 | | |
| 897,277 | | |
| 671,918 | | |
| 577,637 | |
| Certificates of deposit: | |
| | | |
| | | |
| | | |
| | | |
| | |
| Non-brokered | |
| 3,139,270 | | |
| 3,038,005 | | |
| 2,725,265 | | |
| 2,502,914 | | |
| 2,434,414 | |
| Brokered | |
| 3,493,603 | | |
| 4,076,788 | | |
| 5,428,053 | | |
| 4,425,678 | | |
| 2,303,429 | |
| Total certificates
of deposit | |
| 6,632,873 | | |
| 7,114,793 | | |
| 8,153,318 | | |
| 6,928,592 | | |
| 4,737,843 | |
| Total interest-bearing | |
| 22,627,515 | | |
| 21,019,648 | | |
| 21,841,725 | | |
| 21,156,802 | | |
| 22,723,977 | |
| Total deposits | |
$ | 30,401,769 | | |
$ | 26,598,681 | | |
$ | 27,897,083 | | |
$ | 28,187,561 | | |
$ | 33,936,334 | |
| | |
December 31, | | |
September 30, | | |
June 30, | | |
March 31, | | |
December 31, | |
| Composition as % of Total Deposits | |
2023 | | |
2023 | | |
2023 | | |
2023 | | |
2022 | |
| Noninterest-bearing checking | |
| 26 | % | |
| 21 | % | |
| 22 | % | |
| 25 | % | |
| 33 | % |
| Interest-bearing: | |
| | | |
| | | |
| | | |
| | | |
| | |
| Checking | |
| 26 | % | |
| 27 | % | |
| 26 | % | |
| 19 | % | |
| 23 | % |
| Money market | |
| 20 | % | |
| 20 | % | |
| 20 | % | |
| 29 | % | |
| 28 | % |
| Savings | |
| 6 | % | |
| 5 | % | |
| 3 | % | |
| 2 | % | |
| 2 | % |
| Certificates of deposit: | |
| | | |
| | | |
| | | |
| | | |
| | |
| Non-brokered | |
| 10 | % | |
| 12 | % | |
| 10 | % | |
| 9 | % | |
| 7 | % |
| Brokered | |
| 12 | % | |
| 15 | % | |
| 19 | % | |
| 16 | % | |
| 7 | % |
| Total certificates
of deposit | |
| 22 | % | |
| 27 | % | |
| 29 | % | |
| 25 | % | |
| 14 | % |
| Total interest-bearing | |
| 74 | % | |
| 79 | % | |
| 78 | % | |
| 75 | % | |
| 67 | % |
| Total deposits | |
| 100 | % | |
| 100 | % | |
| 100 | % | |
| 100 | % | |
| 100 | % |
Total deposits
increased by $3.8 billion during the fourth quarter of
2023 to $30.4 billion at December 31, 2023,
due primarily to balances acquired in the merger, partially offset by a decrease in brokered deposits.
Noninterest-bearing checking totaled
$7.77 billion and represented 26% of total deposits at December 31,
2023, compared to $5.58 billion, or 21% of
total deposits, at September 30, 2023. Period-end noninterest-bearing deposit balance and percentage
both increased in the quarter primarily due to balances acquired in the merger.
Insured deposits of $23.1 billion
represented 76% of total deposits at December 31, 2023,
compared to insured deposits of $21.6 billion or 81% of total
deposits at September 30, 2023.
| | 9 |
In addition to deposit products, we also offer alternative, non-depository
corporate treasury solutions for select clients to invest excess liquidity. These alternative options include investments managed by
BofCal Asset Management Inc. (“BAM”), our registered investment advisor subsidiary, and third-party sweep products. Total off-balance
sheet client investment funds were $0.7 billion as of September 30, 2023 and decreased to $0.6 billion at December 31, 2023,
of which $0.2 billion was managed by BAM.
Borrowings
Borrowings decreased by $3.4 billion from $6.3 billion
at September 30, 2023, to $2.9 billion at year-end as proceeds from asset sales were used to pay down the Bank Term Funding Program
balance by $2.3 billion and pay off a $1.3 billion repurchase agreement. We chose to carry higher on-balance sheet liquidity while we
executed the balance sheet repositioning and have the ability to strategically pay down or pay off the $2.6 billion remaining Bank Term
Funding Program balance at our discretion.
Equity
During the fourth quarter,
total stockholders’ equity increased by $1.0 billion to $3.4 billion and
tangible common equity(1) increased by $651.6 million to $2.5 billion at
December 31, 2023. The increase in total stockholders’ equity for the fourth quarter
resulted from Banc of California shares issued in exchange for PacWest Bancorp shares as Merger consideration
and shares issued in connection with the $400 million capital raise and lower accumulated other comprehensive loss, partially offset
by the net loss in the fourth quarter and by dividends declared and paid.
At December 31, 2023, book value
per common share decreased to $17.12, compared to $24.12 at September 30, 2023, which was retrospectively restated under
the reverse merger method of accounting. The linked-quarter change in book value per share reflects Banc
of California shares issued as Merger consideration in exchange for PacWest Bancorp shares and in connection with the $400 million capital
raise, the net loss in the fourth quarter and lower accumulated other comprehensive loss. Tangible book value per common share(1) decreased
to $14.96, compared to $23.81 restated at September 30, 2023, mainly as a result of Banc of California shares issued in exchange
for PacWest Bancorp shares as Merger consideration and shares issued in connection with the $400 million capital raise combined with
$199 million of goodwill and $145 million of core deposit intangible assets added through the merger.
| (1) | Non-GAAP
measures; refer to section 'Non-GAAP Measures' |
| | 10 |
CAPITAL AND LIQUIDITY
Capital ratios remain strong with total
risk-based capital at 16.40% and a tier 1 leverage ratio of 9.00% at
December 31, 2023. The following table sets forth our regulatory capital ratios as of the dates
indicated:
| | |
December 31, | | |
September 30, | | |
June 30, | | |
March 31, | | |
December 31, | |
| Capital Ratios | |
2023 (1) | | |
2023 | | |
2023 | | |
2023 | | |
2022 | |
| Banc of California, Inc. | |
| | | |
| | | |
| | | |
| | | |
| | |
| Total risk-based capital
ratio | |
| 16.40 | % | |
| 17.83 | % | |
| 17.61 | % | |
| 14.21 | % | |
| 13.61 | % |
| Tier 1 risk-based capital ratio | |
| 12.42 | % | |
| 13.84 | % | |
| 13.70 | % | |
| 11.15 | % | |
| 10.61 | % |
| Common equity tier 1 capital ratio | |
| 10.12 | % | |
| 11.23 | % | |
| 11.16 | % | |
| 9.21 | % | |
| 8.70 | % |
| Tier 1 leverage capital ratio | |
| 9.00 | % | |
| 8.65 | % | |
| 7.76 | % | |
| 8.33 | % | |
| 8.61 | % |
| | |
| | | |
| | | |
| | | |
| | | |
| | |
| Banc of California | |
| | | |
| | | |
| | | |
| | | |
| | |
| Total risk-based capital ratio | |
| 15.73 | % | |
| 16.37 | % | |
| 16.07 | % | |
| 12.94 | % | |
| 12.34 | % |
| Tier 1 risk-based capital ratio | |
| 13.24 | % | |
| 13.72 | % | |
| 13.48 | % | |
| 10.89 | % | |
| 10.32 | % |
| Common equity tier 1 capital ratio | |
| 13.24 | % | |
| 13.72 | % | |
| 13.48 | % | |
| 10.89 | % | |
| 10.32 | % |
| Tier 1 leverage capital ratio | |
| 9.62 | % | |
| 8.57 | % | |
| 7.62 | % | |
| 8.14 | % | |
| 8.39 | % |
(1) Capital information
for December 31, 2023 is preliminary.
At December 31, 2023,
immediately available cash and cash equivalents were $5.2 billion, a decrease of $0.7 billion
from September 30, 2023. Combined with total available borrowing
capacity of $12.0 billion, total liquid assets and unused borrowing capacity of $17.2 billion was
2.5 times greater than total uninsured and uncollateralized deposits of $6.9 billion.
| | 11 |
CREDIT QUALITY
| | |
December 31, | | |
September 30, | | |
June 30, | | |
March 31, | | |
December 31, | |
| Asset Quality Information and Ratios | |
2023 | | |
2023 | | |
2023 | | |
2023 | | |
2022 | |
| | |
| | |
| | |
| | |
| | |
| |
| | |
(Dollars in thousands) | |
| Delinquent
loans and leases held for investment: | |
| | | |
| | | |
| | | |
| | | |
| | |
| 30 to 89 days delinquent | |
$ | 113,307 | | |
$ | 49,970 | | |
$ | 57,428 | | |
$ | 144,431 | | |
$ | 105,845 | |
| 90+ days delinquent | |
| 30,882 | | |
| 77,327 | | |
| 62,322 | | |
| 49,936 | | |
| 70,922 | |
| Total delinquent
loans and leases | |
$ | 144,189 | | |
$ | 127,297 | | |
$ | 119,750 | | |
$ | 194,367 | | |
$ | 176,767 | |
| | |
| | | |
| | | |
| | | |
| | | |
| | |
| Total delinquent
loans and leases to loans and leases held for investment | |
| 0.57 | % | |
| 0.58 | % | |
| 0.54 | % | |
| 0.76 | % | |
| 0.62 | % |
| | |
| | | |
| | | |
| | | |
| | | |
| | |
| Nonperforming
assets, excluding loans held for sale: | |
| | | |
| | | |
| | | |
| | | |
| | |
| Nonaccrual loans and leases | |
$ | 62,527 | | |
$ | 125,396 | | |
$ | 104,886 | | |
$ | 87,124 | | |
$ | 103,778 | |
| 90+
days delinquent loans and still accruing | |
| 11,750 | | |
| - | | |
| - | | |
| - | | |
| - | |
| Total nonperforming
loans and leases ("NPLs") | |
| 74,277 | | |
| 125,396 | | |
| 104,886 | | |
| 87,124 | | |
| 103,778 | |
| Foreclosed assets,
net | |
| 7,394 | | |
| 6,829 | | |
| 8,426 | | |
| 2,135 | | |
| 5,022 | |
| Total
nonperforming assets ("NPAs") | |
$ | 81,671 | | |
$ | 132,225 | | |
$ | 113,312 | | |
$ | 89,259 | | |
$ | 108,800 | |
| | |
| | | |
| | | |
| | | |
| | | |
| | |
| Allowance for loan and lease losses | |
$ | 281,687 | | |
$ | 222,297 | | |
$ | 219,234 | | |
$ | 210,055 | | |
$ | 200,732 | |
| Allowance for
loan and lease losses to NPLs | |
| 379.24 | % | |
| 177.28 | % | |
| 209.02 | % | |
| 241.10 | % | |
| 193.42 | % |
| NPLs to loans
and leases held for investment | |
| 0.29 | % | |
| 0.57 | % | |
| 0.47 | % | |
| 0.34 | % | |
| 0.36 | % |
| NPAs to total assets | |
| 0.21 | % | |
| 0.36 | % | |
| 0.30 | % | |
| 0.20 | % | |
| 0.26 | % |
At December 31, 2023,
total delinquent loans and leases were $144.2 million, compared to $127.3 million at September 30,
2023. The increase was due mostly to delinquent Civic loans and leases acquired from legacy Banc of California. Total delinquent loans
and leases as a percentage of total loans and leases declined to 0.57% at December 31, 2023, as compared to 0.58% at September 30,
2023.
At December 31, 2023,
nonperforming loans were $74.3 million, and included $31.0 million of
other residential loans (mostly Civic), $27.4 million of CRE loans, $14.0 million of
commercial and industrial loans, $1.0 million of multi-family loans and $0.8 million of
consumer loans. During the fourth quarter, nonperforming loans decreased by $51.1 million
due to transfers to held for sale of $44.0 million, payoffs and paydowns of $26.6 million, net charge-offs
of $7.9 million, and borrowers that became current of $2.0 million,
offset partially by additions (including acquired loans) of $29.5 million. Nonperforming loans and
leases as a percentage of total loans and leases declined to 0.29% at December 31, 2023 compared to 0.57% at September 30,
2023.
At December 31, 2023,
nonperforming assets included $7.4 million of other real estate owned, consisting entirely of single-family
residences.
| | 12 |
ALLOWANCE FOR CREDIT LOSSES - LOANS
| | |
Three
Months Ended | | |
Year Ended | |
| | |
December 31, | | |
September 30, | | |
December 31, | | |
December 31, | |
| Allowance for Credit Losses - Loans | |
2023 | | |
2023 | | |
2022 | | |
2023 | | |
2022 | |
| | |
| | |
| | |
| | |
| | |
| |
| | |
(Dollars in thousands) | |
| Allowance for loan and lease losses ("ALLL"): | |
| | | |
| | | |
| | | |
| | | |
| | |
| Balance at beginning of period | |
$ | 222,297 | | |
$ | 219,234 | | |
$ | 189,327 | | |
$ | 200,732 | | |
$ | 200,564 | |
| Initial ALLL on acquired PCD loans | |
| 25,623 | | |
| - | | |
| - | | |
| 25,623 | | |
| - | |
| Charge-offs | |
| (14,628 | ) | |
| (6,695 | ) | |
| (3,352 | ) | |
| (63,428 | ) | |
| (14,037 | ) |
| Recoveries | |
| 1,395 | | |
| 1,758 | | |
| 757 | | |
| 5,260 | | |
| 9,205 | |
| Net charge-offs | |
| (13,233 | ) | |
| (4,937 | ) | |
| (2,595 | ) | |
| (58,168 | ) | |
| (4,832 | ) |
| Provision for
loan losses | |
| 47,000 | (1) | |
| 8,000 | | |
| 14,000 | | |
| 113,500 | | |
| 5,000 | |
| Balance at end of period | |
$ | 281,687 | | |
$ | 222,297 | | |
$ | 200,732 | | |
$ | 281,687 | | |
$ | 200,732 | |
| | |
| | | |
| | | |
| | | |
| | | |
| | |
| Reserve for unfunded loan commitments ("RUC"): | |
| | | |
| | | |
| | | |
| | | |
| | |
| Balance at beginning of period | |
$ | 29,571 | | |
$ | 37,571 | | |
$ | 95,071 | | |
$ | 91,071 | | |
$ | 73,071 | |
| (Negative provision)
provision for credit losses | |
| - | | |
| (8,000 | ) | |
| (4,000 | ) | |
| (61,500 | ) | |
| 18,000 | |
| Balance at end of period | |
$ | 29,571 | | |
$ | 29,571 | | |
$ | 91,071 | | |
$ | 29,571 | | |
$ | 91,071 | |
| | |
| | | |
| | | |
| | | |
| | | |
| | |
| Allowance for credit losses ("ACL") - Loans: | |
| | | |
| | | |
| | | |
| | | |
| | |
| Balance at beginning of period | |
$ | 251,868 | | |
$ | 256,805 | | |
$ | 284,398 | | |
$ | 291,803 | | |
$ | 273,635 | |
| Initial ALLL on acquired PCD loans | |
| 25,623 | | |
| - | | |
| - | | |
| 25,623 | | |
| - | |
| Charge-offs | |
| (14,628 | ) | |
| (6,695 | ) | |
| (3,352 | ) | |
| (63,428 | ) | |
| (14,037 | ) |
| Recoveries | |
| 1,395 | | |
| 1,758 | | |
| 757 | | |
| 5,260 | | |
| 9,205 | |
| Net charge-offs | |
| (13,233 | ) | |
| (4,937 | ) | |
| (2,595 | ) | |
| (58,168 | ) | |
| (4,832 | ) |
| Provision for
credit losses | |
| 47,000 | (1) | |
| - | | |
| 10,000 | | |
| 52,000 | | |
| 23,000 | |
| Balance at end of period | |
$ | 311,258 | | |
$ | 251,868 | | |
$ | 291,803 | | |
$ | 311,258 | | |
$ | 291,803 | |
| | |
| | | |
| | | |
| | | |
| | | |
| | |
| ALLL to loans and leases held for investment | |
| 1.11 | % | |
| 1.01 | % | |
| 0.70 | % | |
| 1.11 | % | |
| 0.70 | % |
| ACL to loans and leases held for investment | |
| 1.22 | % | |
| 1.15 | % | |
| 1.02 | % | |
| 1.22 | % | |
| 1.02 | % |
| ACL to NPLs | |
| 419.05 | % | |
| 200.86 | % | |
| 281.18 | % | |
| 419.05 | % | |
| 281.18 | % |
| ACL to NPAs | |
| 381.11 | % | |
| 190.48 | % | |
| 268.20 | % | |
| 381.11 | % | |
| 268.20 | % |
| Annualized net charge-offs to average loans and leases | |
| 0.22 | % | |
| 0.09 | % | |
| 0.04 | % | |
| 0.23 | % | |
| 0.02 | % |
(1) Includes
$22.2 million initial provision related to non-PCD loans acquired during the period.
The allowance for credit losses, which
includes the reserve for unfunded loan commitments, totaled $311.3 million, or 1.22% of
total loans and leases, at December 31, 2023, compared to $251.9 million,
or 1.15% of total loans and leases, at September 30, 2023.
The $59.4 million increase in the allowance includes the addition of $25.6 million related to legacy
Banc of California PCD loans booked at the Merger’s close and did not affect the income statement. The ACL provision for the fourth
quarter was $47.0 million, which includes an initial provision of $22.2 million for acquired legacy
Banc of California non-PCD loans. Outside this initial provision, the quarter’s expense was driven
by $13.2 million of net charge-offs and a need for increased quantitative reserves resulting from revising the economic forecast to reflect
a 60% probability weighting on recessionary scenarios and updating expected prepayment speeds based on a high interest rate environment.
The ACL coverage of nonperforming loans was 419% at December 31, 2023 compared
to 201% at September 30, 2023.
| | 13 |
Net charge-offs were 0.22% of
average loans and leases (annualized) for the fourth quarter of 2023, compared to 0.09% for the third quarter of 2023. The increase in
net charge-offs in the fourth quarter of 2023 was due primarily to $5.3 million of charge-offs related to the transfer of Civic loans
to held for sale. At December 31, 2023, nonperforming assets were $81.7 million, or 0.21% of total assets, compared to $132.2 million,
or 0.36% of total assets, as of September 30, 2023.
Conference Call
The Company will host a conference call to discuss its fourth quarter
2023 financial results at 10:00 a.m. Pacific Time (PT) on Thursday, January 25, 2023. Interested parties are welcome to attend
the conference call by dialing (888) 317-6003 and referencing event code 4864870. A live audio webcast will also be available and the
webcast link will be posted on the Company’s Investor Relations website at www.bancofcal.com/investor. The slide presentation for
the call will also be available on the Company's Investor Relations website prior to the call. A replay of the call will be made available
approximately one hour after the call has ended on the Company’s Investor Relations website at www.bancofcal.com/investor
or by dialing (877) 344-7529 and referencing event code 7597241.
About Banc of California, Inc.
Banc of California, Inc. (NYSE: BANC) is a bank holding company
headquartered in Los Angeles with one wholly-owned banking subsidiary, Banc of California (the “bank”). Banc of California
is one of the nation’s premier relationship-based business banks focused on providing banking and treasury management services
to small-, middle-market, and venture-backed businesses. Banc of California offers a broad range of loan and deposit products and services
through more than 90 full-service branches throughout California and in Denver, Colorado, and Durham, North Carolina, as well as full-stack
payment processing solutions through its subsidiary, Deepstack Technologies. Banc of California also serves the Community Association
Management industry nationwide with its technology-forward platform SmartStreet™. The bank is committed to its local communities
by supporting organizations that provide financial literacy and job training, small business support, affordable housing, and more. For
more information, please visit us at www.bancofcal.com.
Forward-Looking Statements
This press release includes forward-looking statements within the
meaning of the “Safe-Harbor” provisions of the Private Securities Litigation Reform Act of 1995. Words or phrases such as
“believe,” “will,” “should,” “will likely result,” “are expected to,” “will
continue,” “is anticipated,” “estimate,” “project,” “plans,” “strategy,”
or similar expressions are intended to identify these forward-looking statements. You are cautioned not to place undue reliance on any
forward-looking statements. These statements are necessarily subject to risk and uncertainty and actual results could differ materially
from those anticipated due to various factors, including those set forth from time to time in the documents filed or furnished by Banc
of California, Inc. (the “Company”) with the Securities and Exchange Commission (“SEC”). The Company undertakes
no obligation to revise or publicly release any revision or update to these forward-looking statements to reflect events or circumstances
that occur after the date on which such statements were made, except as required by law.
| | 14 |
Factors that could cause actual results to differ
materially from the results anticipated or projected include, but are not limited to: (i) changes in general economic conditions,
either nationally or in our market areas, including the impact of supply chain disruptions, and the risk of recession or an economic
downturn; (ii) changes in the interest rate environment, including the recent and potential future increases in the FRB benchmark
rate, which could adversely affect our revenue and expenses, the value of assets and obligations, the availability and cost of capital
and liquidity, and the impacts of continuing inflation; (iii) the credit risks of lending activities, which may be affected by deterioration
in real estate markets and the financial condition of borrowers, and the operational risk of lending activities, including the effectiveness
of our underwriting practices and the risk of fraud, any of which may lead to increased loan delinquencies, losses, and non-performing
assets, and may result in our allowance for credit losses not being adequate; (iv) fluctuations in the demand for loans, and fluctuations
in commercial and residential real estate values in our market area; (v) the quality and composition of our securities portfolio;
(vi) our ability to develop and maintain a strong core deposit base, including among our venture banking clients, or other low cost
funding sources necessary to fund our activities particularly in a rising or high interest rate environment; (vii) the rapid withdrawal
of a significant amount of demand deposits over a short period of time; (viii) the costs and effects of litigation; (ix) risks
related to the Company’s acquisitions, including disruption to current plans and operations; difficulties in customer and employee
retention; fees, expenses and charges related to these transactions being significantly higher than anticipated; and our inability to
achieve expected revenues, cost savings, synergies, and other benefits; and in the case of our recent acquisition of PacWest Bancorp
(“PacWest”), reputational risk, regulatory risk and potential adverse reactions of the Company's or PacWest's customers,
suppliers, vendors, employees or other business partners; (x) results of examinations by regulatory authorities of the Company and
the possibility that any such regulatory authority may, among other things, limit our business activities, restrict our ability to invest
in certain assets, refrain from issuing an approval or non-objection to certain capital or other actions, increase our allowance for
credit losses, result in write-downs of asset values, restrict our ability or that of our bank subsidiary to pay dividends, or impose
fines, penalties or sanctions; (xi) legislative or regulatory changes that adversely affect our business, including changes in tax
laws and policies, accounting policies and practices, privacy laws, and regulatory capital or other rules; (xii) the risk that our
enterprise risk management framework may not be effective in mitigating risk and reducing the potential for losses; (xiii) errors
in estimates of the fair values of certain of our assets and liabilities, which may result in significant changes in valuation; (xiv) failures
or security breaches with respect to the network, applications, vendors and computer systems on which we depend, including due to cybersecurity
threats; (xv) our ability to attract and retain key members of our senior management team; (xvi) the effects of climate change,
severe weather events, natural disasters, pandemics, epidemics and other public health crises, acts of war or terrorism, and other external
events on our business; (xvii) the impact of bank failures or other adverse developments at other banks on general investor sentiment
regarding the stability and liquidity of banks; (xviii) the possibility that our recorded goodwill could become impaired, which
may have an adverse impact on our earnings and capital; (xix) our existing indebtedness, together with any future incurrence of
additional indebtedness, could adversely affect our ability to raise additional capital and to meet our debt obligations; (xx) the
risk that we may incur significant losses on future asset sales; and (xxi) other economic, competitive, governmental, regulatory,
and technological factors affecting our operations, pricing, products and services and the other risks described in this press release
and from time to time in other documents that we file with or furnish to the SEC.
| | 15 |
| Investor
Relations Inquiries: |
| Banc
of California, Inc. |
| (855)
361-2262 |
| Jared
Wolff, (310) 424-1230 |
Joe Kauder,
(310) 844-5224 |
William
Black, (919) 597-7466 |
| |
| Media
Contact: |
| Debora
Vrana, Banc of California |
| (213)
999-4141 |
| Deb.Vrana@bancofcal.com |
| Source:
Banc of California, Inc. |
| | 16 |
BANC
OF CALIFORNIA, INC.
CONSOLIDATED
STATEMENTS OF FINANCIAL CONDITION (UNAUDITED)
| | |
December 31, | | |
September 30, | | |
June 30, | | |
March 31, | | |
December 31, | |
| | |
2023 | | |
2023 | | |
2023 | | |
2023 | | |
2022 | |
| | |
| | |
| | |
| | |
| | |
| |
| | |
(Dollars
in thousands) | |
| ASSETS: | |
| | |
| | |
| | |
| | |
| |
| Cash and due from
banks | |
$ | 202,427 | | |
$ | 182,261 | | |
$ | 208,300 | | |
$ | 218,830 | | |
$ | 212,273 | |
| Interest-earning
deposits in financial institutions | |
| 5,175,149 | | |
| 5,887,406 | | |
| 6,489,847 | | |
| 6,461,306 | | |
| 2,027,949 | |
| Total
cash and cash equivalents | |
| 5,377,576 | | |
| 6,069,667 | | |
| 6,698,147 | | |
| 6,680,136 | | |
| 2,240,222 | |
| | |
| | | |
| | | |
| | | |
| | | |
| | |
| Securities available-for-sale | |
| 2,346,864 | | |
| 4,487,172 | | |
| 4,708,519 | | |
| 4,848,607 | | |
| 4,843,487 | |
| Securities held-to-maturity | |
| 2,287,291 | | |
| 2,282,586 | | |
| 2,278,202 | | |
| 2,273,650 | | |
| 2,269,135 | |
| FRB and
FHLB stock | |
| 126,346 | | |
| 17,250 | | |
| 17,250 | | |
| 147,150 | | |
| 34,290 | |
| Total investment
securities | |
| 4,760,501 | | |
| 6,787,008 | | |
| 7,003,971 | | |
| 7,269,407 | | |
| 7,146,912 | |
| | |
| | | |
| | | |
| | | |
| | | |
| | |
| Loans
held for sale | |
| 122,757 | | |
| 188,866 | | |
| 478,146 | | |
| 2,796,208 | | |
| 65,076 | |
| | |
| | | |
| | | |
| | | |
| | | |
| | |
| Gross loans and leases held
for investment | |
| 25,534,730 | | |
| 21,969,789 | | |
| 22,311,292 | | |
| 25,770,912 | | |
| 28,726,016 | |
| Deferred
fees, net | |
| (45,043 | ) | |
| (48,843 | ) | |
| (53,082 | ) | |
| (98,531 | ) | |
| (116,887 | ) |
| Total
loans and leases held for investment, net of deferred fees | |
| 25,489,687 | | |
| 21,920,946 | | |
| 22,258,210 | | |
| 25,672,381 | | |
| 28,609,129 | |
| Allowance
for loan and lease losses | |
| (281,687 | ) | |
| (222,297 | ) | |
| (219,234 | ) | |
| (210,055 | ) | |
| (200,732 | ) |
| Total
loans and leases held for investment, net | |
| 25,208,000 | | |
| 21,698,649 | | |
| 22,038,976 | | |
| 25,462,326 | | |
| 28,408,397 | |
| | |
| | | |
| | | |
| | | |
| | | |
| | |
| Equipment leased to others under
operating leases | |
| 344,325 | | |
| 352,330 | | |
| 380,022 | | |
| 399,972 | | |
| 404,245 | |
| Premises and equipment, net | |
| 146,798 | | |
| 50,236 | | |
| 57,078 | | |
| 60,358 | | |
| 54,315 | |
| Foreclosed assets, net | |
| 7,394 | | |
| 6,829 | | |
| 8,426 | | |
| 2,135 | | |
| 5,022 | |
| Goodwill | |
| 198,627 | | |
| - | | |
| - | | |
| - | | |
| 1,376,736 | |
| Core deposit and customer relationship
intangibles, net | |
| 165,477 | | |
| 24,192 | | |
| 26,581 | | |
| 28,970 | | |
| 31,381 | |
| Deferred tax asset, net | |
| 739,111 | | |
| 506,248 | | |
| 426,304 | | |
| 342,557 | | |
| 281,848 | |
| Other assets | |
| 1,463,498 | | |
| 1,193,808 | | |
| 1,219,599 | | |
| 1,260,912 | | |
| 1,214,782 | |
| Total
assets | |
$ | 38,534,064 | | |
$ | 36,877,833 | | |
$ | 38,337,250 | | |
$ | 44,302,981 | | |
$ | 41,228,936 | |
| | |
| | | |
| | | |
| | | |
| | | |
| | |
| LIABILITIES: | |
| | | |
| | | |
| | | |
| | | |
| | |
| Noninterest-bearing deposits | |
$ | 7,774,254 | | |
$ | 5,579,033 | | |
$ | 6,055,358 | | |
$ | 7,030,759 | | |
$ | 11,212,357 | |
| Interest-bearing
deposits | |
| 22,627,515 | | |
| 21,019,648 | | |
| 21,841,725 | | |
| 21,156,802 | | |
| 22,723,977 | |
| Total
deposits | |
| 30,401,769 | | |
| 26,598,681 | | |
| 27,897,083 | | |
| 28,187,561 | | |
| 33,936,334 | |
| Borrowings | |
| 2,911,322 | | |
| 6,294,525 | | |
| 6,357,338 | | |
| 11,881,712 | | |
| 1,764,030 | |
| Subordinated debt | |
| 936,599 | | |
| 870,896 | | |
| 870,378 | | |
| 868,815 | | |
| 867,087 | |
| Accrued
interest payable and other liabilities | |
| 893,609 | | |
| 714,454 | | |
| 679,256 | | |
| 593,416 | | |
| 710,954 | |
| Total
liabilities | |
| 35,143,299 | | |
| 34,478,556 | | |
| 35,804,055 | | |
| 41,531,504 | | |
| 37,278,405 | |
| | |
| | | |
| | | |
| | | |
| | | |
| | |
| STOCKHOLDERS' EQUITY: | |
| | | |
| | | |
| | | |
| | | |
| | |
| Preferred stock | |
| 498,516 | | |
| 498,516 | | |
| 498,516 | | |
| 498,516 | | |
| 498,516 | |
| Voting and non-voting common
stock (1) | |
| 1,690 | | |
| 1,231 | | |
| 1,233 | | |
| 1,232 | | |
| 1,230 | |
| Additional paid-in-capital | |
| 3,840,974 | | |
| 2,798,611 | | |
| 2,799,357 | | |
| 2,792,536 | | |
| 2,821,064 | |
| Retained earnings | |
| (518,301 | ) | |
| (25,399 | ) | |
| 7,892 | | |
| 215,253 | | |
| 1,420,624 | |
| Accumulated
other comprehensive loss, net | |
| (432,114 | ) | |
| (873,682 | ) | |
| (773,803 | ) | |
| (736,060 | ) | |
| (790,903 | ) |
| Total
stockholders’ equity | |
| 3,390,765 | | |
| 2,399,277 | | |
| 2,533,195 | | |
| 2,771,477 | | |
| 3,950,531 | |
| Total
liabilities and stockholders’ equity | |
$ | 38,534,064 | | |
$ | 36,877,833 | | |
$ | 38,337,250 | | |
$ | 44,302,981 | | |
$ | 41,228,936 | |
| | |
| | | |
| | | |
| | | |
| | | |
| | |
| Common shares outstanding | |
| 168,951,632 | | |
| 78,806,969 | | |
| 78,939,024 | | |
| 78,988,424 | | |
| 78,973,869 | |
(1) Includes
non-voting common equivalents of $108.
| | 17 |
BANC
OF CALIFORNIA, INC.
CONSOLIDATED
STATEMENTS OF EARNINGS (LOSS) (UNAUDITED)
| | |
Three
Months Ended | | |
Year Ended | |
| | |
December 31, | | |
September 30, | | |
December 31, | | |
December 31, | |
| | |
2023 | | |
2023 | | |
2022 | | |
2023 | | |
2022 | |
| | |
| | |
| | |
| | |
| | |
| |
| | |
(In thousands, except per share
amounts) | |
| Interest income: | |
| | | |
| | | |
| | | |
| | | |
| | |
| Loans and leases | |
$ | 346,308 | | |
$ | 310,392 | | |
$ | 404,985 | | |
$ | 1,496,357 | | |
$ | 1,312,580 | |
| Investment securities | |
| 41,280 | | |
| 45,326 | | |
| 50,292 | | |
| 174,996 | | |
| 209,751 | |
| Deposits in financial institutions | |
| 79,652 | | |
| 90,366 | | |
| 17,746 | | |
| 299,647 | | |
| 34,158 | |
| Total interest income | |
| 467,240 | | |
| 446,084 | | |
| 473,023 | | |
| 1,971,000 | | |
| 1,556,489 | |
| Interest expense: | |
| | | |
| | | |
| | | |
| | | |
| | |
| Deposits | |
| 207,760 | | |
| 205,982 | | |
| 117,591 | | |
| 748,423 | | |
| 200,449 | |
| Borrowings | |
| 92,474 | | |
| 94,234 | | |
| 19,962 | | |
| 416,744 | | |
| 25,645 | |
| Subordinated debt | |
| 15,955 | | |
| 15,139 | | |
| 12,531 | | |
| 58,705 | | |
| 39,633 | |
| Total interest expense | |
| 316,189 | | |
| 315,355 | | |
| 150,084 | | |
| 1,223,872 | | |
| 265,727 | |
| Net interest income | |
| 151,051 | | |
| 130,729 | | |
| 322,939 | | |
| 747,128 | | |
| 1,290,762 | |
| Provision for credit losses | |
| 47,000 | | |
| - | | |
| 10,000 | | |
| 52,000 | | |
| 24,500 | |
| Net interest
income after provision for credit losses | |
| 104,051 | | |
| 130,729 | | |
| 312,939 | | |
| 695,128 | | |
| 1,266,262 | |
| Noninterest income: | |
| | | |
| | | |
| | | |
| | | |
| | |
| Service charges on deposit accounts | |
| 4,562 | | |
| 4,018 | | |
| 3,178 | | |
| 16,468 | | |
| 13,991 | |
| Other commissions and fees | |
| 8,860 | | |
| 7,641 | | |
| 11,208 | | |
| 38,086 | | |
| 43,635 | |
| Leased equipment income | |
| 12,369 | | |
| 14,554 | | |
| 12,322 | | |
| 63,167 | | |
| 50,586 | |
| (Loss) gain on sale of loans and leases | |
| (3,526 | ) | |
| (1,901 | ) | |
| 388 | | |
| (161,346 | ) | |
| 518 | |
| Loss on sale of securities | |
| (442,413 | ) | |
| - | | |
| (49,302 | ) | |
| (442,413 | ) | |
| (50,321 | ) |
| Dividends and gains (losses) on
equity investments | |
| 8,138 | | |
| 3,837 | | |
| 661 | | |
| 15,731 | | |
| (3,389 | ) |
| Warrant (loss) income | |
| (173 | ) | |
| (88 | ) | |
| (46 | ) | |
| (718 | ) | |
| 2,490 | |
| LOCOM HFS adjustment | |
| 3,175 | | |
| 307 | | |
| - | | |
| (8,461 | ) | |
| - | |
| Other income | |
| 8,606 | | |
| 15,440 | | |
| 2,635 | | |
| 31,201 | | |
| 17,317 | |
| Total noninterest (loss) income | |
| (400,402 | ) | |
| 43,808 | | |
| (18,956 | ) | |
| (448,285 | ) | |
| 74,827 | |
| Noninterest expense: | |
| | | |
| | | |
| | | |
| | | |
| | |
| Compensation | |
| 89,354 | | |
| 71,642 | | |
| 106,124 | | |
| 332,353 | | |
| 406,839 | |
| Occupancy | |
| 15,925 | | |
| 15,293 | | |
| 14,922 | | |
| 61,668 | | |
| 60,964 | |
| Data processing | |
| 11,247 | | |
| 11,104 | | |
| 9,722 | | |
| 44,252 | | |
| 38,177 | |
| Other professional services | |
| 2,980 | | |
| 5,597 | | |
| 6,924 | | |
| 24,623 | | |
| 30,278 | |
| Insurance and assessments | |
| 60,016 | | |
| 38,298 | | |
| 7,205 | | |
| 135,666 | | |
| 25,486 | |
| Intangible asset amortization | |
| 4,230 | | |
| 2,389 | | |
| 2,629 | | |
| 11,419 | | |
| 13,576 | |
| Leased equipment depreciation | |
| 7,447 | | |
| 8,333 | | |
| 8,627 | | |
| 34,243 | | |
| 35,658 | |
| Foreclosed assets expense (income), net | |
| 1,764 | | |
| (609 | ) | |
| (108 | ) | |
| 1,520 | | |
| (3,737 | ) |
| Acquisition, integration and reorganization
costs | |
| 111,800 | | |
| 9,925 | | |
| 5,703 | | |
| 142,633 | | |
| 5,703 | |
| Customer related expense | |
| 45,826 | | |
| 26,971 | | |
| 18,197 | | |
| 124,104 | | |
| 55,273 | |
| Loan expense | |
| 4,446 | | |
| 4,243 | | |
| 6,150 | | |
| 20,458 | | |
| 24,572 | |
| Goodwill impairment | |
| - | | |
| - | | |
| 29,000 | | |
| 1,376,736 | | |
| 29,000 | |
| Other expense | |
| 8,603 | | |
| 7,917 | | |
| 11,737 | | |
| 148,506 | | |
| 51,732 | |
| Total noninterest expense | |
| 363,638 | | |
| 201,103 | | |
| 226,832 | | |
| 2,458,181 | | |
| 773,521 | |
| (Loss) earnings before income taxes | |
| (659,989 | ) | |
| (26,566 | ) | |
| 67,151 | | |
| (2,211,338 | ) | |
| 567,568 | |
| Income tax (benefit) expense | |
| (177,034 | ) | |
| (3,222 | ) | |
| 17,642 | | |
| (312,201 | ) | |
| 143,955 | |
| Net (loss) earnings | |
| (482,955 | ) | |
| (23,344 | ) | |
| 49,509 | | |
| (1,899,137 | ) | |
| 423,613 | |
| Preferred stock dividends | |
| 9,947 | | |
| 9,947 | | |
| 9,947 | | |
| 39,788 | | |
| 19,339 | |
| Net (loss)
earnings available to common and equivalent stockholders | |
$ | (492,902 | ) | |
$ | (33,291 | ) | |
$ | 39,562 | | |
$ | (1,938,925 | ) | |
$ | 404,274 | |
| Basic and diluted (loss) earnings
per common share (1) | |
$ | (4.55 | ) | |
$ | (0.42 | ) | |
$ | 0.50 | | |
$ | (22.71 | ) | |
$ | 5.14 | |
| Basic and diluted weighted average
number of common shares outstanding (1) | |
| 108,290 | | |
| 77,881 | | |
| 77,390 | | |
| 85,394 | | |
| 77,271 | |
(1) Common shares include non-voting
common equivalents that are participating securities.
| | 18 |
BANC OF CALIFORNIA, INC.
SELECTED FINANCIAL DATA
(UNAUDITED)
| | |
Three
Months Ended | | |
Year Ended | |
| | |
December 31, | | |
September 30, | | |
December 31, | | |
December 31, | |
| Profitability
and Other Ratios | |
2023 | | |
2023 | | |
2022 | | |
2023 | | |
2022 | |
| Return
on average assets ("ROAA")(1) | |
| (5.09 | )% | |
| (0.24 | )% | |
| 0.48 | % | |
| (4.71 | )% | |
| 1.05 | % |
| Pre-tax, pre-provision,
pre-goodwill impairment ROAA (1)(2) | |
| (6.46 | )% | |
| (0.28 | )% | |
| 1.02 | % | |
| (1.94 | )% | |
| 1.53 | % |
| Adjusted pre-tax,
pre-provision, pre-goodwill impairment ROAA (1)(2) | |
| (0.70 | )% | |
| (0.33 | )% | |
| 1.55 | % | |
| 0.14 | % | |
| 1.67 | % |
| Return on average
equity (1) | |
| (68.49 | )% | |
| (3.73 | )% | |
| 5.04 | % | |
| (63.42 | )% | |
| 10.99 | % |
| Return on average
tangible common equity (1)(2) | |
| (87.95 | )% | |
| (6.33 | )% | |
| 12.71 | % | |
| (30.66 | )% | |
| 20.52 | % |
| Dividend payout
ratio (3) | |
| (2.42 | )% | |
| (2.38 | )% | |
| 50.00 | % | |
| (1.67 | )% | |
| 19.46 | % |
| Yield on average
loans and leases (1) | |
| 5.82 | % | |
| 5.54 | % | |
| 5.73 | % | |
| 5.92 | % | |
| 5.07 | % |
| Cost of average interest-bearing
deposits (1) | |
| 3.80 | % | |
| 3.78 | % | |
| 2.14 | % | |
| 3.46 | % | |
| 0.97 | % |
| Cost of average total deposits
(1) | |
| 2.94 | % | |
| 2.98 | % | |
| 1.37 | % | |
| 2.61 | % | |
| 0.59 | % |
| Net interest
spread | |
| 0.72 | % | |
| 0.60 | % | |
| 2.53 | % | |
| 1.07 | % | |
| 3.02 | % |
| Net interest
margin (1) | |
| 1.69 | % | |
| 1.45 | % | |
| 3.41 | % | |
| 1.98 | % | |
| 3.49 | % |
| Noninterest
income to total revenue (4) | |
| 160.58 | % | |
| 25.10 | % | |
| (6.24 | )% | |
| (150.01 | )% | |
| 5.48 | % |
| Adjusted noninterest
income to adjusted total revenue (2)(4) | |
| 18.56 | % | |
| 18.31 | % | |
| 8.59 | % | |
| 16.07 | % | |
| 8.84 | % |
| Noninterest
expense to average total assets (1) | |
| 3.83 | % | |
| 2.11 | % | |
| 2.19 | % | |
| 6.10 | % | |
| 1.91 | % |
| Adjusted noninterest
expense to average total assets (1)(2) | |
| 2.65 | % | |
| 2.01 | % | |
| 1.85 | % | |
| 2.06 | % | |
| 1.83 | % |
| Efficiency ratio
(2)(5) | |
| 127.34 | % | |
| 108.51 | % | |
| 53.67 | % | |
| 124.91 | % | |
| 51.48 | % |
| Adjusted efficiency
ratio (2)(6) | |
| 114.89 | % | |
| 118.35 | % | |
| 53.67 | % | |
| 88.34 | % | |
| 51.48 | % |
| Average loans
and leases to average deposits | |
| 84.34 | % | |
| 81.03 | % | |
| 82.71 | % | |
| 88.32 | % | |
| 76.08 | % |
| Average investment
securities to average total assets | |
| 16.01 | % | |
| 18.30 | % | |
| 19.01 | % | |
| 16.94 | % | |
| 22.53 | % |
| Average stockholders'
equity to average total assets | |
| 7.43 | % | |
| 6.56 | % | |
| 9.47 | % | |
| 7.43 | % | |
| 9.52 | % |
| (3) | Ratio
calculated by dividing dividends declared per common share by basic earnings per common share. |
| (4) | Total
revenue equals the sum of net interest income and noninterest income. |
| (5) | Ratio
calculated by dividing noninterest expense (less intangible asset amortization, foreclosed
assets expense, goodwill impairment, and acquisition, integration and reorganization costs)
by total revenue (less gain on sale of securities). |
| (6) | Ratio
calculated by dividing adjusted noninterest expense by adjusted total revenue. |
| | 19 |
BANC OF CALIFORNIA, INC.
AVERAGE BALANCE, AVERAGE YIELD EARNED,
AND AVERAGE COST PAID
(UNAUDITED)
| | |
Three
Months Ended | |
| | |
December 31,
2023 | | |
September 30,
2023 | | |
December 31,
2022 | |
| | |
| | |
Interest | | |
Average | | |
| | |
Interest | | |
Average | | |
| | |
Interest | | |
Average | |
| | |
Average | | |
Income/ | | |
Yield/ | | |
Average | | |
Income/ | | |
Yield/ | | |
Average | | |
Income/ | | |
Yield/ | |
| | |
Balance | | |
Expense | | |
Cost | | |
Balance | | |
Expense | | |
Cost | | |
Balance | | |
Expense | | |
Cost | |
| | |
| | |
| | |
| | |
| | |
| | |
| | |
| | |
| | |
| |
| | |
(Dollars
in thousands) | |
| Assets: | |
| | |
| | |
| | |
| | |
| | |
| | |
| | |
| | |
| |
| Loans
and leases (1)(2)(3) | |
$ | 23,608,246 | | |
$ | 346,308 | | |
| 5.82 | % | |
$ | 22,226,390 | | |
$ | 310,392 | | |
| 5.54 | % | |
$ | 28,192,953 | | |
$ | 407,135 | | |
| 5.73 | % |
| Investment
securities (3) | |
| 6,024,737 | | |
| 41,280 | | |
| 2.72 | % | |
| 6,919,948 | | |
| 45,326 | | |
| 2.60 | % | |
| 7,824,915 | | |
| 50,697 | | |
| 2.57 | % |
| Deposits
in financial institutions | |
| 5,791,739 | | |
| 79,652 | | |
| 5.46 | % | |
| 6,645,335 | | |
| 90,366 | | |
| 5.40 | % | |
| 1,881,950 | | |
| 17,746 | | |
| 3.74 | % |
| Total
interest-earning assets (1) | |
| 35,424,722 | | |
| 467,240 | | |
| 5.23 | % | |
| 35,791,673 | | |
| 446,084 | | |
| 4.94 | % | |
| 37,899,818 | | |
| 475,578 | | |
| 4.98 | % |
| Other
assets | |
| 2,215,665 | | |
| | | |
| | | |
| 2,016,085 | | |
| | | |
| | | |
| 3,252,145 | | |
| | | |
| | |
| Total
assets | |
$ | 37,640,387 | | |
| | | |
| | | |
$ | 37,807,758 | | |
| | | |
| | | |
$ | 41,151,963 | | |
| | | |
| | |
| | |
| | | |
| | | |
| | | |
| | | |
| | | |
| | | |
| | | |
| | | |
| | |
| Liabilities
and Stockholders' Equity: | |
| | | |
| | | |
| | | |
| | | |
| | | |
| | | |
| | | |
| | | |
| | |
| Interest
checking | |
$ | 7,296,234 | | |
| 60,743 | | |
| 3.30 | % | |
$ | 6,983,013 | | |
| 57,237 | | |
| 3.25 | % | |
$ | 7,146,333 | | |
| 41,427 | | |
| 2.30 | % |
| Money
market | |
| 5,758,074 | | |
| 44,279 | | |
| 3.05 | % | |
| 5,662,980 | | |
| 42,516 | | |
| 2.98 | % | |
| 10,088,641 | | |
| 51,687 | | |
| 2.03 | % |
| Savings | |
| 1,696,222 | | |
| 16,446 | | |
| 3.85 | % | |
| 1,163,827 | | |
| 10,255 | | |
| 3.50 | % | |
| 616,298 | | |
| 66 | | |
| 0.04 | % |
| Time | |
| 6,915,504 | | |
| 86,292 | | |
| 4.95 | % | |
| 7,801,880 | | |
| 95,974 | | |
| 4.88 | % | |
| 3,909,130 | | |
| 24,411 | | |
| 2.48 | % |
| Total
interest-bearing deposits | |
| 21,666,034 | | |
| 207,760 | | |
| 3.80 | % | |
| 21,611,700 | | |
| 205,982 | | |
| 3.78 | % | |
| 21,760,402 | | |
| 117,591 | | |
| 2.14 | % |
| Borrowings | |
| 5,229,425 | | |
| 92,474 | | |
| 7.02 | % | |
| 6,325,537 | | |
| 94,234 | | |
| 5.91 | % | |
| 1,675,738 | | |
| 19,962 | | |
| 4.73 | % |
| Subordinated
debt | |
| 894,219 | | |
| 15,955 | | |
| 7.08 | % | |
| 870,968 | | |
| 15,139 | | |
| 6.90 | % | |
| 864,581 | | |
| 12,531 | | |
| 5.75 | % |
| Total
interest-bearing liabilities | |
| 27,789,678 | | |
| 316,189 | | |
| 4.51 | % | |
| 28,808,205 | | |
| 315,355 | | |
| 4.34 | % | |
| 24,300,721 | | |
| 150,084 | | |
| 2.45 | % |
| Noninterest-bearing
demand deposits | |
| 6,326,511 | | |
| | | |
| | | |
| 5,817,488 | | |
| | | |
| | | |
| 12,325,902 | | |
| | | |
| | |
| Other
liabilities | |
| 726,414 | | |
| | | |
| | | |
| 701,355 | | |
| | | |
| | | |
| 626,540 | | |
| | | |
| | |
| Total
liabilities | |
| 34,842,603 | | |
| | | |
| | | |
| 35,327,048 | | |
| | | |
| | | |
| 37,253,163 | | |
| | | |
| | |
| Stockholders'
equity | |
| 2,797,784 | | |
| | | |
| | | |
| 2,480,710 | | |
| | | |
| | | |
| 3,898,800 | | |
| | | |
| | |
| Total
liabilities and stockholders' equity | |
$ | 37,640,387 | | |
| | | |
| | | |
$ | 37,807,758 | | |
| | | |
| | | |
$ | 41,151,963 | | |
| | | |
| | |
| Net
interest income (1) | |
| | | |
$ | 151,051 | | |
| | | |
| | | |
$ | 130,729 | | |
| | | |
| | | |
$ | 325,494 | | |
| | |
| Net
interest spread (1) | |
| | | |
| | | |
| 0.72 | % | |
| | | |
| | | |
| 0.60 | % | |
| | | |
| | | |
| 2.53 | % |
| Net
interest margin (1) | |
| | | |
| | | |
| 1.69 | % | |
| | | |
| | | |
| 1.45 | % | |
| | | |
| | | |
| 3.41 | % |
| | |
| | | |
| | | |
| | | |
| | | |
| | | |
| | | |
| | | |
| | | |
| | |
| Total
deposits (4) | |
$ | 27,992,545 | | |
$ | 207,760 | | |
| 2.94 | % | |
$ | 27,429,188 | | |
$ | 205,982 | | |
| 2.98 | % | |
$ | 34,086,304 | | |
$ | 117,591 | | |
| 1.37 | % |
| Total
funds (5) | |
$ | 34,116,189 | | |
$ | 316,189 | | |
| 3.68 | % | |
$ | 34,625,693 | | |
$ | 315,355 | | |
| 3.61 | % | |
$ | 36,626,623 | | |
$ | 150,084 | | |
| 1.63 | % |
| (2) | Includes
net loan discount accretion of $15.7 million for the three months ended December 31,
2023 and net loan premium amortization of $1.7 million and $2.5 million for the three months
ended September 30, 2023 and December 31, 2022. |
| (3) | Includes
tax-equivalent adjustments of $0.0 million, $0.0 million, and $2.2 million for the three
months ended December 31, 2023, September 30, 2023, and December 31, 2022
related to tax-exempt income on loans. Includes tax-equivalent adjustments of $0.0 million,
$0.0 million, and $0.4 million for the three months ended December 31, 2023,September 30,
2023, and December 31, 2022 related to tax-exempt income on investment securities. The
federal statutory tax rate utilized was 21%. |
| (4) | Total
deposits is the sum of total interest-bearing deposits and noninterest-bearing demand deposits.
The cost of total deposits is calculated as annualized interest expense on total deposits
divided by average total deposits. |
| (5) | Total
funds is the sum of total interest-bearing liabilities and noninterest-bearing demand deposits.
The cost of total funds is calculated as annualized total interest expense divided by average
total funds. |
| | 20 |
BANC OF CALIFORNIA, INC.
AVERAGE BALANCE, AVERAGE YIELD EARNED,
AND AVERAGE COST PAID
(UNAUDITED)
| | |
Year Ended | |
| | |
December 31,
2023 | | |
December 31,
2022 | |
| | |
| | |
Interest | | |
Average | | |
| | |
Interest | | |
Average | |
| | |
Average | | |
Income/ | | |
Yield/ | | |
Average | | |
Income/ | | |
Yield/ | |
| | |
Balance | | |
Expense | | |
Cost | | |
Balance | | |
Expense | | |
Cost | |
| | |
| | |
| | |
| | |
| | |
| | |
| |
| | |
(Dollars in thousands) | |
| Assets: | |
| | |
| | |
| | |
| | |
| | |
| |
| Loans and leases (1)(2)(3) | |
$ | 25,330,351 | | |
$ | 1,498,701 | | |
| 5.92 | % | |
$ | 26,044,463 | | |
$ | 1,320,449 | | |
| 5.07 | % |
| Investment securities (3) | |
| 6,827,059 | | |
| 174,996 | | |
| 2.56 | % | |
| 9,120,717 | | |
| 215,624 | | |
| 2.36 | % |
| Deposits in financial institutions | |
| 5,746,858 | | |
| 299,647 | | |
| 5.21 | % | |
| 2,185,585 | | |
| 34,158 | | |
| 1.56 | % |
| Total interest-earning assets (1) | |
| 37,904,268 | | |
| 1,973,344 | | |
| 5.21 | % | |
| 37,350,765 | | |
| 1,570,231 | | |
| 4.20 | % |
| Other assets | |
| 2,389,112 | | |
| | | |
| | | |
| 3,130,816 | | |
| | | |
| | |
| Total assets | |
$ | 40,293,380 | | |
| | | |
| | | |
$ | 40,481,581 | | |
| | | |
| | |
| | |
| | | |
| | | |
| | | |
| | | |
| | | |
| | |
| Liabilities
and Stockholders' Equity: | |
| | | |
| | | |
| | | |
| | | |
| | | |
| | |
| Interest checking | |
$ | 6,992,888 | | |
| 220,735 | | |
| 3.16 | % | |
$ | 6,851,831 | | |
| 66,494 | | |
| 0.97 | % |
| Money market | |
| 6,724,296 | | |
| 190,027 | | |
| 2.83 | % | |
| 10,601,028 | | |
| 95,376 | | |
| 0.90 | % |
| Savings | |
| 1,051,117 | | |
| 30,978 | | |
| 2.95 | % | |
| 639,720 | | |
| 188 | | |
| 0.03 | % |
| Time | |
| 6,840,920 | | |
| 306,683 | | |
| 4.48 | % | |
| 2,540,426 | | |
| 38,391 | | |
| 1.51 | % |
| Total interest-bearing deposits | |
| 21,609,221 | | |
| 748,423 | | |
| 3.46 | % | |
| 20,633,005 | | |
| 200,449 | | |
| 0.97 | % |
| Borrowings | |
| 7,068,826 | | |
| 416,744 | | |
| 5.90 | % | |
| 961,601 | | |
| 25,645 | | |
| 2.67 | % |
| Subordinated debt | |
| 875,621 | | |
| 58,705 | | |
| 6.70 | % | |
| 863,883 | | |
| 39,633 | | |
| 4.59 | % |
| Total interest-bearing liabilities | |
| 29,553,668 | | |
| 1,223,872 | | |
| 4.14 | % | |
| 22,458,489 | | |
| 265,727 | | |
| 1.18 | % |
| | |
| | | |
| | | |
| | | |
| | | |
| | | |
| | |
| Noninterest-bearing
demand deposits | |
| 7,072,334 | | |
| | | |
| | | |
| 13,601,766 | | |
| | | |
| | |
| Other liabilities | |
| 672,950 | | |
| | | |
| | | |
| 568,293 | | |
| | | |
| | |
| Total liabilities | |
| 37,298,952 | | |
| | | |
| | | |
| 36,628,548 | | |
| | | |
| | |
| Stockholders' equity | |
| 2,994,428 | | |
| | | |
| | | |
| 3,853,033 | | |
| | | |
| | |
| Total liabilities
and stockholders' equity | |
$ | 40,293,380 | | |
| | | |
| | | |
$ | 40,481,581 | | |
| | | |
| | |
| Net interest income (1) | |
| | | |
$ | 749,472 | | |
| | | |
| | | |
$ | 1,304,504 | | |
| | |
| Net interest spread (1) | |
| | | |
| | | |
| 1.07 | % | |
| | | |
| | | |
| 3.02 | % |
| Net interest margin (1) | |
| | | |
| | | |
| 1.98 | % | |
| | | |
| | | |
| 3.49 | % |
| | |
| | | |
| | | |
| | | |
| | | |
| | | |
| | |
| Total deposits (4) | |
$ | 28,681,555 | | |
$ | 748,423 | | |
| 2.61 | % | |
$ | 34,234,771 | | |
$ | 200,449 | | |
| 0.59 | % |
| Total funds (5) | |
$ | 36,626,002 | | |
$ | 1,223,872 | | |
| 3.34 | % | |
$ | 36,060,255 | | |
$ | 265,727 | | |
| 0.74 | % |
| (2) | Includes
net loan discount accretion of $9.7 million for the year ended December 31, 2023 and
net loan premium amortization of $17.9 million for the year ended December 31, 2022. |
| (3) | Includes
tax-equivalent adjustments of $2.3 million and $7.9 million for the years ended December 31,
2023 and 2022 related to tax-exempt income on loans. Includes tax-equivalent adjustments
of $0.0 million and $5.9 million for the years ended December 31, 2023 and 2022 related
to tax-exempt income on investment securities. The federal statutory tax rate utilized was
21%. |
| (4) | Total
deposits is the sum of total interest-bearing deposits and noninterest-bearing demand deposits.
The cost of total deposits is calculated as annualized interest expense on total deposits
divided by average total deposits. |
| (5) | Total
funds is the sum of total interest-bearing liabilities and noninterest-bearing demand deposits.
The cost of total funds is calculated as annualized total interest expense divided by average
total funds. |
| | 21 |
BANC OF CALIFORNIA, INC.
NON-GAAP MEASURES
Under Item 10(e) of SEC
Regulation S-K, public companies disclosing financial measures in filings with the SEC that are not calculated in accordance with GAAP
must also disclose, along with each non-GAAP financial measure, certain additional information, including a presentation of the most
directly comparable GAAP financial measure, a reconciliation of the non-GAAP financial measure to the most directly comparable GAAP financial
measure, as well as a statement of the reasons why the company's management believes that presentation of the non-GAAP financial measure
provides useful information to investors regarding the company's financial condition and results of operations and, to the extent material,
a statement of the additional purposes, if any, for which the company's management uses the non-GAAP financial measure.
Tangible assets, tangible equity,
tangible common equity, tangible common equity to tangible assets, tangible book value per common share, return on average tangible common
equity, adjusted noninterest income, adjusted noninterest expense, adjusted noninterest income to adjusted total revenue, adjusted noninterest
expense to average total assets, pre-tax, pre-provision, pre-goodwill impairment (“PTPP”) income, adjusted PTPP income, PTPP
return on average assets (“ROAA”), adjusted PTPP ROAA, efficiency ratio, and adjusted efficiency ratio constitute supplemental
financial information determined by methods other than in accordance with GAAP. These non-GAAP measures are used by management in its
analysis of the Company's performance.
Tangible assets and tangible
equity are calculated by subtracting goodwill and other intangible assets from total assets and total stockholders’ equity. Tangible
common equity is calculated by subtracting preferred stock, as applicable, from tangible equity. Return on average tangible common equity
is calculated by dividing net earnings available to common stockholders, after adjustment for amortization of intangible assets and goodwill
impairment, by average tangible common equity. Banking regulators also exclude goodwill and other intangible assets from stockholders'
equity when assessing the capital adequacy of a financial institution.
PTPP income is calculated by
adding net interest income and noninterest income (total revenue), subtracting noninterest expense, and adding goodwill impairment. Adjusted
PTPP income is calculated by adding net interest income and adjusted noninterest income (adjusted total revenue) and subtracting adjusted
noninterest expense. PTPP ROAA is calculated by dividing annualized PTPP income by average assets. Adjusted PTPP ROAA is calculated by
dividing annualized adjusted PTPP income by average assets. Efficiency ratio is calculated by dividing noninterest expense (less intangible
asset amortization, net foreclosed assets expense, goodwill impairment, and acquisition, integration and reorganization costs) by total
revenue. Adjusted efficiency ratio is calculated by dividing adjusted noninterest expense by adjusted total revenue.
Management believes the presentation
of these financial measures adjusting the impact of these items provides useful supplemental information that is essential to a proper
understanding of the financial results and operating performance of the Company. This disclosure should not be viewed as a substitute
for results determined in accordance with GAAP, nor is it necessarily comparable to non-GAAP performance measures that may be presented
by other companies.
The following tables provide
reconciliations of the non-GAAP measures with financial measures defined by GAAP.
| | 22 |
BANC
OF CALIFORNIA, INC.
NON-GAAP
MEASURES
(UNAUDITED)
| Tangible Common Equity to | |
| | |
| | |
| | |
| | |
| |
| Tangible Assets and Tangible | |
December 31, | | |
September 30, | | |
June 30, | | |
March 31, | | |
December 31, | |
| Book Value Per Common Share | |
2023 | | |
2023 | | |
2023 | | |
2023 | | |
2022 | |
| | |
| | |
| | |
| | |
| | |
| |
| | |
(Dollars in
thousands, except per share amounts) | |
| Stockholders'
equity | |
$ | 3,390,765 | | |
$ | 2,399,277 | | |
$ | 2,533,195 | | |
$ | 2,771,477 | | |
$ | 3,950,531 | |
| Less:
Preferred stock | |
| 498,516 | | |
| 498,516 | | |
| 498,516 | | |
| 498,516 | | |
| 498,516 | |
| Total common equity | |
| 2,892,249 | | |
| 1,900,761 | | |
| 2,034,679 | | |
| 2,272,961 | | |
| 3,452,015 | |
| Less:
Intangible assets | |
| 364,104 | | |
| 24,192 | | |
| 26,581 | | |
| 28,970 | | |
| 1,408,117 | |
| Tangible common
equity | |
$ | 2,528,145 | | |
$ | 1,876,569 | | |
$ | 2,008,098 | | |
$ | 2,243,991 | | |
$ | 2,043,898 | |
| | |
| | | |
| | | |
| | | |
| | | |
| | |
| Total assets | |
$ | 38,534,064 | | |
$ | 36,877,833 | | |
$ | 38,337,250 | | |
$ | 44,302,981 | | |
$ | 41,228,936 | |
| Less:
Intangible assets | |
| 364,104 | | |
| 24,192 | | |
| 26,581 | | |
| 28,970 | | |
| 1,408,117 | |
| Tangible assets | |
$ | 38,169,960 | | |
$ | 36,853,641 | | |
$ | 38,310,669 | | |
$ | 44,274,011 | | |
$ | 39,820,819 | |
| | |
| | | |
| | | |
| | | |
| | | |
| | |
| Total stockholders'
equity to total assets | |
| 8.80 | % | |
| 6.51 | % | |
| 6.61 | % | |
| 6.26 | % | |
| 9.58 | % |
| Tangible common equity to tangible
assets | |
| 6.62 | % | |
| 5.09 | % | |
| 5.24 | % | |
| 5.07 | % | |
| 5.13 | % |
| Book value per common share (1)(4) | |
$ | 17.12 | | |
$ | 24.12 | | |
$ | 25.78 | | |
$ | 28.78 | | |
$ | 43.71 | |
| Tangible book value per common
share (2)(4) | |
$ | 14.96 | | |
$ | 23.81 | | |
$ | 25.44 | | |
$ | 28.41 | | |
$ | 25.88 | |
| Common shares outstanding (3)(4) | |
| 168,951,632 | | |
| 78,806,969 | | |
| 78,939,024 | | |
| 78,988,424 | | |
| 78,973,869 | |
| (1) | Total
common equity divided by common shares outstanding. |
| (2) | Tangible
common equity divided by common shares outstanding. |
| (3) | Common
shares outstanding include non-voting common equivalents that are participating securities. |
| (4) | Common
shares outstanding in prior periods have been restated by multiplying the historical amounts
by the Merger exchange ratio of 0.6569. |
| | 23 |
BANC
OF CALIFORNIA, INC.
NON-GAAP
MEASURES
(UNAUDITED)
| | |
Three
Months Ended | | |
Year Ended | |
| Return
on Average | |
December 31, | | |
September 30, | | |
December 31, | | |
December 31, | |
| Tangible
Common Equity | |
2023 | | |
2023 | | |
2022 | | |
2023 | | |
2022 | |
| | |
| | |
| | |
| | |
| | |
| |
| | |
(Dollars in thousands) | |
| Net
(loss) earnings | |
$ | (482,955 | ) | |
$ | (23,344 | ) | |
$ | 49,509 | | |
$ | (1,899,137 | ) | |
$ | 423,613 | |
| | |
| | | |
| | | |
| | | |
| | | |
| | |
| (Loss) earnings
before income taxes | |
$ | (659,989 | ) | |
$ | (26,566 | ) | |
$ | 67,151 | | |
$ | (2,211,338 | ) | |
$ | 567,568 | |
| Add: Goodwill
impairment | |
| - | | |
| - | | |
| 29,000 | | |
| 1,376,736 | | |
| 29,000 | |
| Add:
Intangible asset amortization | |
| 4,230 | | |
| 2,389 | | |
| 2,629 | | |
| 11,419 | | |
| 13,576 | |
| Adjusted (loss)
earnings before income taxes | |
| (655,759 | ) | |
| (24,177 | ) | |
| 98,780 | | |
| (823,183 | ) | |
| 610,144 | |
| Adjusted
income tax expense (1) | |
| (175,743 | ) | |
| (2,925 | ) | |
| 25,979 | | |
| (214,028 | ) | |
| 154,977 | |
| Adjusted net
(loss) earnings | |
| (480,016 | ) | |
| (21,252 | ) | |
| 72,801 | | |
| (609,155 | ) | |
| 455,167 | |
| Less:
Preferred stock dividends | |
| 9,947 | | |
| 9,947 | | |
| 9,947 | | |
| 39,788 | | |
| 19,339 | |
| Adjusted
net (loss) earnings available to common stockholders | |
$ | (489,963 | ) | |
$ | (31,199 | ) | |
$ | 62,854 | | |
$ | (648,943 | ) | |
$ | 435,828 | |
| | |
| | | |
| | | |
| | | |
| | | |
| | |
| Average stockholders' equity | |
$ | 2,797,784 | | |
$ | 2,480,710 | | |
$ | 3,898,800 | | |
$ | 2,994,428 | | |
$ | 3,853,033 | |
| Less: Average
intangible assets | |
| 89,041 | | |
| 25,499 | | |
| 1,438,173 | | |
| 379,005 | | |
| 1,443,528 | |
| Less:
Average preferred stock | |
| 498,516 | | |
| 498,516 | | |
| 498,516 | | |
| 498,516 | | |
| 285,488 | |
| Average
tangible common equity | |
$ | 2,210,227 | | |
$ | 1,956,695 | | |
$ | 1,962,111 | | |
$ | 2,116,907 | | |
$ | 2,124,017 | |
| | |
| | | |
| | | |
| | | |
| | | |
| | |
| Return on average
equity (2) | |
| (68.49 | )% | |
| (3.73 | )% | |
| 5.04 | % | |
| (63.42 | )% | |
| 10.99 | % |
| Return on average
tangible common equity (3) | |
| (87.95 | )% | |
| (6.33 | )% | |
| 12.71 | % | |
| (30.66 | )% | |
| 20.52 | % |
| (1) | Effective
tax rates of 26.8%, 12.1%, and 26.3% used for the three months ended December 31, 2023,
September 30, 2023, and December 31, 2022. Adjusted effective tax rate of 26.0%
used to normalize the effect of goodwill impairment for the year ended December 31,
2023; effective tax rate of 25.4% used for the year ended December 31, 2022. |
| (2) | Annualized
net (loss) earnings divided by average stockholders' equity. |
| (3) | Annualized
adjusted net (loss) earnings available to common stockholders divided by average tangible
common equity. |
| | 24 |
BANC
OF CALIFORNIA, INC.
NON-GAAP
MEASURES
(UNAUDITED)
| Adjusted
Noninterest Income to | |
Three
Months Ended | | |
Year Ended | |
| Adjusted
Total Revenue and Adjusted | |
December 31, | | |
September 30, | | |
December 31, | | |
December 31, | |
| Noninterest
Expense to Average Assets | |
2023 | | |
2023 | | |
2022 | | |
2023 | | |
2022 | |
| | |
| | |
| | |
| | |
| | |
| |
| | |
(Dollars in thousands) | |
| Net
interest income | |
$ | 151,051 | | |
$ | 130,729 | | |
$ | 322,939 | | |
$ | 747,128 | | |
$ | 1,290,762 | |
| Noninterest
(loss) income | |
| (400,402 | ) | |
| 43,808 | | |
| (18,956 | ) | |
| (448,285 | ) | |
| 74,827 | |
| Total
revenue | |
$ | (249,351 | ) | |
$ | 174,537 | | |
$ | 303,983 | | |
$ | 298,843 | | |
$ | 1,365,589 | |
| | |
| | | |
| | | |
| | | |
| | | |
| | |
| Noninterest
(loss) income | |
$ | (400,402 | ) | |
$ | 43,808 | | |
$ | (18,956 | ) | |
$ | (448,285 | ) | |
$ | 74,827 | |
| Add: Loss on
sale of securities | |
| 442,413 | | |
| - | | |
| 49,302 | | |
| 442,413 | | |
| 50,321 | |
| Less: Legal
recovery | |
| (7,587 | ) | |
| (14,500 | ) | |
| - | | |
| (22,087 | ) | |
| - | |
| Add:
Loan fair value loss adjustments | |
| - | | |
| - | | |
| - | | |
| 170,971 | | |
| - | |
| Adjusted noninterest
income | |
| 34,424 | | |
| 29,308 | | |
| 30,346 | | |
| 143,012 | | |
| 125,148 | |
| Net
interest income | |
| 151,051 | | |
| 130,729 | | |
| 322,939 | | |
| 747,128 | | |
| 1,290,762 | |
| Adjusted
total revenue | |
$ | 185,475 | | |
$ | 160,037 | | |
$ | 353,285 | | |
$ | 890,140 | | |
$ | 1,415,910 | |
| | |
| | | |
| | | |
| | | |
| | | |
| | |
| Noninterest
expense | |
$ | 363,638 | | |
$ | 201,103 | | |
$ | 226,832 | | |
$ | 2,458,181 | | |
$ | 773,521 | |
| Less: Goodwill
impairment | |
| - | | |
| - | | |
| (29,000 | ) | |
| (1,376,736 | ) | |
| (29,000 | ) |
| Less: Acquisition,
integration, and reorganization costs | |
| (111,800 | ) | |
| (9,925 | ) | |
| (5,703 | ) | |
| (142,633 | ) | |
| (5,703 | ) |
| Less:
Unfunded commitments fair value loss adjustments | |
| - | | |
| - | | |
| - | | |
| (106,767 | ) | |
| - | |
| Adjusted
noninterest expense | |
$ | 251,838 | | |
$ | 191,178 | | |
$ | 192,129 | | |
$ | 832,045 | | |
$ | 738,818 | |
| | |
| | | |
| | | |
| | | |
| | | |
| | |
| Average
total assets | |
$ | 37,640,387 | | |
$ | 37,807,758 | | |
$ | 41,151,963 | | |
$ | 40,293,380 | | |
$ | 40,481,581 | |
| | |
| | | |
| | | |
| | | |
| | | |
| | |
| Noninterest
(loss) income to total revenue | |
| 160.58 | % | |
| 25.10 | % | |
| (6.24 | )% | |
| (150.01 | )% | |
| 5.48 | % |
| Adjusted noninterest
income to adjusted total revenue | |
| 18.56 | % | |
| 18.31 | % | |
| 8.59 | % | |
| 16.07 | % | |
| 8.84 | % |
| Noninterest
expense to average total assets | |
| 3.83 | % | |
| 2.11 | % | |
| 2.19 | % | |
| 6.10 | % | |
| 1.91 | % |
| Adjusted noninterest
expense to average total assets | |
| 2.65 | % | |
| 2.01 | % | |
| 1.85 | % | |
| 2.06 | % | |
| 1.83 | % |
| | 25 |
BANC
OF CALIFORNIA, INC.
NON-GAAP
MEASURES
(UNAUDITED)
| | |
Three
Months Ended | | |
Year Ended | |
| PTPP Income, Adjusted PTPP Income, | |
December 31, | | |
September 30, | | |
December 31, | | |
December 31, | |
| PTPP ROAA, and Adjusted PTPP ROAA | |
2023 | | |
2023 | | |
2022 | | |
2023 | | |
2022 | |
| | |
| | |
| | |
| | |
| | |
| |
| | |
(Dollars in thousands) | |
| Net
(loss) earnings | |
$ | (482,955 | ) | |
$ | (23,344 | ) | |
$ | 49,509 | | |
$ | (1,899,137 | ) | |
$ | 423,613 | |
| | |
| | | |
| | | |
| | | |
| | | |
| | |
| Net interest
income | |
$ | 151,051 | | |
$ | 130,729 | | |
$ | 322,939 | | |
$ | 747,128 | | |
$ | 1,290,762 | |
| Add:
Noninterest (loss) income | |
| (400,402 | ) | |
| 43,808 | | |
| (18,956 | ) | |
| (448,285 | ) | |
| 74,827 | |
| Total revenue | |
| (249,351 | ) | |
| 174,537 | | |
| 303,983 | | |
| 298,843 | | |
| 1,365,589 | |
| Less: Noninterest
expense | |
| (363,638 | ) | |
| (201,103 | ) | |
| (226,832 | ) | |
| (2,458,181 | ) | |
| (773,521 | ) |
| Add:
Goodwill impairment | |
| - | | |
| - | | |
| 29,000 | | |
| 1,376,736 | | |
| 29,000 | |
| Pre-tax,
pre-provision, pre-goodwill impairment ("PTPP") income | |
$ | (612,989 | ) | |
$ | (26,566 | ) | |
$ | 106,151 | | |
$ | (782,602 | ) | |
$ | 621,068 | |
| | |
| | | |
| | | |
| | | |
| | | |
| | |
| Total revenue | |
$ | (249,351 | ) | |
$ | 174,537 | | |
$ | 303,983 | | |
$ | 298,843 | | |
$ | 1,365,589 | |
| Add: Loss on
sale of securities | |
| 442,413 | | |
| - | | |
| 49,302 | | |
| 442,413 | | |
| 50,321 | |
| Less: Legal
recovery | |
| (7,587 | ) | |
| (14,500 | ) | |
| - | | |
| (22,087 | ) | |
| - | |
| Add:
Loan fair value loss adjustments | |
| - | | |
| - | | |
| - | | |
| 170,971 | | |
| - | |
| Adjusted
total revenue | |
$ | 185,475 | | |
$ | 160,037 | | |
$ | 353,285 | | |
$ | 890,140 | | |
$ | 1,415,910 | |
| | |
| | | |
| | | |
| | | |
| | | |
| | |
| Noninterest
expense | |
$ | 363,638 | | |
$ | 201,103 | | |
$ | 226,832 | | |
$ | 2,458,181 | | |
$ | 773,521 | |
| Less: Goodwill
impairment | |
| - | | |
| - | | |
| (29,000 | ) | |
| (1,376,736 | ) | |
| (29,000 | ) |
| Less: Acquisition,
integration, and reorganization costs | |
| (111,800 | ) | |
| (9,925 | ) | |
| (5,703 | ) | |
| (142,633 | ) | |
| (5,703 | ) |
| Less:
Unfunded commitments fair value loss adjustments | |
| - | | |
| - | | |
| - | | |
| (106,767 | ) | |
| - | |
| Adjusted
noninterest expense | |
$ | 251,838 | | |
$ | 191,178 | | |
$ | 192,129 | | |
$ | 832,045 | | |
$ | 738,818 | |
| | |
| | | |
| | | |
| | | |
| | | |
| | |
| Adjusted total
revenue | |
$ | 185,475 | | |
$ | 160,037 | | |
$ | 353,285 | | |
$ | 890,140 | | |
$ | 1,415,910 | |
| Less:
Adjusted noninterest expense | |
| (251,838 | ) | |
| (191,178 | ) | |
| (192,129 | ) | |
| (832,045 | ) | |
| (738,818 | ) |
| Adjusted
pre-tax, pre-provision, pre- goodwill impairment ("PTPP") income | |
$ | (66,363 | ) | |
$ | (31,141 | ) | |
$ | 161,156 | | |
$ | 58,095 | | |
$ | 677,092 | |
| | |
| | | |
| | | |
| | | |
| | | |
| | |
| Average
total assets | |
$ | 37,640,387 | | |
$ | 37,807,758 | | |
$ | 41,151,963 | | |
$ | 40,293,380 | | |
$ | 40,481,581 | |
| | |
| | | |
| | | |
| | | |
| | | |
| | |
| Return on average
assets ("ROAA") | |
| (5.09 | )% | |
| (0.24 | )% | |
| 0.48 | % | |
| (4.71 | )% | |
| 1.05 | % |
| Pre-tax, pre-provision,
pre-goodwill impairment ("PTPP") ROAA (1) | |
| (6.46 | )% | |
| (0.28 | )% | |
| 1.02 | % | |
| (1.94 | )% | |
| 1.53 | % |
| Adjusted pre-tax,
pre-provision, pre-goodwill impairment ("PTPP") ROAA (2) | |
| (0.70 | )% | |
| (0.33 | )% | |
| 1.55 | % | |
| 0.14 | % | |
| 1.67 | % |
(1) Annualized
PTPP income divided by average assets.
(2) Annualized
adjusted PTPP income divided by average assets.
| | 26 |
BANC
OF CALIFORNIA, INC.
NON-GAAP
MEASURES
(UNAUDITED)
| | |
Three
Months Ended | | |
Year Ended | |
| | |
December 31, | | |
September 30, | | |
December 31, | | |
December 31, | |
| Adjusted
Efficiency Ratio | |
2023 | | |
2023 | | |
2022 | | |
2023 | | |
2022 | |
| | |
| | |
| | |
| | |
| | |
| |
| | |
(Dollars in thousands) | |
| Noninterest
expense | |
$ | 363,638 | | |
$ | 201,103 | | |
$ | 226,832 | | |
$ | 2,458,181 | | |
$ | 773,521 | |
| Less: Intangible
asset amortization | |
| 4,230 | | |
| 2,389 | | |
| 2,629 | | |
| 11,419 | | |
| 13,576 | |
| Less: Foreclosed
assets expense (income), net | |
| 1,764 | | |
| (609 | ) | |
| (108 | ) | |
| 1,520 | | |
| (3,737 | ) |
| Less: Goodwill
impairment | |
| - | | |
| - | | |
| 29,000 | | |
| 1,376,736 | | |
| 29,000 | |
| Less:
Acquisition, integration, and reorganization costs | |
| 111,800 | | |
| 9,925 | | |
| 5,703 | | |
| 142,633 | | |
| 5,703 | |
| Noninterest expense
used for efficiency ratio | |
| 245,844 | | |
| 189,398 | | |
| 189,608 | | |
| 925,873 | | |
| 728,979 | |
| Less: Unfunded
commitments fair value loss adjustments | |
| - | | |
| - | | |
| - | | |
| 106,767 | | |
| - | |
| Less:
FDIC special assessment | |
| 32,746 | | |
| - | | |
| - | | |
| 32,746 | | |
| - | |
| Noninterest
expense used for adjusted efficiency ratio | |
$ | 213,098 | | |
$ | 189,398 | | |
$ | 189,608 | | |
$ | 786,360 | | |
$ | 728,979 | |
| | |
| | | |
| | | |
| | | |
| | | |
| | |
| Net interest
income | |
$ | 151,051 | | |
$ | 130,729 | | |
$ | 322,939 | | |
$ | 747,128 | | |
$ | 1,290,762 | |
| Noninterest
(loss) income | |
| (400,402 | ) | |
| 43,808 | | |
| (18,956 | ) | |
| (448,285 | ) | |
| 74,827 | |
| Total revenue | |
| (249,351 | ) | |
| 174,537 | | |
| 303,983 | | |
| 298,843 | | |
| 1,365,589 | |
| Less:
Gain (loss) on sale of securities | |
| (442,413 | ) | |
| - | | |
| (49,302 | ) | |
| (442,413 | ) | |
| (50,321 | ) |
| Total revenue
used for efficiency ratio | |
| 193,062 | | |
| 174,537 | | |
| 353,285 | | |
| 741,256 | | |
| 1,415,910 | |
| Less: Legal
recovery | |
| (7,587 | ) | |
| (14,500 | ) | |
| - | | |
| (22,087 | ) | |
| - | |
| Add:
Loan fair value loss adjustments | |
| - | | |
| - | | |
| - | | |
| 170,971 | | |
| - | |
| Total
revenue used for adjusted efficiency ratio | |
$ | 185,475 | | |
$ | 160,037 | | |
$ | 353,285 | | |
$ | 890,140 | | |
$ | 1,415,910 | |
| | |
| | | |
| | | |
| | | |
| | | |
| | |
| Efficiency ratio
(1) | |
| 127.34 | % | |
| 108.51 | % | |
| 53.67 | % | |
| 124.91 | % | |
| 51.48 | % |
| Adusted efficiency
ratio (2) | |
| 114.89 | % | |
| 118.35 | % | |
| 53.67 | % | |
| 88.34 | % | |
| 51.48 | % |
(1) Noninterest
expense used for efficiency ratio divided by total revenue used for efficiency ratio.
(2) Noninterest
expense used for adjusted efficiency ratio divided by total revenue used for adjusted efficiency ratio.
| | 27 |
Exhibit 99.2

Investor Presentation 2023 Fourth Quarter Results Draft v4.5 1/21/24

Forward Looking Statements This presentation includes forward - looking statements within the meaning of the “Safe - Harbor” provisions of the Private Securiti es Litigation Reform Act of 1995. Words or phrases such as “believe,” “will,” “should,” “will likely result,” “are expected to,” “will continue,” “is anticipated,” “estimate,” “project,” “plans,” “s trategy,” or similar expressions are intended to identify these forward - looking statements. You are cautioned not to place undue reliance on any forward - looking statements. These statements are necessarily su bject to risk and uncertainty and actual results could differ materially from those anticipated due to various factors, including those set forth from time to time in the documents filed or furnishe d b y Banc of California, Inc. (the Company) with the Securities and Exchange Commission (SEC). The Company undertakes no obligation to revise or publicly release any revision or update to these forward - loo king statements to reflect events or circumstances that occur after the date on which such statements were made, except as required by law. Factors that could cause actual results to differ materially from the results anticipated or projected include, but are not l imi ted to: ( i ) changes in general economic conditions, either nationally or in our market areas, including the impact of supply chain disruptions, and the risk of recession or an economic downturn; (ii) chang es in the interest rate environment, including the recent and potential future increases in the FRB benchmark rate, which could adversely affect our revenue and expenses, the value of assets and obligatio ns, the availability and cost of capital and liquidity, and the impacts of continuing inflation; (iii) the credit risks of lending activities, which may be affected by deterioration in real estate mar ket s and the financial condition of borrowers, and the operational risk of lending activities, including the effectiveness of our underwriting practices and the risk of fraud, any of which may lead to increas ed loan delinquencies, losses, and non - performing assets, and may result in our allowance for credit losses not being adequate; (iv) fluctuations in the demand for loans, and fluctuations in commercial and re sidential real estate values in our market area; (v) the quality and composition of our securities portfolio; (vi) our ability to develop and maintain a strong core deposit base, including among ou r venture banking clients, or other low cost funding sources necessary to fund our activities particularly in a rising or high interest rate environment; (vii) the rapid withdrawal of a significant a mou nt of demand deposits over a short period of time; (viii) the costs and effects of litigation; (ix) risks related to the Company’s acquisitions, including disruption to current plans and operations; difficult ies in customer and employee retention; fees, expenses and charges related to these transactions being significantly higher than anticipated; and our inability to achieve expected revenues, cost savings, sy nergies, and other benefits; and in the case of our recent acquisition of PacWest Bancorp (PacWest), reputational risk, regulatory risk and potential adverse reactions of the Company's or PacWest's c ust omers, suppliers, vendors, employees or other business partners; (x) results of examinations by regulatory authorities of the Company and the possibility that any such regulatory authority may, amo ng other things, limit our business activities, restrict our ability to invest in certain assets, refrain from issuing an approval or non - objection to certain capital or other actions, increase our allowance fo r credit losses, result in write - downs of asset values, restrict our ability or that of our bank subsidiary to pay dividends, or impose fines, penalties or sanctions; (xi) legislative or regulatory changes that ad versely affect our business, including changes in tax laws and policies, accounting policies and practices, privacy laws, and regulatory capital or other rules; (xii) the risk that our enterprise ri sk management framework may not be effective in mitigating risk and reducing the potential for losses; (xiii) errors in estimates of the fair values of certain of our assets and liabilities, which may resul t i n significant changes in valuation; (xiv) failures or security breaches with respect to the network, applications, vendors and computer systems on which we depend, including due to cybersecurity threats; (xv) our abi lity to attract and retain key members of our senior management team; (xvi) the effects of climate change, severe weather events, natural disasters, pandemics, epidemics and other public health c ris es, acts of war or terrorism, and other external events on our business; (xvii) the impact of bank failures or other adverse developments at other banks on general investor sentiment regarding the s tab ility and liquidity of banks; (xviii) the possibility that our recorded goodwill could become impaired, which may have an adverse impact on our earnings and capital; (xix) our existing indebtedness, togethe r w ith any future incurrence of additional indebtedness, could adversely affect our ability to raise additional capital and to meet our debt obligations; (xx) the risk that we may suffer significant lo sses on future asset sales; and (xxi) other economic, competitive, governmental, regulatory, and technological factors affecting our operations, pricing, products and services and the other risks described in this presentation and from time to time in other documents that we file with or furnish to the SEC. . Fourth Quarter 2023 Earnings | 2

Table of Contents Fourth Quarter 2023 Earnings | 3 4 THE NEW BANC OF CALIFORNIA 10 UPDATE ON BALANCE SHEET 21 INTEGRATION AND RESTRUCTURING UPDATE 26 INVESTMENT THESIS 27 APPENDIX

The New Banc of California □ Merger closed on Nov. 30, 2023 □ Clear strategic focus on in - market banking with targeted specialty niches □ Expanding a high quality deposit franchise with sophisticated treasury management services □ Experienced management team with track record of execution □ High quality diversified assets □ Ability to serve expanded client base with personalized service and an elevated experience California’s premier commercial bank 1. Wholesale funding defined as borrowings plus brokered time deposits. 2. Core deposits defined as total deposits minus brokered time deposits. 3. Denotes a non - GAAP financial measure; see “Non - GAAP Reconciliation” slides at end of presentation. Fourth Quarter 2023 Earnings | 4 • $38.5bn of assets • ~3% SoCal deposit market share • #3 largest California - headquartered bank Scale and market position Robust capital • 10.1% CET 1 • 16.4% Total Capital • $17.12 BVPS / $14.96 TBVPS (3) • 14% cash / assets • 17% wholesale funding / assets (1) • 89% core deposits (2) | 23% uninsured & uncollateralized deposits Strong liquidity and funding position Improved forward profitability • 20%+ 2024E GAAP EPS accretion • ~1.10%+ ROAA Q424E run - rate • ~13.0% ROATCE Q424E run - rate Strong Credit Quality • 29 bps NPL ratio • 1.22 % ACL ratio • Classifieds and Delinquencies lower QoQ 12/31/23 metrics, except where noted

COMMUNITY BANKING SPECIALTY BANKING Business Banking Middle Market Banking Commercial Real Estate Multifamily Bridge & Construction Lending Asset - Based Lending & Term Loans HOA Media & Entertainment Mortgage Warehouse Lending Fund Finance Technology & Life Sciences Corporate Asset Finance Full - service commercial banking, with complementary specialty businesses and expertise Focus on relationship banking that generates low - cost commercial deposits and high - quality lending opportunities Fourth Quarter 2023 Earnings | 5 PAYMENTS SOLUTIONS Proprietary Merchant Processing via Deepstack Solutions Corporate Cards Transaction Processing CORE SERVICES Depository Services Cash Management and Corporate Treasury Management Solutions

Robust deposit gathering engine designed to build low - cost deposit base Continue to prioritize core deposit funding (1) HOA Banking Payments 26% 26% 26% 10% 12% Noninterest - bearing CDs Brokered CDs Checking Savings & MMDA $4 billion total deposits Ultra sticky, low - cost deposits proven through cycle HOA industry has 7,500+ Property Management companies Nationwide presence with the opportunity to reach 347,000 Community Associations Opportunity for further market penetration Leading Homeowner Association Banking Business • Core deposits (2) : 89% • Average cost of core deposits: 2.57% • Average cost of total deposits: 2.94% • Deposits / total funding: 91% • Uninsured and uncollateralized deposits: 23% » Proprietary payments software » Scalable and fee - based income » Unique client acquisition source Card Issuer Transaction Processor Deepstack is a differentiated payment processing platform • $30.4bn 1. As of 4Q23. 2. Core deposits defined as total deposits minus brokered time deposits. Fourth Quarter 2023 Earnings | 6

Fourth Quarter 2023 Earnings | 7 California - based commercial bank with national reach and select specialty business lines 1. Ranked by assets. California focused National presence Menlo Park Campbell Los Angeles Denver San Diego Austin Atlanta Chicago Boston New York Chevy Chase Durham Fresno Monterey Kings Tulare Kern San Luis Obispo Santa Barbara Ventura Los Angeles San Bernardino Riverside Orange San Diego THE 3rd LARGEST BANK HEADQUARTERED IN CALIFORNIA 1 Specialty Bank Office Community Banking Branch Top 5 California Counties County Rank Dep. ($bn) Orange 1 $13.1 Los Angeles 4 11.1 San Diego 5 1.9 San Bernardino 4 0.8 Riverside 5 0.8 HQ Branches Phoenix

California (#) Bank HQ Deposits Market share 1 Union Bank San Francisco, CA $84.6 5.7% 2 First Republic San Francisco, CA 56.8 3.8% 3 Bank of the West San Francisco, CA 51.6 3.5% 4 Silicon Valley Santa Clara, CA 51.1 3.5% 5 CIT New York, NY 36.0 2.4% 6 City National Los Angeles, CA 33.5 2.3% 7 East West Pasadena, CA 28.9 2.0% 8 Comerica Dallas, TX 18.0 1.2% 9 PacWest Beverly Hills, CA 12.2 0.8% 10 Zions Salt Lake City, UT 11.3 0.8% 11 Cathay Los Angeles, CA 11.2 0.8% 12 HSBC USA New York, NY 10.8 0.7% 13 Rabobank Roseville, CA 9.8 0.7% 14 Hope Los Angeles, CA 9.3 0.6% 15 CVB Ontario, CA 8.7 0.6% CA Market Opportunity □ 3rd largest bank headquartered in California by assets □ Six of the top fifteen mid - sized banks have left the market since 2019 □ California is one of the best banking markets in the United States □ State with the 2nd largest deposit base □ 4.2mm small businesses in California □ 5th largest economy in the world (measured by GDP) □ 39mm state residents, most populous state in the country □ #6 Long Beach and #9 Los Angeles ports (measured by tonnage) □ California economy expected to benefit from 2028 Olympics in Los Angeles California’s premier commercial bank with significant opportunity to increase market share Source: State of California, FRED, NCES, S&P Global Market Intelligence, U.S. DOT; Note: Deposit market share data as of June 30 , 2023 (Banc of California as of December 31, 2023). 1. Deposit market share data excludes banks with greater than $250bn total assets. 2019 California deposit market share rankings (1) Fourth Quarter 2023 Earnings | 8 2023 California deposit market share rankings (1)

Hamid Hussain President of the Bank 25+ years of banking experience, previously served as EVP, Real Estate Market Executive for Wells Fargo Olivia Lindsay Chief Risk Officer 20+ years of experience in regulatory processes and controls, previously spent 15 years at MUFG Union Bank Jared Wolff President and Chief Executive Officer 30+ years of banking and law. Previously held senior executive positions with City National Bank (RBC) and PacWest Bancorp Bob Dyck Chief Credit Officer 35+ years of credit experience, previously served at PacWest Bancorp as CCO for the Community Banking Division John Sotoodeh Chief Operating Officer 30+ years of banking experience, previously held several key executive positions at Wells Fargo Monica Sparks Chief Accounting Officer 20+ years experience in accounting, previously served as EVP, Chief Accounting Officer at PacWest Bancorp Fourth Quarter 2023 Earnings | 9 Raymond Rindone Deputy Chief Financial Officer and Head of Corporate Finance 30+ years finance & public accounting experience, previously served as Deputy CFO of City National Bank (RBC) Joe Kauder Chief Financial Officer 30+ years banking experience, previously served as EVP, CFO Wells Fargo Wholesale Banking Bryan Corsini EVP , Credit Administration 35+ years banking experience, previously served as CCO of PacWest Bancorp and Director of Pacific Western Bank Debbie Dahl - Amundson Chief Internal Audit Officer Leads the internal audit group and SOX Compliance, previously served as Assistant General Auditor for PNC Bill Black Head of Strategy and Corporate Development 25+ years of financial services experience, previously ran a financial services hedge fund Steve Schwimmer Head of Technology, Innovation & Data 25+ years of experience in banking technology, previously served as the EVP, Chief Innovation Officer at PacWest Bancorp Stan Ivie Head of Government and Regulatory Affairs Previously served as the Chief Risk Officer of PacWest Bancorp & the regional director for the FDIC’s San Francisco and Dallas Regions Experienced management team with track record of success at leading institutions Ido Dotan General Counsel and Chief Administrative Officer Experienced in corporate securities, M&A, and structured finance. Previously served as EVP of Carrington Mortgage Holdings

Update on Balance Sheet

Balance Sheet Repositioning Actions Taken • Completed $400 million capital raise • Sold $6 billion in longer duration lower yielding assets • Completed $9 billion paydown of high - cost funding • Improved liquidity of balance sheet • Improved ACL ratio Highlights Strong, highly - liquid balance sheet post merger Fourth Quarter 2023 Earnings | 11 3Q23 4Q23 21.0 % 25.6% 3Q23 4Q23 80.9% 91.3% 3Q23 4Q23 28.1 % 16.6% ($ in millions) 4Q22 3Q23 4Q23 Total cash and cash equivalents $2,240 $6,070 $5,378 Total investment securities 7,147 6,787 4,761 Loans held for sale 65 189 123 Total loans and leases HFI, net of deferred fees 28,609 21,921 25,490 Allowance for loan and lease losses (201) (222) (282) Goodwill and intangibles 1,408 24 364 Total assets $41,229 $36,878 $38,534 Noninterest-bearing deposits $11,212 $5,579 $7,774 Interest-bearing deposits 22,724 21,020 22,628 Total deposits 33,936 26,599 30,402 Borrowings 1,764 6,295 2,911 Subordinated debt 867 871 937 Total liabilities 37,278 34,479 35,143 Total stockholders’ equity 3,951 2,399 3,391 Total liabilities and stockholders’ equity $41,229 $36,878 $38,534 Key Balance Sheet Metrics Cash / assets 5.4% 16.5% 14.0% Securities / assets 17.3% 18.4% 12.4% Loans / deposits 84.3% 82.4% 83.8% Noninterest-bearing deposits / deposits 33.0% 21.0% 25.6% Deposits / total funding 95.1% 80.9% 91.3% Wholesale funding / assets 9.9% 28.1% 16.6% ACL ratio 1.02% 1.15% 1.22% Note: Periods prior to 4Q23 represent PACW standalone. Noninterest - bearing deposits / deposits Deposits / total funding Wholesale funding / assets

Building a strong commercial deposit franchise • 4Q23 activity including impact of merger: – Noninterest - bearing deposits increased from 21% to 26% – Brokered CDs declined from 15% of deposits to 12% • Deposit spot rate of 2.69% at 12/31/23 compared to 4Q23 average cost of deposits of 2.94% • Decline in average cost of funds and widening spread against Fed funds rate Highlights Opportunity to Build Superior Deposit Franchise Average Cost of Deposits Noninterest - bearing Interest - bearing Checking Money Market & Savings Brokered CDs CDs Average Fed Funds Rate 3.65% 4.51% 4.99% 5.26% 5.33% 1.37% 1.98% 2.62% 2.98% 2.94% 33.0% 24.9% 21.7% 21.0% 25.6% 23.4% 19.0% 25.5% 26.5% 25.7% 29.6% 31.5% 23.6% 25.8% 26.9% 6.8% 15.7% 19.5% 15.3% 11.5% 7.2% 8.9% 9.8% 11.4% 10.3% Noninterest - bearing Checking $11,212 $7,031 $6,055 $5,579 $7,774 Checking 7,939 5,361 7,113 7,039 7,809 Money Market 9,470 8,196 5,678 5,424 6,188 Savings 578 672 897 1,442 1,998 Non - Brokered CDs 2,434 2,503 2,725 3,038 3,139 Brokered CDs 2,303 4,426 5,428 4,077 3,494 Total $33,936 $28,188 $27,897 $26,599 $30,402 4Q22 1Q23 2 Q23 3 Q23 4 Q23 Fourth Quarter 2023 Earnings | 12 Management has track record of successful deposit strategy execution Note: Periods prior to 4Q23 represent PACW standalone. ($ in millions)

Diversified Loan Portfolio • Core portfolio comprises 85% of total loans with very low NPL and DQ ratios • Balance sheet restructuring included sale of lower yielding and longer duration BANC residential and multifamily loans • Significant repricing opportunity in Multifamily portfolio as loans mature Highlights High - quality relationship - based core portfolio positioned for strong performance Fourth Quarter 2023 Earnings | 13 15% 7% 11% 12% 17% 24% Discontinued Areas 2% Warehouse 3% SBA 3% Fund Finance 3% Equipment Lending 3% Venture Lending C&I Residential / Consumer Construction CRE MF Existing portfolios have very low historical loss rates Loan Segment HFI ($ in millions) 4Q23 Percent of Total Wtd. Avg. Rate NPL % MF $6,025 23.6% 4.0% 0.02% CRE 4,395 17.2% 5.5% 0.30% Construction 3,159 12.4% 6.4% 0.00% Residential / Consumer 2,840 11.1% 3.6% 0.30% C&I 1,744 6.8% 7.4% 0.36% Venture Lending 784 3.1% 8.8% 0.04% Equipment Lending 736 2.9% 5.5% 0.05% SBA 711 2.8% 6.1% 2.98% Fund Finance 663 2.6% 8.5% 0.00% Warehouse 555 2.2% 8.7% 0.00% Core Portfolio $21,612 84.8% 5.5% 0.24% Civic $2,306 9.0% 6.2% 0.99% Premium Finance 447 1.8% 9.3% 0.00% Lender Finance 732 2.9% 3.4% 0.00% Student 367 1.4% 4.3% 0.18% National Lending 25 0.1% 9.4% 0.00% Discontinued Areas $3,878 15.2% 5.8% 0.60% Total Loans $25,490 100% 5.5% Operating leases 344 Total Loans and leases $25,834 0.29% Note: Wtd . Avg. Rate excludes loan fees and accretion.

California - Centric CRE Portfolio • California comprises over 70% of CRE • Low weighted average LTV of 54% • Other includes mobile homes, self storage, gas stations, special use, school, place of worship and restaurants Highlights California - centric CRE portfolio has low weighted - average LTV and solid credit quality CRE comprises 17 % of total loans and is well diversified across multiple industries Fourth Quarter 2023 Earnings | 14 25.0% 20.8% 17.2% 11.8% 5.6% 14.6% 5.0% Office Industrial Retail Hotel Health Facility Mixed Use Other Note: CRE excludes government guaranteed CRE collateralized SBA loans. Property Type ($ in millions) Count 4Q23 % of Total CRE % of Total Loans Avg Loan Size WA LTV NPL % NPL $ Office 238 $1,097 25.0% 4.3% $4.6 54.7% 0.00% $0.1 Industrial / Warehouse 387 914 20.8% 3.6% 2.4 52.1% 0.10% 0.9 Retail 206 757 17.2% 3.0% 3.7 52.5% 0.05% 0.4 Hotel 40 520 11.8% 2.0% 13.0 56.3% 0.00% - Health Facility 46 244 5.6% 1.0% 5.3 54.8% 0.00% - Mixed Use 53 220 5.0% 0.9% 4.2 51.7% 0.00% - Other 224 642 14.6% 2.5% 2.9 58.8% 1.86% 11.9 Totals: 1,194 $4,395 100.0% 17.2% $3.7 54.4% 0.30% $13.3 • No delinquent office loans • Only 1 office NPL for $53K • 84% of office collateral located in California, 6% in Colorado and 10% in other states

Asset quality ratios improved post merger • NPL ratio declined 28 bps to 0.29% • Classified loan ratio declined 6 bps • ACL ratio increased 7 bps to 1.22% Highlights Strong credit quality with healthy reserve levels Fourth Quarter 2023 Earnings | 15 $291.8 1.02% 4Q22 $285.6 1.11% 1Q23 $256.8 1.15% 2Q23 $251.9 1.15% 3Q23 $311.3 1.22% 4Q23 ACL ACL / Total Loans $103.8 0.36% 4Q22 $87.1 0.34% 1Q23 $104.9 0.47% 2Q23 $125.4 0.57% 3Q23 $74.3 0.29% 4Q23 NPLs NPLs/Total Loans - HFI $118.3 0.41% 4Q22 $132.4 0.52% 1Q23 $211.9 0.95% 2Q23 $211.1 0.96% 3Q23 $228.4 0.90% 4Q23 Classified Classified Loans / Total Loans $176.8 0.62% 4Q22 $194.4 0.76% 1Q23 $119.8 0.54% 2Q23 $127.3 0.58% 3Q23 $144.2 0.57% 4Q23 Delinquencies Delinquencies /Total Loans Delinquencies ($M) Classified Loans ($M) ACL / Total Loans ($M) Nonperforming Loans (NPLs) ($M) Note: Periods prior to 4Q23 represent PACW standalone.

Purchase accounting and 4Q provision build healthy ACL coverage ratio Allowance for Credit Losses (ACL) Walk • ACL increased by $59.4 million due to – ( i ) legal day one purchased credit deteriorated (PCD) gross up $25.6 million – (ii) the ALL provision for the non - PCD acquired loans totaling $22.2 million – (iii) ALL provision legacy PacWest portfolio totaling $24.8 million • The increase to the ACL was partially offset by: – (v) net charge offs of $13.2 million • ACL includes the Allowance for Loan and Losses (ALL) and Reserve for Unfunded Loan Commitments (RUC) – There was no provision related to the RUC during the quarter Fourth Quarter 2023 Earnings | 16 1.15% 1.22% Total ACL coverage ratio strengthened from 1.15% to 1.22% $251.9 $311.3 $47.8 $24.8 ACL (9/30/2023) Purchase Accounting Adjustments Provision for ALLL Net Charge - offs ACL (12/31/2023) $(13.2) Note: Periods prior to 4Q23 represent PACW standalone. ($ in millions)

Effective Duration 4Q23 (yrs) 4Q23 AFS - Gov't & Agency $1,744 6.9 AFS - CLO's 108 0.1 AFS - Corporate Bonds 267 1.9 AFS - Municipal Bonds 28 4.5 AFS - Non-Agency Securitizations 199 6.5 AFS $2,347 5.9 HTM - Gov't & Agency 621 6.7 HTM - Corporate Bonds 70 4.4 HTM - Municipal Bonds 1,247 8.1 HTM - Non-Agency Securitizations 350 6.3 HTM $2,289 7.4 Total Securities $4,636 6.6 Security Type ($ in millions) High - quality securities portfolio Securities Portfolio Detail • Average yield increased quarter over quarter • Portfolio restructured to provide cash to reduce higher cost wholesale funding • Significant cash balance creates opportunity to build optimal securities portfolio over time Portfolio Profile Composition Credit Rating Portfolio Average Balances & Yields 12% 7% 51% 28% 2% Private Label RMBS CLO Corporates Gov’t & AGC Munis 17% 75% 2% 0% 4% 1% AAA AA A BB BBB Not Rated $7.8 2.57% 4Q22 $7.2 2.49% 1Q23 $7.2 2.47% 2Q23 $6.9 2.60% 3Q23 $6.0 2.72% 4Q23 Average Balance ($ in billions) Yield Fourth Quarter 2023 Earnings | 17 Note: Periods prior to 4Q23 represent PACW standalone.

High Level of Available Liquidity • Total available primary liquidity of $5.2 billion excluding unpledged AFS of $0.2 billion • Total available primary and secondary liquidity of $17.2 billion • Uninsured and uncollateralized deposits of $6.9 billion • Total available primary and secondary liquidity was 2.5x uninsured and uncollateralized deposits Highlights Maintain high levels of primary and secondary liquidity as prudent risk management Fourth Quarter 2023 Earnings | 18 ($ in Millions) December 31, 2023 Current Availability Utilization Capacity Primary Liquidity Cash 5,192$ Total Primary Liquidity 5,192 Secondary Liquidity FHLB 5,058$ 244$ 5,302$ FRB (Discount Window & BIC) 6,916 - 6,916 FRB (Bank Term Funding Program) - 2,618 2,618 Total Secondary Liquidity 11,975 2,862 14,837 Total Primary + Secondary Liquidity 17,167$

Moderately Liability Sensitive Balance Sheet • - 100 bps rate scenario: Approximately +3% impact to NII • Rate sensitive earning assets: 39% – $9.8 billion of loans are variable or reprice / mature in less than one year – Over 99% of adjustable - rate loans with floors are eligible to reprice • Rate sensitive liabilities: 72% (1) – $19.8 billion of interest - bearing deposits, excluding CDs – $5.5 billion of CDs that mature or reprice within 12 months – $2.6 billion of borrowings (BTFP) that mature or reprice within 12 months 4Q23 Highlights Balance Sheet Positioning and Interest Rate Sensitivity 62% 19% 19% 67% 17% 16% Loans HFI + Leases Investment Securities Cash & Cash Equivalents 3Q23 4Q23 Average - Interest Earning Assets Mix Loans Years to Maturity/Repricing 32% 6% 6% 25% 31% Variable - Rate 1 Year 2 Years 3 - 5 Years >5 Years Loan Composition 4Q23 4Q23 32% 43% 25% Variable - rate Fixed Hybrid Fourth Quarter 2023 Earnings | 19 Note: Periods prior to 4Q23 represent PACW standalone. 1. Excludes TruPS .

Strong Capital Base • CET 1 ratio of 10.1% inclusive of: – Loss on previously executed sales of loans and securities – Impact of fair value marks and merger expenses – Special FDIC assessment • All regulatory capital ratios in excess of minimum “well - capitalized” levels Focus on building capital levels to strengthen franchise and optimize flexibility 1. 4Q23 capital ratios are preliminary. 2. Denotes a non - GAAP financial measure; see “Non - GAAP Reconciliation” slides at end of presentation. Fourth Quarter 2023 Earnings | 20 4Q23 Regulatory Well- Capitalized Ratios Excess of Well- Capitalized Total Risk-Based Ratio 1 16.40% 10.00% 6.40% Tier 1 Risk-Based Capital 1 12.42% 8.00% 4.42% Common Equity Tier 1 (CET 1) 1 10.12% 6.50% 3.62% Leverage Ratio 1 9.00% 5.00% 4.00% Tangible Common Equity / Tangible Assets 2 6.62% NA NA

Integration and Restructuring Update

Integration roadmap Fourth Quarter 2023 Earnings | 22 Accomplished since announcement of deal Items to be completed in 2024 • Closed merger with PacWest • Raised $400mm common equity • Retained key employees and clients • Sold $6 billion assets (3.6% yield) • Paid down $9 billion wholesale funding (5.2% cost) • Finalized plan for integration • Complete balance sheet restructuring • Core systems conversions • Execution on consolidation of facilities • Realize full cost savings x x x x x x 1Q 2Q 2Q/3Q/4Q 4Q Target Strong execution and achievement of deal closing timeline creates opportunity to complete integration and realize full cost savings in 2024

Asset Sales • Asset sales began in 4Q23 • Sold all BANC securities and BANC SFR loans • Retained $0.8 billion of BANC multifamily loans. Generates an attractive book yield of over 10% inclusive of fair value marks • Retention of $2.6 billion of BTFP increased 4Q23 cash to $5.4 billion or 13.9% assets • Assets sold have low weighted average yield of 3.6%, long duration Highlights Fourth Quarter 2023 Earnings | 23 Balance sheet restructuring largely accomplished • Sold • $6bn Liquid assets • 3.6% Yield • Raised • $400mm Capital raise completed increasing excess cash • Utilized • $1bn Excess cash • Paid Down • $9bn Wholesale borrowings • 5.2 % C ost 3Q23 Combined Assets $2.3 PACW Securities $1.8 BANC SFR $1.2 BANC Securities $1.0 Cash and Cash Equivalents $0.6 Other Loans and Assets $0.7 BANC Multifamily 4Q23 BANC Assets $46.1 $38.5 ($ in billions) Note: Financial data represents the books value as of sale date.

Liabilities Paydowns • Wholesale paydowns started shortly after deal announcement • Retained $2.6 billion BTFP to benefit from rate of 4.35% compared to incremental brokered deposit cost of 5.4% • Repayment of $9 billion wholesale funding significantly improves wholesale funding ratio and NIM • Wholesale borrowings cost 1.6% greater than assets sold (excludes cash) Highlights Fourth Quarter 2023 Earnings | 24 Restructuring substantially reduced wholesale funding • Sold • $6bn Liquid assets • 3.6% Yield • Raised • $400mm Capital raise completed increasing excess cash • Utilized • $1bn Excess cash • Paid Down • $9bn Wholesale borrowings • 5.2 % C ost 2Q23 Combined Wholesale Funding $4.2 Brokered Deposits $2.3 BTFP $1.3 Repurchase Agreement $0.8 FHLB $0.3 Overnight 4Q23 BANC $16.2 $7.3 ($ in billions) 1. Brokered deposits includes $0.3 billion of paydowns at PACW prior to deal announcement. (1)

Balance sheet restructuring will increase NIM Wholesale funding • $9bn Wholesale borrowings • 5.2% Weighted average cost • Brokered deposits • BTFP • FHLB • Overnight borrowings • Repurchase agreement • 5.1% • 4.4% • 3.0% • 5.3% • 8.5% Yield / Cost Transaction $ • $3.9bn • 2.3bn • 0.8bn • 0.3bn • 1.3bn Assets • $6bn Liquid assets • 3.6% Weighted average yield • BANC SFR • BANC Multifamily • BANC Total securities • PACW AFS securities • 4.4% • 4.4% • 5.4% • 1.7% • $1.8bn • 0.7bn • 1.2bn • 2.3bn Note: Financial data represents the book value as of sale date or repayment date. Illustrates asset sales and wholesale fundi ng paydowns that occurred between announcement of deal on 07/25/2023 and 12/31/2023. Fourth Quarter 2023 Earnings | 25 Spread between assets sold and wholesale funding repaid of approximately 160 bps

ATTRACTIVE INVESTMENT OPPORTUNITY Fourth Quarter 2023 Earnings | 26 On track to leverage strength of restructured balance sheet and merger synergies to achieve steady growth in earnings and capital 5. EXPERIENCED MANAGEMENT TEAM WITH TRACK RECORD OF SUCCESSFUL EXECUTION 4. STRONG CALIFORNIA MARKET POSITION WITH SIZEABLE OPPORTUNITY 3. SOLID CAPITAL AND LIQUIDITY PROFILE 2. MERGER SYNERGIES ENHANCE EARNINGS POWER WITH SIGNIFICANT CATALYSTS FOR EARNINGS GROWTH 1. ATTRACTIVE VALUATION ON TBV WITH RESTRUCTURED BALANCE SHEET, CLEAN CREDIT PROFILE AND HEALTHY RESERVES

Appendix

Fourth Quarter Income Statement Fourth Quarter 2023 Earnings | 28 • Fourth quarter 2023 includes two months of legacy PACW results and one month of combined results • All prior periods are solely PACW historical results • Fourth quarter 2023 includes the impact of merger expenses and balance sheet restructuring actions ($ in millions) 4Q23 3Q23 4Q22 Total interest income $467 $446 $473 Total interest expense 316 315 150 Net interest income 151 131 323 Provision for credit losses 47 0 10 (Loss) gain on sale of loans (4) (2) 0 Loss on sale of securities (442) 0 (49) Other noninterest income 46 46 30 Total noninterest (loss) income (400) 44 (19) Total revenue (249) 175 304 Goodwill impairment 0 0 29 Acquisition, integration and reorganization costs 112 10 6 Other noninterest expense 252 191 192 Total noninterest expense 364 201 227 (Loss) earnings before income taxes (660) (27) 67 Income tax (benefit) expense (177) (3) 18 Net (loss) earnings ($483) ($23) $50 Preferred stock dividends 10 10 10 Net (loss) earnings available to common stockholders ($493) ($33) $40 Note: Periods prior to 4Q23 represent PACW standalone. 4Q23 includes Oct - Dec for PACW and Dec for BANC.

Net Purchase Accounting Impact Five Year Estimate Fourth Quarter 2023 Earnings | 29 Tax Rate assumed 29.6%. For fixed rate loans 5% static CPR assumed. Accretion will depend on actual future prepayments. ($ in millions except per share data) Pro forma CDI amortization and accretion schedule Year - post close FY2024 FY2025 FY2026 FY2027 FY2028 Pre-tax Expense Core deposit intangibles ($26) ($24) ($21) ($18) ($16) Net Interest Income Loan FV mark 68 61 54 47 42 Other liability rate marks (5) (3) (2) (2) (2) Total net interest income 63 58 52 46 40 Total $37 $34 $31 $27 $24 After-tax $26 $24 $22 $19 $17 EPS Impact 0.15$ 0.14$ 0.13$ 0.11$ 0.10$ Change - (0.01)$ (0.01)$ (0.02)$ (0.01)$

Non - GAAP Financial Information Tangible assets, tangible equity, tangible common equity, tangible common equity to tangible assets, tangible book value per common share, return on average tangible common equity, adjusted noninterest income, adjusted noninterest expense, adjusted noninterest income to adjusted total revenue, adjusted noninterest expense to average total assets, constitute supplemental financial information determined by methods other than in accordance with GAAP. These non - GAAP measures are used by management in its analysis of the Company's performance. Tangible assets and tangible equity are calculated by subtracting goodwill and other intangible assets from total assets and total stockholders’ equity. Tangible common equity is calculated by subtracting preferred stock, as applicable, from tangible equity. Return on average tangible common equity is calculated by dividing net earnings available to common stockholders, after adjustment for amortization of intangible assets and goodwill impairment, by average tangible common equity. Banking regulators also exclude goodwill and other intangible assets from stockholders' equity when assessing the capital adequacy of a financial institution. Management believes the presentation of these financial measures adjusting the impact of these items provides useful supplemental information that is essential to a proper understanding of the financial results and operating performance of the Company. This disclosure should not be viewed as a substitute for results determined in accordance with GAAP, nor is it necessarily comparable to non - GAAP performance measures that may be presented by other companies. Reconciliations of these measures to measures determined in accordance with GAAP are contained on slides 31 - 33 of this presentation. Fourth Quarter 2023 Earnings | 30

Non - GAAP Reconciliation 1. Total common equity divided by common shares outstanding. 2. Tangible common equity divided by common shares outstanding. 3. Common shares outstanding include non - voting common equivalents that are participating securities. 4. Common shares outstanding in prior periods have been restated by multiplying the historical amounts by theMerger exchange ratio of 0.6569. Fourth Quarter 2023 Earnings | 31 ($ in thousands, except per share data) 4Q23 3Q23 2Q23 1Q23 4Q22 Tangible Common Equity to Tangible Assets Ratio and Tangible Book Value Per Common Share Total stockholders' equity $3,390,765 $2,399,277 $2,533,195 $2,771,477 $3,950,531 Less: preferred stock 498,516 498,516 498,516 498,516 498,516 Total common equity 2,892,249 1,900,761 2,034,679 2,272,961 3,452,015 Less: intangible assets 364,104 24,192 26,581 28,970 1,408,117 Tangible common equity (1) $2,528,145 $1,876,569 $2,008,098 $2,243,991 $2,043,898 Total assets $38,534,064 $36,877,833 $38,337,250 $44,302,981 $41,228,936 Less: intangible assets 364,104 24,192 26,581 28,970 1,408,117 Tangible assets (1) $38,169,960 $36,853,641 $38,310,669 $44,274,011 $39,820,819 Total stockholders' equity to total assets 8.80% 6.51% 6.61% 6.26% 9.58% Tangible common equity to tangible assets (1) 6.62% 5.09% 5.24% 5.07% 5.13% Book value per common share $ 17.12 $ 24.12 $ 25.78 $ 28.78 $ 43.71 Tangible Book Value Per Common Share (2,3) $ 14.96 $ 23.81 $ 25.44 $ 28.41 $ 25.88 Common shares outstanding (3,4) 168,952 78,807 78,939 78,988 78,974 Note: Periods prior to 4Q23 represent PACW standalone.
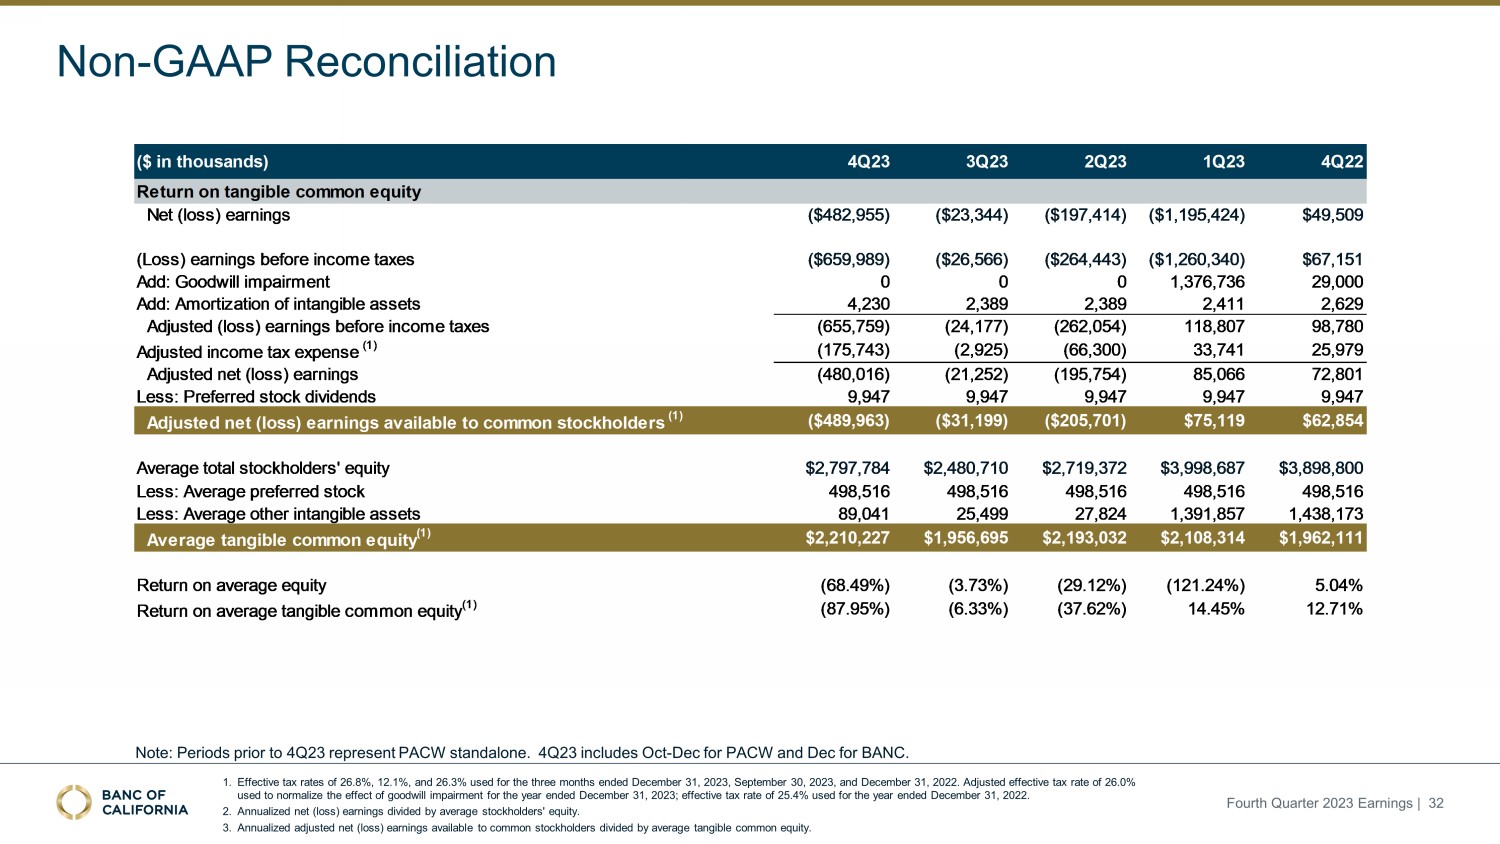
Non - GAAP Reconciliation 1. Effective tax rates of 26.8%, 12.1%, and 26.3% used for the three months ended December 31, 2023, September 30, 2023, and Dec emb er 31, 2022. Adjusted effective tax rate of 26.0% used to normalize the effect of goodwill impairment for the year ended December 31, 2023; effective tax rate of 25.4% used fo r t he year ended December 31, 2022. 2. Annualized net (loss) earnings divided by average stockholders' equity. 3. Annualized adjusted net (loss) earnings available to common stockholders divided by average tangible common equity. Fourth Quarter 2023 Earnings | 32 ($ in thousands) 4Q23 3Q23 2Q23 1Q23 4Q22 Return on tangible common equity Net (loss) earnings ($482,955) ($23,344) ($197,414) ($1,195,424) $49,509 (Loss) earnings before income taxes ($659,989) ($26,566) ($264,443) ($1,260,340) $67,151 Add: Goodwill impairment 0 0 0 1,376,736 29,000 Add: Amortization of intangible assets 4,230 2,389 2,389 2,411 2,629 Adjusted (loss) earnings before income taxes (655,759) (24,177) (262,054) 118,807 98,780 Adjusted income tax expense (1) (175,743) (2,925) (66,300) 33,741 25,979 Adjusted net (loss) earnings (480,016) (21,252) (195,754) 85,066 72,801 Less: Preferred stock dividends 9,947 9,947 9,947 9,947 9,947 Adjusted net (loss) earnings available to common stockholders (1) ($489,963) ($31,199) ($205,701) $75,119 $62,854 Average total stockholders' equity $2,797,784 $2,480,710 $2,719,372 $3,998,687 $3,898,800 Less: Average preferred stock 498,516 498,516 498,516 498,516 498,516 Less: Average other intangible assets 89,041 25,499 27,824 1,391,857 1,438,173 Average tangible common equity (1) $2,210,227 $1,956,695 $2,193,032 $2,108,314 $1,962,111 Return on average equity (68.49%) (3.73%) (29.12%) (121.24%) 5.04% Return on average tangible common equity (1) (87.95%) (6.33%) (37.62%) 14.45% 12.71% Note: Periods prior to 4Q23 represent PACW standalone. 4Q23 includes Oct - Dec for PACW and Dec for BANC.

Non - GAAP Reconciliation 1. Non - GAAP measure. 2. Ratio presented on an annualized basis. Fourth Quarter 2023 Earnings | 33 ($ in thousands) 4Q23 3Q23 2Q23 1Q23 4Q22 Adjusted Noninterest Income to Adjusted Total Revenue and Noninterest Expense to Average Assets Net interest income $151,051 $130,729 $186,076 $279,272 $322,939 Noninterest (loss) income (400,402) 43,808 (128,082) 36,391 (18,956) Total revenue (400,251) 43,939 (127,896) 36,670 (18,633) Noninterest (loss) income (400,402) 43,808 (128,082) 36,391 (18,956) Add: Loss on sale of securities 442,413 - - - 49,302 Less: Legal recovery (7,587) (14,500) - - - Add: Loan fair value loss adjustments - - 170,971 - - Adjusted noninterest income 34,424 29,308 42,889 36,391 30,346 Net interest income 151,051 130,729 186,076 279,272 322,939 Adjusted total revenue $185,475 $160,037 $228,965 $315,663 $353,285 Noninterest expense $363,638 $201,103 $320,437 $1,573,003 $226,832 Less: Goodwill impairment - - - (1,376,736) (29,000) Less: Acquisition, integration, and reorganization costs (111,800) (9,925) (12,394) (8,514) (5,703) Less: Unfunded commitments fair value loss adjustments - - (106,767) - - Adjusted noninterest expense $251,838 $191,178 $201,276 $187,753 $192,129 Average assets $37,640,387 $37,807,758 $43,040,329 $42,768,714 $41,151,963 Noninterest income to total revenue (1) 160.58% 25.10% (220.85%) 11.53% (6.24%) Adjusted noninterest income to adjusted total revenue (1) 18.56% 18.31% 18.73% 11.53% 8.59% Noninterest expense / average assets (2) 3.83% 2.11% 2.99% 14.92% 2.19% Note: Periods prior to 4Q23 represent PACW standalone. 4Q23 includes Oct - Dec for PACW and Dec for BANC.
v3.23.4
Cover
|
Jan. 25, 2024 |
| Document Information [Line Items] |
|
| Document Type |
8-K
|
| Amendment Flag |
false
|
| Document Period End Date |
Jan. 25, 2024
|
| Entity File Number |
001-35522
|
| Entity Registrant Name |
BANC OF CALIFORNIA, INC.
|
| Entity Central Index Key |
0001169770
|
| Entity Tax Identification Number |
04-3639825
|
| Entity Incorporation, State or Country Code |
MD
|
| Entity Address, Address Line One |
11611
San Vicente Boulevard
|
| Entity Address, Address Line Two |
Suite 500
|
| Entity Address, City or Town |
Los Angeles
|
| Entity Address, State or Province |
CA
|
| Entity Address, Postal Zip Code |
90049
|
| City Area Code |
855
|
| Local Phone Number |
361-2262
|
| Written Communications |
false
|
| Soliciting Material |
false
|
| Pre-commencement Tender Offer |
false
|
| Pre-commencement Issuer Tender Offer |
false
|
| Entity Emerging Growth Company |
false
|
| Common Stock [Member] |
|
| Document Information [Line Items] |
|
| Title of 12(b) Security |
Common Stock, par value
$0.01 per share
|
| Trading Symbol |
BANC
|
| Security Exchange Name |
NYSE
|
| Depositary Shares, each representing a 1/40th interest in a share of 7.75% fixed rate reset non-cumulative perpetual preferred stock, Series F [Member] |
|
| Document Information [Line Items] |
|
| Title of 12(b) Security |
Depositary Shares, each representing a 1/40th interest
in a share of 7.75% fixed rate reset non-cumulative perpetual preferred stock, Series F
|
| Trading Symbol |
BANC/PF
|
| Security Exchange Name |
NYSE
|
| X |
- DefinitionBoolean flag that is true when the XBRL content amends previously-filed or accepted submission.
| Name: |
dei_AmendmentFlag |
| Namespace Prefix: |
dei_ |
| Data Type: |
xbrli:booleanItemType |
| Balance Type: |
na |
| Period Type: |
duration |
|
| X |
- DefinitionFor the EDGAR submission types of Form 8-K: the date of the report, the date of the earliest event reported; for the EDGAR submission types of Form N-1A: the filing date; for all other submission types: the end of the reporting or transition period. The format of the date is YYYY-MM-DD.
| Name: |
dei_DocumentPeriodEndDate |
| Namespace Prefix: |
dei_ |
| Data Type: |
xbrli:dateItemType |
| Balance Type: |
na |
| Period Type: |
duration |
|
| X |
- DefinitionThe type of document being provided (such as 10-K, 10-Q, 485BPOS, etc). The document type is limited to the same value as the supporting SEC submission type, or the word 'Other'.
| Name: |
dei_DocumentType |
| Namespace Prefix: |
dei_ |
| Data Type: |
dei:submissionTypeItemType |
| Balance Type: |
na |
| Period Type: |
duration |
|
| X |
- DefinitionAddress Line 1 such as Attn, Building Name, Street Name
| Name: |
dei_EntityAddressAddressLine1 |
| Namespace Prefix: |
dei_ |
| Data Type: |
xbrli:normalizedStringItemType |
| Balance Type: |
na |
| Period Type: |
duration |
|
| X |
- DefinitionAddress Line 2 such as Street or Suite number
| Name: |
dei_EntityAddressAddressLine2 |
| Namespace Prefix: |
dei_ |
| Data Type: |
xbrli:normalizedStringItemType |
| Balance Type: |
na |
| Period Type: |
duration |
|
| X |
- Definition
+ References
+ Details
| Name: |
dei_EntityAddressCityOrTown |
| Namespace Prefix: |
dei_ |
| Data Type: |
xbrli:normalizedStringItemType |
| Balance Type: |
na |
| Period Type: |
duration |
|
| X |
- DefinitionCode for the postal or zip code
| Name: |
dei_EntityAddressPostalZipCode |
| Namespace Prefix: |
dei_ |
| Data Type: |
xbrli:normalizedStringItemType |
| Balance Type: |
na |
| Period Type: |
duration |
|
| X |
- DefinitionName of the state or province.
| Name: |
dei_EntityAddressStateOrProvince |
| Namespace Prefix: |
dei_ |
| Data Type: |
dei:stateOrProvinceItemType |
| Balance Type: |
na |
| Period Type: |
duration |
|
| X |
- DefinitionA unique 10-digit SEC-issued value to identify entities that have filed disclosures with the SEC. It is commonly abbreviated as CIK. Reference 1: http://www.xbrl.org/2003/role/presentationRef
-Publisher SEC
-Name Exchange Act
-Number 240
-Section 12
-Subsection b-2
| Name: |
dei_EntityCentralIndexKey |
| Namespace Prefix: |
dei_ |
| Data Type: |
dei:centralIndexKeyItemType |
| Balance Type: |
na |
| Period Type: |
duration |
|
| X |
- DefinitionIndicate if registrant meets the emerging growth company criteria. Reference 1: http://www.xbrl.org/2003/role/presentationRef
-Publisher SEC
-Name Exchange Act
-Number 240
-Section 12
-Subsection b-2
| Name: |
dei_EntityEmergingGrowthCompany |
| Namespace Prefix: |
dei_ |
| Data Type: |
xbrli:booleanItemType |
| Balance Type: |
na |
| Period Type: |
duration |
|
| X |
- DefinitionCommission file number. The field allows up to 17 characters. The prefix may contain 1-3 digits, the sequence number may contain 1-8 digits, the optional suffix may contain 1-4 characters, and the fields are separated with a hyphen.
| Name: |
dei_EntityFileNumber |
| Namespace Prefix: |
dei_ |
| Data Type: |
dei:fileNumberItemType |
| Balance Type: |
na |
| Period Type: |
duration |
|
| X |
- DefinitionTwo-character EDGAR code representing the state or country of incorporation.
| Name: |
dei_EntityIncorporationStateCountryCode |
| Namespace Prefix: |
dei_ |
| Data Type: |
dei:edgarStateCountryItemType |
| Balance Type: |
na |
| Period Type: |
duration |
|
| X |
- DefinitionThe exact name of the entity filing the report as specified in its charter, which is required by forms filed with the SEC. Reference 1: http://www.xbrl.org/2003/role/presentationRef
-Publisher SEC
-Name Exchange Act
-Number 240
-Section 12
-Subsection b-2
| Name: |
dei_EntityRegistrantName |
| Namespace Prefix: |
dei_ |
| Data Type: |
xbrli:normalizedStringItemType |
| Balance Type: |
na |
| Period Type: |
duration |
|
| X |
- DefinitionThe Tax Identification Number (TIN), also known as an Employer Identification Number (EIN), is a unique 9-digit value assigned by the IRS. Reference 1: http://www.xbrl.org/2003/role/presentationRef
-Publisher SEC
-Name Exchange Act
-Number 240
-Section 12
-Subsection b-2
| Name: |
dei_EntityTaxIdentificationNumber |
| Namespace Prefix: |
dei_ |
| Data Type: |
dei:employerIdItemType |
| Balance Type: |
na |
| Period Type: |
duration |
|
| X |
- DefinitionLocal phone number for entity.
| Name: |
dei_LocalPhoneNumber |
| Namespace Prefix: |
dei_ |
| Data Type: |
xbrli:normalizedStringItemType |
| Balance Type: |
na |
| Period Type: |
duration |
|
| X |
- DefinitionBoolean flag that is true when the Form 8-K filing is intended to satisfy the filing obligation of the registrant as pre-commencement communications pursuant to Rule 13e-4(c) under the Exchange Act. Reference 1: http://www.xbrl.org/2003/role/presentationRef
-Publisher SEC
-Name Exchange Act
-Number 240
-Section 13e
-Subsection 4c
| Name: |
dei_PreCommencementIssuerTenderOffer |
| Namespace Prefix: |
dei_ |
| Data Type: |
xbrli:booleanItemType |
| Balance Type: |
na |
| Period Type: |
duration |
|
| X |
- DefinitionBoolean flag that is true when the Form 8-K filing is intended to satisfy the filing obligation of the registrant as pre-commencement communications pursuant to Rule 14d-2(b) under the Exchange Act. Reference 1: http://www.xbrl.org/2003/role/presentationRef
-Publisher SEC
-Name Exchange Act
-Number 240
-Section 14d
-Subsection 2b
| Name: |
dei_PreCommencementTenderOffer |
| Namespace Prefix: |
dei_ |
| Data Type: |
xbrli:booleanItemType |
| Balance Type: |
na |
| Period Type: |
duration |
|
| X |
- DefinitionTitle of a 12(b) registered security. Reference 1: http://www.xbrl.org/2003/role/presentationRef
-Publisher SEC
-Name Exchange Act
-Number 240
-Section 12
-Subsection b
| Name: |
dei_Security12bTitle |
| Namespace Prefix: |
dei_ |
| Data Type: |
dei:securityTitleItemType |
| Balance Type: |
na |
| Period Type: |
duration |
|
| X |
- DefinitionName of the Exchange on which a security is registered. Reference 1: http://www.xbrl.org/2003/role/presentationRef
-Publisher SEC
-Name Exchange Act
-Number 240
-Section 12
-Subsection d1-1
| Name: |
dei_SecurityExchangeName |
| Namespace Prefix: |
dei_ |
| Data Type: |
dei:edgarExchangeCodeItemType |
| Balance Type: |
na |
| Period Type: |
duration |
|
| X |
- DefinitionBoolean flag that is true when the Form 8-K filing is intended to satisfy the filing obligation of the registrant as soliciting material pursuant to Rule 14a-12 under the Exchange Act. Reference 1: http://www.xbrl.org/2003/role/presentationRef
-Publisher SEC
-Name Exchange Act
-Section 14a
-Number 240
-Subsection 12
| Name: |
dei_SolicitingMaterial |
| Namespace Prefix: |
dei_ |
| Data Type: |
xbrli:booleanItemType |
| Balance Type: |
na |
| Period Type: |
duration |
|
| X |
- DefinitionTrading symbol of an instrument as listed on an exchange.
| Name: |
dei_TradingSymbol |
| Namespace Prefix: |
dei_ |
| Data Type: |
dei:tradingSymbolItemType |
| Balance Type: |
na |
| Period Type: |
duration |
|
| X |
- DefinitionBoolean flag that is true when the Form 8-K filing is intended to satisfy the filing obligation of the registrant as written communications pursuant to Rule 425 under the Securities Act. Reference 1: http://www.xbrl.org/2003/role/presentationRef
-Publisher SEC
-Name Securities Act
-Number 230
-Section 425
| Name: |
dei_WrittenCommunications |
| Namespace Prefix: |
dei_ |
| Data Type: |
xbrli:booleanItemType |
| Balance Type: |
na |
| Period Type: |
duration |
|
| X |
- Details
| Name: |
us-gaap_StatementClassOfStockAxis=us-gaap_CommonStockMember |
| Namespace Prefix: |
|
| Data Type: |
na |
| Balance Type: |
|
| Period Type: |
|
|
| X |
- Details
| Name: |
us-gaap_StatementClassOfStockAxis=banc_DepositarySharesEachRepresenting140Member |
| Namespace Prefix: |
|
| Data Type: |
na |
| Balance Type: |
|
| Period Type: |
|
|
Banc of California (NYSE:BANC)
Historical Stock Chart
From Apr 2024 to May 2024

Banc of California (NYSE:BANC)
Historical Stock Chart
From May 2023 to May 2024
