Ethereum Sees Massive Outflows from Derivatives: What Does This Mean For ETH?
September 10 2024 - 7:00AM
NEWSBTC
Ethereum, the second-largest cryptocurrency by market
capitalization, has been experiencing noteworthy movements in its
derivatives markets. Particularly, according to a recent analysis
by a CryptoQuant analyst known as ‘Heisenberg,’ the netflow of
Ethereum on derivative exchanges has seen a significant negative
shift, exceeding 40,000 ETH. Related Reading: Ethereum’s Plunge
Could Be Over: This Key Pattern Signals A Rally Back To $4,000
Ethereum Derivative Market Outflow: What It Means For ETH
Heisenberg explained that netflow refers to the difference between
the amount of Ethereum entering exchanges (inflows) and the amount
being withdrawn (outflows). A negative netflow indicates that more
ETH is withdrawn from derivative exchanges than deposited. This is
particularly relevant because derivative exchanges, such as
leveraged positions or short selling, are often used for trading. A
negative netflow of 40,000 ETH, as reported by Heisenberg, could be
a signal suggesting that the selling pressure on Ethereum may be
reduced, which could lead to a less volatile market in the coming
days. Negative netflow exceeding 40,000 $ETH on derivative
exchanges “Indicates that more ETH is being withdrawn from
Derivative Exchanges, which might suggest reduced selling
pressure.” – By @3AMRTAHA_ Full post 👇https://t.co/5v0PWwq9Mw
pic.twitter.com/MrE4zRNQro — CryptoQuant.com (@cryptoquant_com)
September 9, 2024 Elaborating on this phenomenon, when more
Ethereum is withdrawn from exchanges than deposited, it generally
indicates that investors and traders are holding onto their assets
rather than selling them. This reduction in selling pressure is a
major metric for assessing the potential stability of Ethereum’s
price in the near term. In addition, the reduced borrowing on
derivative exchanges might indicate a decreased interest in opening
new short positions, further reducing the downward pressure on
Ethereum’s price. ETH Market Performance And Outlook Notably, the
implication of this increased outflow of ETH on derivative
exchanges is not reflected in the asset’s market price. As
mentioned earlier, the current trend in this metric signals reduced
downward pressure for ETH. However, the asset remains drowning in
red according to ETH’s latest price performance. Particularly, over
the past week alone, ETH has still been down by 9.2%. Although the
asset has seen a slight 0.5% increase in price over the past day,
this was not enough to make ETH’s price see a major recovery. At
the time of writing, the asset currently trades for $2,282, with a
24-hour high of $2,334 and a 24-hour low of $2,246. As for its
daily trading volume, this metric has also refused to see a
significant increase. Related Reading: Is Ethereum Headed For
Trouble? Analyst Warns Of Surging Exchange Reserves Instead, over
the past week, ETH’s daily trading volume has continued to range
between $13 billion and $11 billion. According to renowned crypto
analyst Ezekiel, “It’s not crypto bottom until ETH drops below
2,000.” #eth #ethereum It’s not crypto bottom until eth drops below
2k pic.twitter.com/uSn9uEekcQ — Ezekiel🐼 (@duje_matic) September 9,
2024 Featured image created with DALL-E, Chart from TradingView
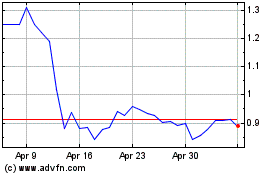
Flow (COIN:FLOWUSD)
Historical Stock Chart
From Aug 2024 to Sep 2024

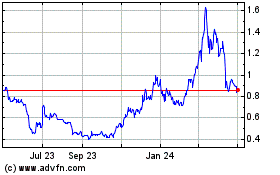
Flow (COIN:FLOWUSD)
Historical Stock Chart
From Sep 2023 to Sep 2024
