Buckle Up: Here Is Why Bitcoin Might Just Be Gearing Up For a 200% Surge
July 02 2024 - 10:00PM
NEWSBTC
Amid the current Bitcoin market performance suggesting signs of a
rebound, prominent crypto analyst Wise Advice has
highlighted a critical indicator in Bitcoin’s trading pattern.
Bollinger Bands Signal 200% Bitcoin Surge According to the analyst,
the Bitcoin weekly Bollinger Band, a statistical chart
characterizing the prices and volatility over time, has shrunk to
its second-lowest width in six years. Traditionally, such
contraction has been a precursor to substantial price movements.
Related Reading: Market Analysts Eye July for Potential Big Wins in
Bitcoin and Ethereum — Here’s Why Wise advice disclosed that
historically, a similar constriction was observed before Bitcoin
surged 200% from a base of $24,000 to a high peak within five
months. This indicator is particularly noteworthy as it suggests
that market volatility is about to increase, potentially leading to
a significant price rise. For context, Bollinger Bands are a set of
trend indicators derived from a moving average and an upper and
lower band, each set at a standard deviation from the moving
average. This tool helps traders to assess how high or low the
current price is relative to previous trades. A narrowing of these
bands typically indicates a reduction in volatility. A sharp
increase or decrease often follows it in price, as the market
prepares to make a substantial move. Bitcoin Holders, Read this 🚨
The #Bitcoin weekly Bollinger band is now at its 2nd lowest level
in 6 years. The last time it was this low, #BTC was trading at
$24K, and it pumped 200% in just 5 months
pic.twitter.com/jnud3pCjAr — Wise Advice (@wiseadvicesumit) July 1,
2024 Recent Market Activity and Bullish Outlook Despite a promising
setup, Bitcoin has recently struggled to maintain its upward
momentum. Over the past week, while there has been a modest 3%
recovery, the price has faced resistance, peaking at $63,790 before
dipping to around $62,563. This recent price action occurs amid
broader market anticipation of a favorable July. Market analysts,
including the team at QCP Capital, reference historical data
showing Bitcoin’s tendency to rebound in July with an average
return of 9.6%, especially after weak performances in June. This
pattern of a strong July following a weak June is supported by
additional market commentary. They are not alone in their optimism;
other market analysts like Ali have also noted similar recovery
patterns in past post-June slumps, hinting at a strong comeback in
July. Supporting the bullish sentiment are the substantial inflows
into US spot Bitcoin ETFs. This Monday, these funds recorded daily
net inflows totaling $129.45 million, marking the fifth consecutive
day of positive flows and the most substantial intake since early
June. Related Reading: Bitcoin Begins Month With A Rebound As
Metaplanet’s BTC Investment Tops $10 Million Leading the inflows
were Fidelity’s FBTC and Bitwise’s BITB, with significant
contributions, suggesting that institutional interest remains
strong despite the market’s recent fluctuations. Featured image
created with DALL-E, Chart from TradingView
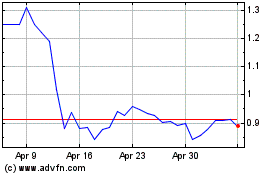
Flow (COIN:FLOWUSD)
Historical Stock Chart
From Jun 2024 to Jul 2024

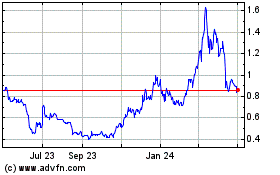
Flow (COIN:FLOWUSD)
Historical Stock Chart
From Jul 2023 to Jul 2024
