Is the Economy Finally Back on Track? - Real Time Insight
May 03 2013 - 11:45AM
Zacks
With the strong April jobs report and the large number of
positive revisions for February and March, stocks were able to hit
fresh highs to close out the week. And even more importantly, the
report led many to believe that we might be able to avoid another
summer swoon, and that the economy could finally be back on
track.
After all, we have seen a number of strong domestic data points
lately including:
- Consumer spending for March that was up 3.5% yoy.
- Home supplies remain at robust levels while housing prices are
increasing, leaving many feeling more confident about their
financial position.
- While not really a data point, stocks are at all-time highs, so
at least on this metric one aspect of the economy is definitely at
pre-recession levels.
However, every data point hasn’t been rosy over the past couple
of weeks as we have seen some weakness in a few key areas. These
include the following releases:
- Factory orders for March came in below the consensus with a
-4.0% m/m change.
- ISM manufacturing finished at 50.7 for April, a miss compared
to the 51.0 expectation.
- International markets: Europe remains weak on a number of
levels, while China has seen its manufacturing sector slowdown as
well.
So clearly, even with the strong jobs report, we could be facing
a continuation of the ‘muddle through’ economy in the near term.
But recent figures have definitely been promising, especially on
the consumer front, and could suggest a breakout from here…
But what do you think?
Is the economy going to pick up steam, or is this jobs report
the last of the good news before a summer slowdown?
Let us know in the comments below!
Want the latest recommendations from Zacks Investment Research?
Today, you can download 7 Best Stocks for the Next 30
Days. Click to get this free report >>
SPDR-DJ IND AVG (DIA): ETF Research Reports
ISHARS-SP500 (IVV): ETF Research Reports
SPDR-SP 500 TR (SPY): ETF Research Reports
VANGD-SP5 ETF (VOO): ETF Research Reports
To read this article on Zacks.com click here.
Zacks Investment Research
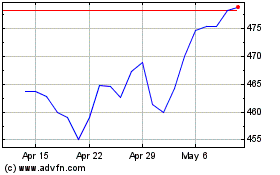
Vanguard S&P 500 (AMEX:VOO)
Historical Stock Chart
From Nov 2024 to Dec 2024

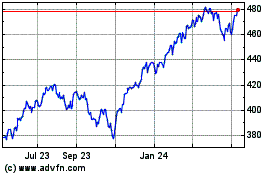
Vanguard S&P 500 (AMEX:VOO)
Historical Stock Chart
From Dec 2023 to Dec 2024
