1173 Coleman AveSan JoseCalifornia0001428439FALSE00014284392024-02-152024-02-15
UNITED STATES
SECURITIES AND EXCHANGE COMMISSION
Washington, D.C. 20549
Form 8-K
CURRENT REPORT
Pursuant to Section 13 or 15(d) of the Securities Exchange Act of 1934
Date of Report (Date of earliest event reported): February 15, 2024
ROKU, INC.
(Exact name of Registrant as Specified in Its Charter)
| | | | | | | | |
| Delaware | 001-38211 | 26-2087865 |
(State or Other Jurisdiction of Incorporation) | (Commission File Number) | (IRS Employer Identification No.) |
| | | |
1173 Coleman Ave San Jose, California | | 95110 |
| (Address of Principal Executive Offices) | | (Zip Code) |
(408) 556-9040
(Registrant’s Telephone Number, Including Area Code)
Not Applicable
(Former Name or Former Address, if Changed Since Last Report)
Check the appropriate box below if the Form 8-K filing is intended to simultaneously satisfy the filing obligation of the registrant under any of the following provisions (see General Instructions A.2. below):
| | | | | |
| ☐ | Written communications pursuant to Rule 425 under the Securities Act (17 CFR 230.425) |
| | | | | |
| ☐ | Soliciting material pursuant to Rule 14a-12 under the Exchange Act (17 CFR 240.14a-12) |
| | | | | |
| ☐ | Pre-commencement communications pursuant to Rule 14d-2(b) under the Exchange Act (17 CFR 240.14d-2(b)) |
| | | | | |
| ☐ | Pre-commencement communications pursuant to Rule 13e-4(c) under the Exchange Act (17 CFR 240.13e-4(c)) |
Securities registered pursuant to Section 12(b) of the Act:
| | | | | | | | |
Title of Each Class: | Trading Symbol(s): | Name of Exchange on Which Registered: |
| Class A Common Stock, $0.0001 par value | “ROKU” | The Nasdaq Global Select Market |
Indicate by check mark whether the registrant is an emerging growth company as defined in Rule 405 of the Securities Act of 1933 (§230.405 of this chapter) or Rule 12b-2 of the Securities Exchange Act of 1934 (§240.12b-2 of this chapter).
Emerging growth company ☐
If an emerging growth company, indicate by check mark if the registrant has elected not to use the extended transition period for complying with any new or revised financial accounting standards provided pursuant to Section 13(a) of the Exchange Act. ☐
Item 2.02 Results of Operations and Financial Condition.
On February 15, 2024, Roku, Inc. (the “Company”) announced its financial results for the quarter and year ended December 31, 2023. The Company’s Shareholder Letter, which is attached hereto as Exhibit 99.1, is incorporated herein by reference.
The information in this report shall not be treated as “filed” for purposes of Section 18 of the Securities Exchange Act of 1934, nor shall it be deemed incorporated by reference into any registration statement or other document pursuant to the Securities Act of 1933 or the Securities Exchange Act of 1934, except as expressly stated by specific reference in such filing.
Item 9.01 Financial Statements and Exhibits.
| | | | | | | | | | | |
| (d) | | Exhibits. | |
| | | | |
| Exhibit Number | | Description | |
| | | |
| 99.1* | | |
| | | |
| 104 | | Cover Page Interactive Data File (embedded within the Inline XBRL document) | |
*This exhibit is intended to be furnished and shall not be deemed “filed” for purposes of the Securities and Exchange Act of 1934.
SIGNATURE
Pursuant to the requirements of the Securities Exchange Act of 1934, the Registrant has duly caused this report to be signed on its behalf by the undersigned hereunto duly authorized.
| | | | | | | | |
| | Roku, Inc. |
| | |
| Dated: February 15, 2024 | |
| | By: | /s/ Dan Jedda |
| | | Dan Jedda |
| | | Chief Financial Officer |
| | | | | | | | | | | | | | | | | | | | | | | | | | | | | |
| Fellow Shareholders, | | | | | | | | | February 15, 2024 |
We are executing well and ended 2023 with 80 million Active Accounts globally and our first year of more than 100 billion Streaming Hours. We grew monetization with Platform revenue up double digits YoY in both Q4 and full year 2023. We also achieved positive Adjusted EBITDA and Free Cash Flow for 2023 — a year ahead of schedule. From this position of improved operational efficiency, we are focusing more of our management attention in 2024 on innovation and growth. There are more opportunities to help our viewers find content across the streaming universe, in ways that are engaging and entertaining, while also driving monetization.
Full Year 2023 Key Results
•Total net revenue was $3.5 billion, up 11% year over year (YoY)
•Platform revenue was $3.0 billion, up 10% YoY
•Gross profit was $1.5 billion, up 6% YoY
•Active Accounts were 80.0 million, a net increase of 10.0 million from 2022
•Streaming Hours were 106.0 billion, up 18.6 billion hours YoY
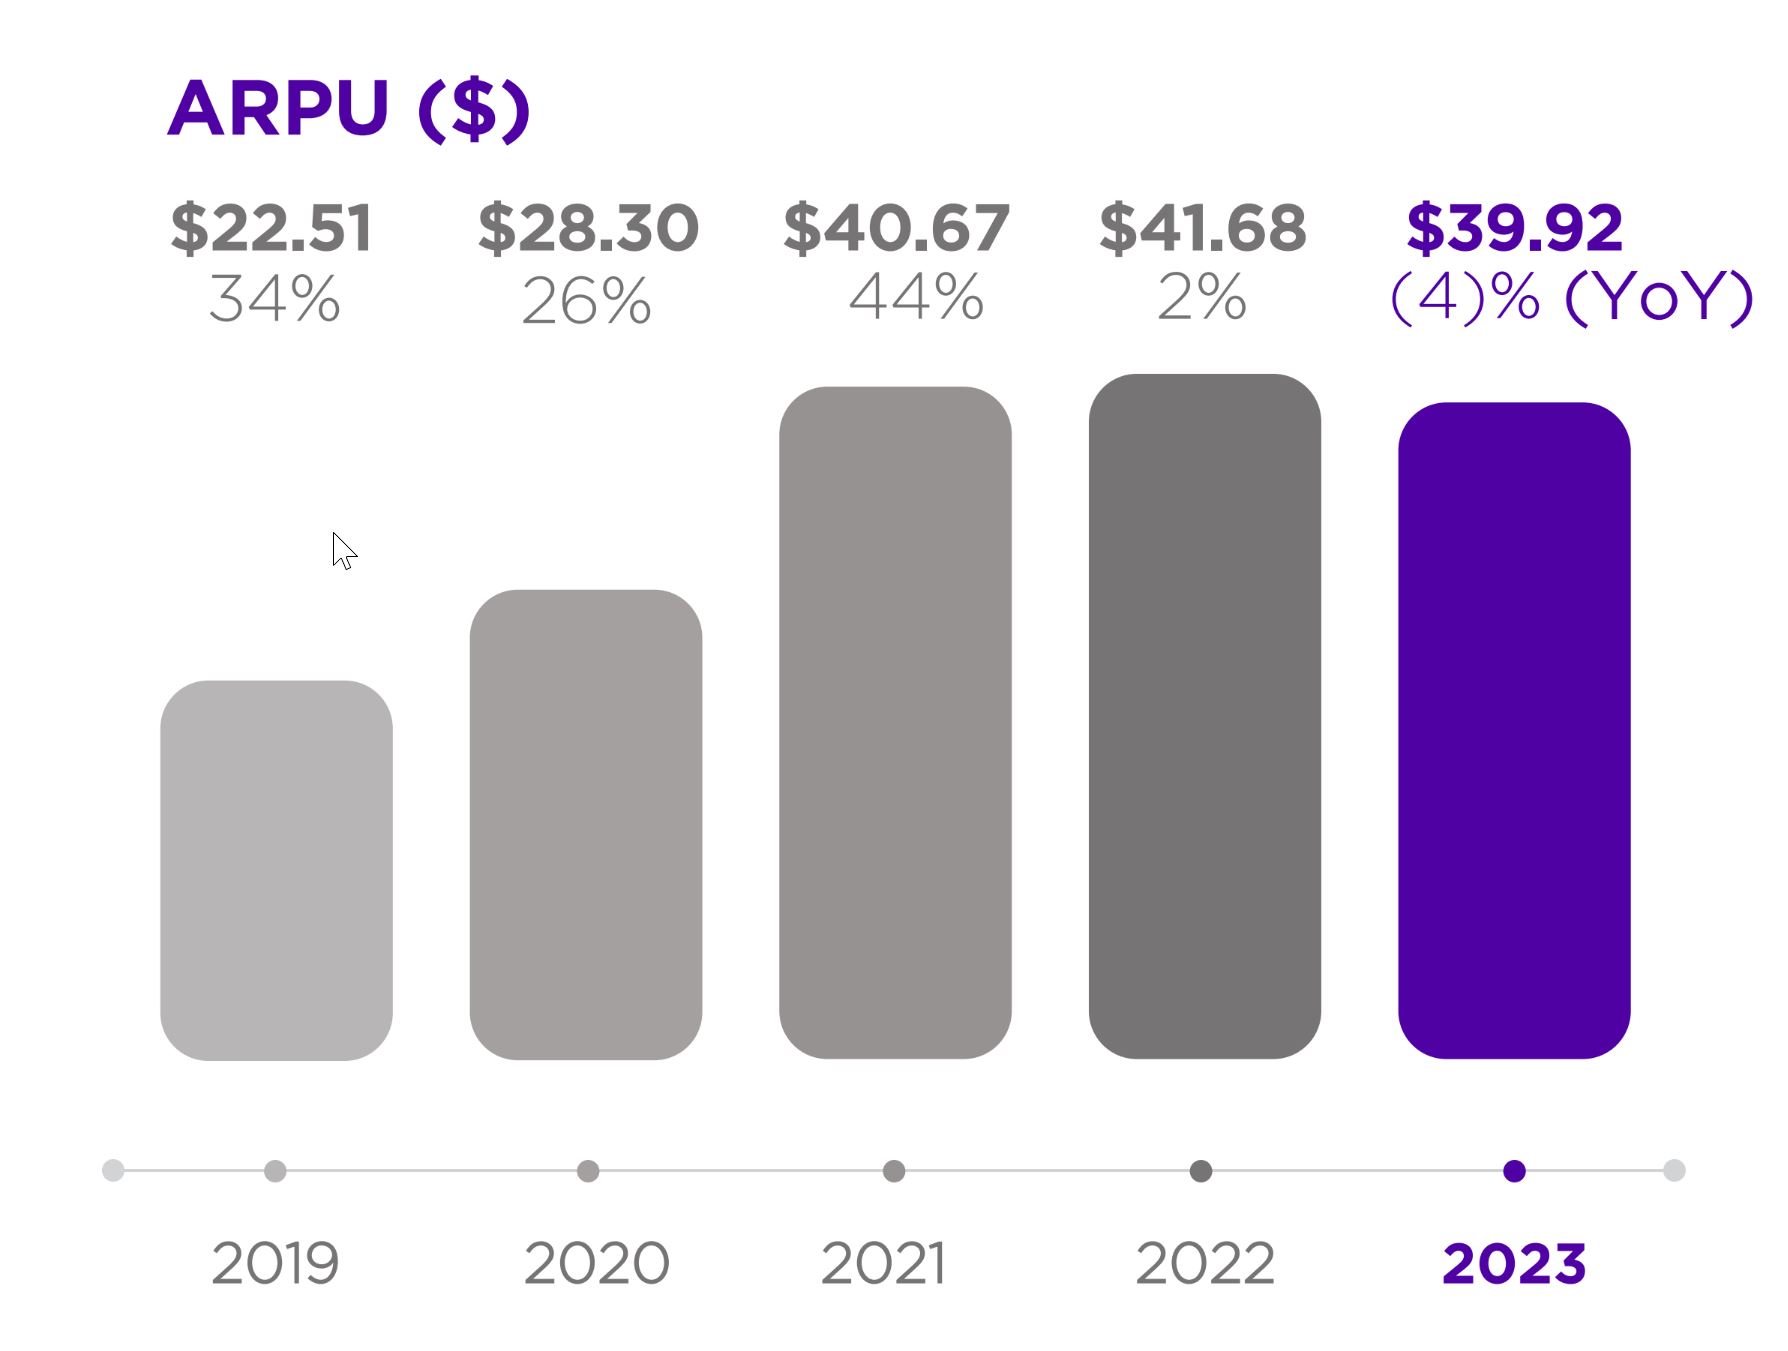
•Average Revenue Per User (ARPU) was $39.92 (trailing 12-month basis), down 4% YoY
•Achieved positive Adjusted EBITDA and Free Cash Flow for full year 2023, ahead of schedule
| | | | | | | | | | | | | | | | | | | | | | | | | | | | | | | | | | | |
| Key Operating Metrics | Q4 22 | | Q1 23 | | Q2 23 | | Q3 23 | | Q4 23 | | YoY % |
| Active Accounts (millions) | 70.0 | | | 71.6 | | | 73.5 | | | 75.8 | | | 80.0 | | | 14 | % |
| Streaming Hours (billions) | 23.9 | | | 25.1 | | | 25.1 | | | 26.7 | | | 29.1 | | | 21 | % |
| ARPU (TTM) | $ | 41.68 | | | $ | 40.67 | | | $ | 40.67 | | | $ | 41.03 | | | $ | 39.92 | | | (4) | % |
| | | | | | | | | | | |
| Summary Financials ($ in millions) | Q4 22 | | Q1 23 | | Q2 23 | | Q3 23 | | Q4 23 | | YoY % |
| Platform revenue | $ | 731.3 | | | $ | 634.6 | | | $ | 743.8 | | | $ | 786.8 | | | $ | 828.9 | | | 13 | % |
| Devices revenue | 135.8 | | | 106.4 | | | 103.4 | | | 125.2 | | | 155.6 | | | 15 | % |
| Total net revenue | 867.1 | | | 741.0 | | | 847.2 | | | 912.0 | | | 984.4 | | | 14 | % |
| Platform gross profit | 408.0 | | | 334.0 | | | 395.8 | | | 378.2 | | | 458.5 | | | 12 | % |
| Devices gross profit (loss) | (43.6) | | | 3.6 | | | (17.6) | | | (9.4) | | | (20.5) | | | 53 | % |
| Total gross profit | 364.4 | | | 337.6 | | | 378.3 | | | 368.8 | | | 437.9 | | | 20 | % |
| Platform gross margin % | 55.8 | % | | 52.6 | % | | 53.2 | % | | 48.1 | % | | 55.3 | % | | (0.5) | pts |
| Devices gross margin % | (32.1) | % | | 3.4 | % | | (17.0) | % | | (7.5) | % | | (13.2) | % | | 18.9 | pts |
| Total gross margin % | 42.0 | % | | 45.6 | % | | 44.7 | % | | 40.4 | % | | 44.5 | % | | 2.5 | pts |
| Research and development | 220.7 | | | 220.1 | | | 192.4 | | | 282.2 | | | 183.8 | | | (17) | % |
| Sales and marketing | 297.6 | | | 233.9 | | | 227.2 | | | 307.7 | | | 264.6 | | | (11) | % |
| General and administrative | 96.0 | | | 96.1 | | | 84.7 | | | 128.7 | | | 93.7 | | | (2) | % |
| Total operating expenses | 614.3 | | | 550.1 | | | 504.2 | | | 718.6 | | | 542.1 | | | (12) | % |
| Income (loss) from operations | (249.9) | | | (212.5) | | | (126.0) | | | (349.8) | | | (104.2) | | | 58 | % |
Adjusted EBITDA A | (95.2) | | | (69.1) | | | (17.8) | | | 43.4 | | | 47.7 | | | nm |
| Adjusted EBITDA margin % | (11.0) | % | | (9.3) | % | | (2.1) | % | | 4.8 | % | | 4.8 | % | | 15.8 | pts |
| Cash flow from operations (TTM) | 11.8 | | (243.4) | | 15.4 | | 246.9 | | 255.9 | | nm |
Free cash flow (TTM) A | (154.1) | | (448.1) | | (169.3) | | 100.8 | | 175.9 | | nm |
| | | | | | | | | | | |
| Outlook ($ in millions) | Q1 2024E | | A - Refer to the reconciliation of Net loss to Adjusted EBITDA and Cash flow from operations to Free cash flow in the non-GAAP information at the end of this letter. |
| Total net revenue | $850 | |
| Total gross profit | $370 | | B - Q1 2024E reconciling items between net loss and non-GAAP Adjusted EBITDA consist of stock-based compensation of approx. $95 million, depreciation and amortization of approx. $15 million, and other income of approx. $20 million. |
| Net income (loss) | $(90) | |
Adjusted EBITDA B | $— | |
| | |
| Roku Q4 and Full Year 2023 Shareholder Letter |
1
Our Business Model
Our three-phased business model — grow scale, grow engagement, and grow monetization — drives our mission as a global streaming platform that connects and benefits the TV ecosystem of viewers, content partners, and advertisers. We leverage our ownership of the platform to help our viewers find content across the streaming universe, while simultaneously growing monetization.
Market Leading Scale
We ended 2023 with 80.0 million Active Accounts globally. Q4 net adds were 4.2 million, and full year net adds of 10.0 million were a record outside of 2020 and driven primarily by the Roku TV program in the U.S. and international markets. In the U.S., our Active Account base is bigger than the subscribers of the six largest traditional pay-TV providers combined1.
We were pleased with our net adds despite overall TV unit sales in the U.S. being down YoY in Q4, due to LCD panel prices that increased YoY leading to smaller TV price discounts for consumers. Roku continued to benefit from consumers’ focus on value, and the Roku operating system (OS) was the #1 selling TV OS in the U.S. for the fifth year in a row2.
We have also driven strong results internationally as we continue to expand our Roku TV licensing program. In Q4, the Roku OS was the #1 selling TV OS in both Canada and Mexico3. In Canada, we launched the Philips QLED Roku TV in 2023. In Mexico, we grew our lineup to include the 8K Roku TV with TCL; new Roku TV models with Philips and Sharp; and a new Roku TV partner, RCA. In Central America, we launched RCA Roku TV models in Costa Rica, El Salvador, Guatemala, Honduras, and Nicaragua, and Roku TV models with Caixun in Chile. And in the U.K., we launched Roku TV models with JVC at Currys stores, with Polaroid at Asda stores, and with Sharp at numerous retailers.
As we celebrate 10 years of our successful Roku TV program, we now have more than 30 TV partners globally, with a wide range of models in a variety of sizes. To complement this program, we launched Roku-branded TVs (designed, made, and sold by Roku) in early 2023 exclusively at Best Buy, the leading consumer tech retailer. We recently expanded retail availability of Roku-branded TVs to Costco and Amazon.com.
1 Leichtman Research Group, Nov 2023
2 Source: Circana, Retail Tracking Service, Quarterly Unit Sales, Q1 2019 – Q4 2023
3 Source: Circana, Retail Tracking Service, Unit Sales, Oct-Dec 2023 combined
| | |
| Roku Q4 and Full Year 2023 Shareholder Letter |
2
In January 2024, one year after the launch of Roku-branded TVs, we announced an expansion to our award-winning lineup by adding the Roku Pro Series with advanced features and best-in-class technology. Roku Pro Series TVs will have exceptional picture quality with a 4K QLED display and enhanced audio technology for a wide cinematic sound. Additionally, both Roku-branded TVs and Roku TV models will have Roku Smart Picture. This new set of features identifies the type of content on the screen through artificial intelligence to adjust the picture automatically for an optimized viewing experience. Roku Pro Series TVs will be available in the U.S. this spring in three sizes: 55”, 65”, and 75”, with retail prices under $1,500.
Roku Pro Series TV
Driving Engagement
Globally, our users streamed a record 29.1 billion hours in Q4 and 106.0 billion hours in 2023 — the first year in which we have surpassed 100 billion hours. Roku continues to be the #1 TV streaming platform by hours streamed in the U.S. and Mexico4.
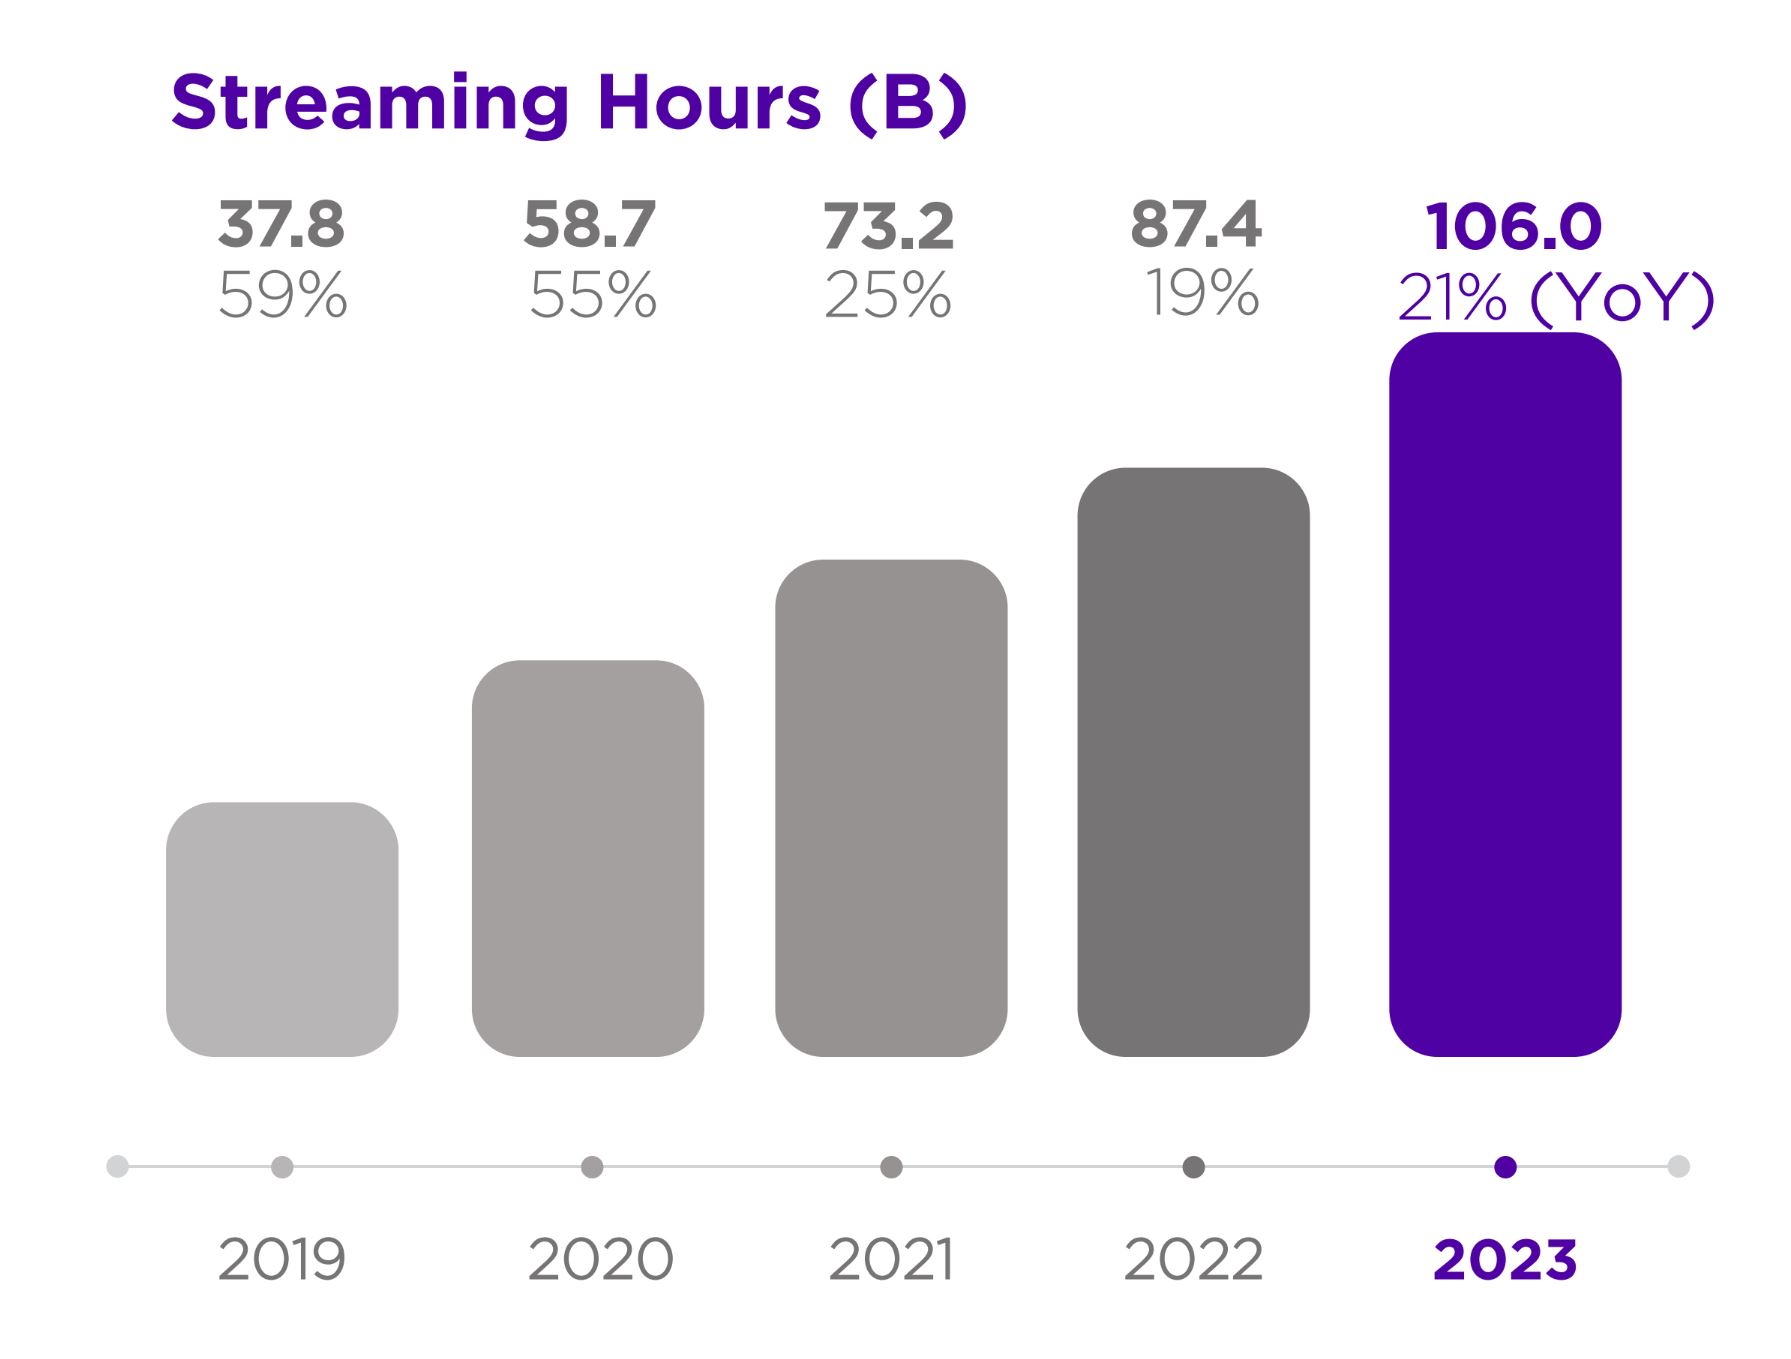
The shift from traditional TV to streaming continues unabated. In Q4, hours on traditional TV in the U.S. fell 16% YoY (Nielsen), while global Streaming Hours on the Roku platform grew 21% YoY, and Streaming Hours on The Roku Channel grew 63% YoY. We also grew engagement per account globally, with Streaming Hours per Active Account per day of 4.1 hours in Q4 2023, up from 3.8 hours in Q4 2022 and 3.6 hours in Q4 2021. Average viewing time on traditional TV is 7.5 hours per day in the U.S. (Nielsen), providing significant opportunity for us to continue to grow our engagement. Additionally, there remains a significant gap between viewership and ad dollars on TV streaming. In 2023, U.S. adults aged 18-49 spent more than 60% of their TV time on streaming5, while advertisers spent just 29% of their TV budgets on streaming6.
4 Dec 2023, Hypothesis Group
5 Nielsen
6 eMarketer
| | |
| Roku Q4 and Full Year 2023 Shareholder Letter |
3
Viewer Experience
We leverage our advantage as the programmer of the home screen for 80 million Active Accounts globally, to help viewers discover content from the start of their streaming journey. In 2023, Streaming Hours originating from the home screen menu (left-hand navigation) more than doubled YoY.
In Q4, we updated the Roku home screen so viewers can quickly find and watch content from two popular categories: lifestyle and Live TV. Within lifestyle, we created two new viewer experiences, All Things Food and All Things Home, to aggregate the best culinary-themed and home and garden-themed content on the Roku platform. We continue to improve our Live TV offering by updating the experience and adding more FAST7 content partners, which together drives growing engagement on our platform. We recently added a Live TV guide tile to the first position in the home screen grid (on the right side of the home screen), for TVs powered by a Roku streaming player, to give viewers quicker and easier access to this popular category.
All Things Home
Live TV guide tile in the home screen grid
Located on our home screen menu, What to Watch offers viewers a curated selection of content from across the Roku platform. We first launched this experience in the U.S. and followed in international markets of Canada, Mexico, Brazil, and the U.K. In late 2022, we also launched the Sports experience on the Roku home screen menu in the U. S. to aggregate sporting events in a single, centralized location. Throughout 2023, we added a Women’s Sports Zone, the NFL Zone, and the ability for viewers to track their favorite teams.
7 FAST: free ad-supported linear streaming TV, does not include on-demand content
| | |
| Roku Q4 and Full Year 2023 Shareholder Letter |
4
Viewers can find a specific piece of content by launching our powerful search functionality from the home screen menu, the remote (with a voice search), or the Roku mobile app. In 2023 we made enhancements to better personalize results by displaying streaming service options according to the viewer’s active subscriptions. Additionally, search results are now more informative, showing trailers, episode guides, and features such as Save List and You May Also Like recommendations. This enhanced search, which is the result of dozens of improvements, provides a better viewer experience while also growing engagement and monetization opportunities. In Q4, Streaming Hours launched from search results were up 50% YoY.
BEFORE improvements
AFTER improvements
The Roku Channel
We aim to offer a broad array of entertainment, and The Roku Channel aggregates three types of content — AVOD8, Live TV (FAST), and Premium Subscriptions — into viewing experiences that are integrated throughout our platform. The Roku Channel has grown to become a top 10 streaming app in the U.S., comparable in engagement to peers such as Paramount+, Peacock, and Max9. In Q4, The Roku Channel reached U.S. households with an estimated 120 million people.
8 Ad-supported video on demand
9 December 2023 report of The GaugeTM
| | |
| Roku Q4 and Full Year 2023 Shareholder Letter |
5
The Roku Channel demonstrates how we leverage our ownership of the platform to simultaneously drive a better viewer experience and growing monetization. Our free Live TV offering can be accessed from the home screen menu, the home screen grid, and directly within The Roku Channel. Live TV offers diverse content, from a local news selection that rivals broadcast TV, to entertainment channels such as MrBeast and The NFL Channel that over-index with younger audiences. In Q4, we attracted strong advertiser interest with a viewer experience created specifically for the holidays. The experience featured thematic licensed programming, pop-up holiday FAST channels, and a lineup of new Roku Originals including How to Fall in Love by the Holidays sponsored by Walmart, The Holiday Shift sponsored by Kohl’s, and The Great American Baking Show: Celebrity Holiday sponsored by State Farm.
State Farm sponsored The Great American Baking Show: Celebrity Holiday
Growing Monetization
Platform revenue was $3.0 billion in 2023, up 10% YoY, and $829 million in Q4, up 13% YoY, reflecting strong contributions from streaming services distribution activities and video advertising, offset by lower M&E (media and entertainment) promotional spend. In Q4, Platform Gross Margin was 55%, relatively flat YoY. ARPU was $39.92 in Q4 (on a trailing 12-month basis), down 4% YoY, reflecting an increasing share of Active Accounts in international markets where we are currently focused on growing scale and engagement.
We generate Platform revenue primarily from the sale of advertising (including direct and programmatic video advertising, M&E promotional spending, sponsorships, and related ad products and services), as well as streaming services distribution (including subscription and transactional revenue, the sale of Premium Subscriptions, and the sale of branded app buttons on remote controls). We have renamed “content distribution” to “streaming services distribution” to more accurately describe these activities, though the activities remain the same.
| | |
| Roku Q4 and Full Year 2023 Shareholder Letter |
6
Streaming Services Distribution Activities
In Q4 and for full year 2023, streaming services distribution activities grew faster than Platform revenue overall, benefiting from increases in both subscription sign-ups and prices. As subscription prices increase, we believe consumers will seek savings via ad-supported subscriptions that have been launched by the major streaming services in the U.S. We believe these launches, along with growing consumer adoption, will be a catalyst within the industry for the shift of ad dollars from traditional TV to streaming. Roku is well-positioned to benefit from this shift due to our significant scale of 80 million Active Accounts and the tools to help streaming service partners not only attract subscribers but also grow engagement, which is critical in an ad-supported environment.
Advertising Activities
While the U.S. ad market recovery is uneven, the decline in traditional linear TV and the shift of advertising from traditional TV to streaming is consistent. In Q4, ad spending on traditional TV decreased 11% YoY, and traditional ad scatter decreased 9% YoY (according to SMI). Conversely, Roku saw continued signs of rebound. In Q4, the YoY growth of video advertising across the Roku platform outperformed both the overall ad market and the traditional linear TV ad market in the U.S. In Q4, Consumer Packaged Goods, Health and Wellness, and Telecom grew, while Media & Entertainment, Financial Services, and Insurance remain challenged.
In 2023, we made strong progress expanding our relationships with third-party platforms, including retail media networks, DSPs (demand side platforms), and other strategic partners. As a result, we have increased our new and existing advertisers, programmatic ad spend, and ad spend through third-party DSPs. In the past year, we formed new partnerships with retail platforms, including DoorDash, Instacart, Cox, and Best Buy; third-party DSPs, including Unity and FreeWheel; and measurement partners like Comscore. Serving more partners and advertisers, we also continue to improve and expand the performance and measurement capabilities Roku provides.
As we build new ad offerings for marketers, we are focused on the streamer’s journey, which begins with the Roku home screen. It is the first thing our viewers see, making Roku the lead-in10 to all content. With All Things Food, we simultaneously created a compelling entertainment destination for viewers and new monetization opportunities for Roku. The food zone was exclusively sponsored by Coca-Cola, which ran an innovative campaign during the 2023 holiday season to elevate its iconic brand. Coca-Cola leveraged marquee and spotlight ads on the Roku home screen, a shoppable experience in partnership with DoorDash, a sponsorship of Roku Original series Martha Holidays, and a holiday-themed Roku City integration – an immersive experience that only Roku can provide. This, and several other key sponsorships, drove Q4 to be the highest-ever quarter of sponsorship spend.
Exclusive sponsorship of All Things Food by Coca-Cola
10 The power of one program to elevate what comes after it
| | |
| Roku Q4 and Full Year 2023 Shareholder Letter |
7
Since opening Roku City (our beloved screensaver) to brand advertisers, we have executed integrations with some of the world’s most renowned brands, including Coca-Cola, Disney, Lego, McDonald's, Barbie/Mattel, Carnival, Acura and more. Roku City integrations have reached an average of more than 40 million Active Accounts. These engaging executions — again, only available on and through Roku — drive positive brand awareness for marketing partners, delight viewers, and elevate Roku’s distinct and playful brand attributes.
Roku City sponsorships from Coca-Cola, Disney, and Lego
Outlook
We plan to increase revenue and free cash flow and achieve profitability over time. At the same time, we remain mindful of near-term challenges in the macro environment and an uneven ad market recovery. While we will face difficult YoY growth rate comparisons in streaming services distribution and a challenging M&E environment for the rest of the year, we expect to maintain our Q4 2023 YoY Platform growth rates in Q1. This will result in Total net revenue of $850 million, total gross profit of roughly $370 million, and break-even Adjusted EBITDA in Q1. Continuing our performance from 2023, we expect to deliver positive Adjusted EBITDA for full year 2024.
Conclusion
For 2024 and beyond, there are two industry trends that are particularly important for Roku. The first is the enormous volume of content and live events on streaming. We have an inherent advantage as the programmer of the home screen to help our viewers find what they want to watch, while simultaneously growing our monetization. This is a big opportunity for Roku. Second, streaming services are focused on building successful ad-supported options for consumers, and this will further accelerate the overall shift of ad dollars from traditional TV to streaming. Roku has the tools and expertise to drive engagement, which is critical in an ad-supported environment. With our platform advantages, first-party relationship with 80 million Active Accounts, and deep user engagement, we are well-positioned to accelerate revenue growth in future years.
Thank you for your support, and Happy Streaming™!
Anthony Wood, Founder and CEO, and Dan Jedda, CFO
| | |
| Roku Q4 and Full Year 2023 Shareholder Letter |
8
Conference Call Webcast – February 15, 2024 at 2 p.m. PT
The Company will host a webcast of its conference call to discuss the Q4 and fiscal year 2023 results at 2 p.m. Pacific Time / 5 p.m. Eastern Time on February 15, 2024. Participants may access the live webcast in listen-only mode on the Roku investor relations website at www.roku.com/investor. An archived webcast of the conference call will also be available at www.roku.com/investor after the call.
Segment Reporting Change
Effective as of the fourth quarter of fiscal 2022, we reorganized reportable segments to better align with management’s reporting of information reviewed by our Chief Operating Decision Maker, our CEO, for each segment. Our segment and related financial information was recast to reflect the following changes: we renamed the Player segment to the Devices segment, which now includes licensing arrangements with service operators and TV brands in addition to sales of streaming players, audio products, smart home products and services, and starting in 2023, Roku-branded TV sales. All financial information, current and historical, is recast based on the reorganized segments.
About Roku, Inc.
Roku pioneered streaming to the TV. We connect viewers to the streaming content they love, enable content publishers to build and monetize large audiences, and provide advertisers with unique capabilities to engage consumers. Roku streaming players and TV-related audio devices are available in the U.S. and in select countries through direct retail sales and licensing arrangements with service operators. Roku TV™ models are available in the U.S. and in select countries through licensing arrangements with TV OEM brands. Roku Smart Home products, including cameras, video doorbells, lighting, plugs, and more are available in the U.S. Roku is headquartered in San Jose, Calif. U.S.A.
Roku, the Roku logo and other trade names, trademarks or service marks of Roku appearing in this shareholder letter are the property of Roku. Trade names, trademarks and service marks of other companies appearing in this shareholder letter are the property of their respective holders.
| | | | | |
Investor Relations Conrad Grodd cgrodd@roku.com | Media Stephanie Tackach stackach@roku.com |
| | |
| Roku Q4 and Full Year 2023 Shareholder Letter |
9
Use of Non-GAAP Measures
In addition to financial information prepared in accordance with generally accepted accounting principles in the United States (GAAP), this shareholder letter includes certain non-GAAP financial measures. These non-GAAP measures include Adjusted EBITDA and Free Cash Flow (FCF). In order for our investors to be better able to compare our current results with those of previous periods, we have included a reconciliation of GAAP to non-GAAP financial measures in the tables at the end of this letter. The Adjusted EBITDA reconciliation excludes other income (expense), net, stock-based compensation expense, depreciation and amortization, restructuring charges, and income tax (benefit)/expense from the net income (loss) of the period, and the FCF reconciliation excludes capital expenditures and effects of exchange rates from the cash flow from operations of the period, in each case where applicable. We believe these non-GAAP financial measures are useful as a supplement in evaluating our ongoing operational performance and enhancing an overall understanding of our past financial performance. However, these non-GAAP financial measures have limitations, and should not be considered in isolation or as a substitute for our GAAP financial information.
Forward-Looking Statements
This shareholder letter contains “forward-looking” statements that are based on our beliefs and assumptions and on information currently available to us. Forward-looking statements include all statements that are not historical facts and can be identified by terms such as “anticipate,” “believe,” “continue,” “could,” “design,” “estimate,” “expect,” “may,” "plan,” “seek,” “should,” “will,” “would” or similar expressions and the negatives of those terms. Forward-looking statements involve known and unknown risks, uncertainties and other factors that may cause our actual results, performance or achievements to be materially different from any future results, performance or achievements expressed or implied by the forward-looking statements. Forward-looking statements represent our beliefs and assumptions only as of the date of this letter. These statements include those related to our ability to innovate, build and launch new products and services, including the Roku Pro Series TVs; changes in the ad market; the shift of TV and TV advertising to streaming; increasing subscription prices and the potential consumer response to seek savings via ad-supported subscriptions; the effect that the proliferation of ad-supported subscriptions will have on the overall shift of ad dollars from traditional TV to streaming; our ability to grow our Active Accounts; our room for growth in engagement; our ability to promote content effectively on The Roku Channel both to serve our existing audience and to attract new viewers; our international expansion; our ability to continue to improve the viewer experience, including by innovating the Roku home screen to help viewers discover content, improving search functionality, and enhancing our Live TV offering; the growth in volume of content and live events on streaming; our ability to deliver growth in platform monetization; our ability to innovate our ad tech; our relationships with third-party advertising platforms; our ability to navigate through macroeconomic headwinds and an uneven ad market recovery; our belief that the current macro environment is temporary; our financial outlook for the first quarter of 2024, our plans to achieve positive adjusted EBITDA for full year 2024, and our qualitative color on our business in 2024 and beyond; our belief that we are well-positioned to accelerate revenue growth; and our overall business trajectory. Except as required by law, we assume no obligation to update these forward-looking statements publicly, or to update the reasons actual results could differ materially from those anticipated in the forward-looking statements, even if new information becomes available in the future. Further information on factors that could cause actual results to differ materially from the results anticipated by our forward-looking statements is included in the reports we have filed with the Securities and Exchange Commission, including our Annual Report on Form 10-K for the year ended December 31, 2022 and our Quarterly Report on Form 10-Q for the quarter ended September 30, 2023. Additional information also will be available in our Annual Report on Form 10-K for the year ended December 31, 2023. All information provided in this shareholder letter and in the tables attached hereto is as of February 15, 2024, and we undertake no duty to update this information unless required by law.
| | |
| Roku Q4 and Full Year 2023 Shareholder Letter |
10
ROKU, INC.
CONSOLIDATED STATEMENTS OF OPERATIONS
(in thousands, except per share data)
(unaudited)
| | | | | | | | | | | | | | | | | | | | | | | |
| Three Months Ended December 31, | | Years Ended December 31, |
| 2023 | | 2022 | | 2023 | | 2022 |
| Net Revenue: | | | | | | | |
| Platform | $ | 828,867 | | | $ | 731,261 | | | $ | 2,994,105 | | | $ | 2,711,441 | |
| Devices | 155,558 | | | 135,795 | | | 490,514 | | | 415,093 | |
| Total net revenue | 984,425 | | | 867,056 | | | 3,484,619 | | | 3,126,534 | |
| Cost of Revenue: | | | | | | | |
| Platform (1) | 370,395 | | | 323,279 | | | 1,427,546 | | | 1,179,675 | |
| Devices (1) | 176,106 | | | 179,400 | | | 534,458 | | | 505,737 | |
| Total cost of revenue | 546,501 | | | 502,679 | | | 1,962,004 | | | 1,685,412 | |
| Gross Profit (Loss): | | | | | | | |
| Platform | 458,472 | | | 407,982 | | | 1,566,559 | | | 1,531,766 | |
| Devices | (20,548) | | | (43,605) | | | (43,944) | | | (90,644) | |
| Total gross profit | 437,924 | | | 364,377 | | | 1,522,615 | | | 1,441,122 | |
| Operating Expenses: | | | | | | | |
| Research and development (1) | 183,801 | | | 220,670 | | | 878,474 | | | 788,913 | |
| Sales and marketing (1) | 264,554 | | | 297,562 | | | 1,033,359 | | | 838,419 | |
| General and administrative (1) | 93,737 | | | 96,043 | | | 403,159 | | | 344,678 | |
| Total operating expenses | 542,092 | | | 614,275 | | | 2,314,992 | | | 1,972,010 | |
| Loss from Operations | (104,168) | | | (249,898) | | | (792,377) | | | (530,888) | |
| Other Income, Net: | | | | | | | |
| Interest expense | (35) | | | (1,888) | | | (730) | | | (5,161) | |
| Other income, net | 27,665 | | | 13,614 | | | 93,677 | | | 43,766 | |
| Total other income, net | 27,630 | | | 11,726 | | | 92,947 | | | 38,605 | |
| Loss Before Income Taxes | (76,538) | | | (238,172) | | | (699,430) | | | (492,283) | |
| Income tax expense (benefit) | 1,753 | | | (975) | | | 10,131 | | | 5,722 | |
| Net Loss | $ | (78,291) | | | $ | (237,197) | | | $ | (709,561) | | | $ | (498,005) | |
| | | | | | | |
| Net loss per share — basic and diluted | $ | (0.55) | | | $ | (1.70) | | | $ | (5.01) | | | $ | (3.62) | |
| | | | | | | |
| | | | | | | |
| Weighted-average common shares outstanding — basic and diluted | 143,011 | | 139,658 | | 141,572 | | 137,668 |
| | | | | | | |
| | | | | | | |
| (1) Stock-based compensation was allocated as follows: |
| Cost of revenue, platform | $ | 422 | | | $ | 347 | | | $ | 1,478 | | | $ | 1,229 | |
| Cost of revenue, devices | 1,335 | | | 621 | | | 3,761 | | | 2,440 | |
| Research and development | 37,188 | | | 40,523 | | | 147,989 | | | 147,653 | |
| Sales and marketing | 30,577 | | | 37,638 | | | 130,362 | | | 123,946 | |
| General and administrative | 23,252 | | | 25,148 | | | 86,540 | | | 84,663 | |
| Total stock-based compensation | $ | 92,774 | | | $ | 104,277 | | | $ | 370,130 | | | $ | 359,931 | |
| | |
| Roku Q4 and Full Year 2023 Shareholder Letter |
11
ROKU, INC.
CONSOLIDATED BALANCE SHEETS
(in thousands, except par value data)
(unaudited)
| | | | | | | | | | | |
| As of December 31, |
| 2023 | | 2022 |
| Assets | | | |
| Current Assets: | | | |
| Cash and cash equivalents | $ | 2,025,891 | | | $ | 1,961,956 | |
Accounts receivable, net of allowances of $34,127 and $40,191 as of | 816,337 | | | 760,793 | |
| December 31, 2023 and 2022, respectively | | | |
| Inventories | 92,129 | | | 106,747 | |
| Prepaid expenses and other current assets | 138,585 | | | 135,383 | |
| Total current assets | 3,072,942 | | | 2,964,879 | |
| Property and equipment, net | 264,556 | | | 335,031 | |
| Operating lease right-of-use assets | 371,444 | | | 521,695 | |
| Content assets, net | 257,395 | | | 292,766 | |
| Intangible assets, net | 41,753 | | | 58,881 | |
| Goodwill | 161,519 | | | 161,519 | |
| Other non-current assets | 92,183 | | | 77,830 | |
| Total Assets | $ | 4,261,792 | | | $ | 4,412,601 | |
| Liabilities and Stockholders’ Equity | | | |
| Current Liabilities: | | | |
| Accounts payable | $ | 385,330 | | | $ | 164,800 | |
| Accrued liabilities | 788,040 | | | 750,810 | |
| Current portion of long-term debt | — | | | 79,985 | |
| Deferred revenue, current portion | 102,157 | | | 87,678 | |
| Total current liabilities | 1,275,527 | | | 1,083,273 | |
| Long-term debt, non-current portion | — | | | — | |
| Deferred revenue, non-current portion | 24,572 | | | 28,210 | |
| Operating lease liability, non-current portion | 586,174 | | | 584,651 | |
| Other long-term liabilities | 49,186 | | | 69,911 | |
| Total Liabilities | 1,935,459 | | | 1,766,045 | |
| Stockholders’ Equity: | | | |
| Common stock, $0.0001 par value; | 14 | | | 14 | |
| Additional paid-in capital | 3,623,747 | | | 3,234,860 | |
| Accumulated other comprehensive income (loss) | 159 | | | (292) | |
| Accumulated deficit | (1,297,587) | | | (588,026) | |
| Total stockholders’ equity | 2,326,333 | | | 2,646,556 | |
| Total Liabilities and Stockholders’ Equity | $ | 4,261,792 | | | $ | 4,412,601 | |
| | |
| Roku Q4 and Full Year 2023 Shareholder Letter |
12
ROKU, INC.
CONSOLIDATED STATEMENTS OF CASH FLOWS
(in thousands)
(unaudited)
| | | | | | | | | | | |
| Years Ended December 31, |
| 2023 | | 2022 |
| Cash flows from operating activities: | | | |
| Net loss | $ | (709,561) | | | $ | (498,005) | |
| Adjustments to reconcile net loss to net cash provided by operating activities: | | | |
| Depreciation and amortization | 70,447 | | | 48,651 | |
| Stock-based compensation expense | 370,130 | | | 359,931 | |
| Amortization of right-of-use assets | 57,579 | | | 55,507 | |
| Amortization of content assets | 207,852 | | | 234,355 | |
| Foreign currency remeasurement (gains) losses | 1,457 | | | (8,230) | |
| Change in fair value of Strategic Investment | (4,348) | | | 532 | |
| Impairment of assets | 269,402 | | | 7,500 | |
| Provision for (recoveries of) doubtful accounts | 1,674 | | | 2,081 | |
| Other items, net | (1,510) | | | (190) | |
| Changes in operating assets and liabilities: | | | |
| Accounts receivable | (56,937) | | | (10,887) | |
| Inventories | 14,725 | | | (56,471) | |
| Prepaid expenses and other current assets | 15,058 | | | (15,941) | |
| Content assets and liabilities, net | (267,155) | | | (313,204) | |
| Other non-current assets | (592) | | | (7,304) | |
| Accounts payable | 248,175 | | | 14,190 | |
| Accrued liabilities | 57,714 | | | 167,526 | |
| Operating lease liabilities | (27,786) | | | (9,245) | |
| Other long-term liabilities | (1,309) | | | (403) | |
| Deferred revenue | 10,841 | | | 41,402 | |
| Net cash provided by operating activities | 255,856 | | | 11,795 | |
| Cash flows from investing activities: | | | |
| Purchases of property and equipment | (82,619) | | | (161,696) | |
| Purchase of Strategic Investment | (10,000) | | | (40,000) | |
| Net cash used in investing activities | (92,619) | | | (201,696) | |
| Cash flows from financing activities: | | | |
| Repayments of borrowings | (80,000) | | | (10,000) | |
| Proceeds from equity issued under incentive plans | 18,757 | | | 18,357 | |
| Net cash (used in) provided by financing activities | (61,243) | | | 8,357 | |
| Net increase (decrease) in cash, cash equivalents and restricted cash | 101,994 | | | (181,544) | |
| Effect of exchange rate changes on cash, cash equivalents and restricted cash | 2,654 | | | (4,170) | |
| Cash, cash equivalents and restricted cash —Beginning of period | 1,961,956 | | | 2,147,670 | |
| Cash, cash equivalents and restricted cash —End of period | $ | 2,066,604 | | | $ | 1,961,956 | |
| Cash, cash equivalents and restricted cash at end of period: | | | |
| Cash and cash equivalents | 2,025,891 | | 1,961,956 |
| Restricted cash, current | 40,713 | | | — | |
| Cash, cash equivalents and restricted cash —End of period | $ | 2,066,604 | | | $ | 1,961,956 | |
| | |
| Roku Q4 and Full Year 2023 Shareholder Letter |
13
| | | | | | | | | | | |
| Years Ended December 31, |
| 2023 | | 2022 |
| Supplemental disclosures of cash flow information: | | | |
| Cash paid for interest | $ | 915 | | | $ | 3,894 | |
| Cash paid for income taxes | $ | 6,632 | | | $ | 7,016 | |
| Supplemental disclosures of non-cash investing and financing activities: | | | |
| | | |
| | | |
| Unpaid portion of property and equipment purchases | $ | 429 | | | $ | 28,503 | |
NON-GAAP INFORMATION
(in thousands)
(unaudited)
Reconciliation of Net loss to Adjusted EBITDA:
| | | | | | | | | | | | | | | | | | | | | | | |
| Three Months Ended December 31, | | Years Ended December 31, |
| 2023 | | 2022 | | 2023 | | 2022 |
| Net loss | $ | (78,291) | | | $ | (237,197) | | | $ | (709,561) | | | $ | (498,005) | |
| Other income (expense), net | (27,630) | | | (11,726) | | | (92,947) | | | (38,605) | |
| Stock-based compensation | 92,774 | | | 104,277 | | | 370,130 | | | 359,931 | |
| Depreciation and amortization | 17,400 | | | 12,254 | | | 70,447 | | | 48,651 | |
Restructuring charges (1) | 41,731 | | | 38,140 | | | 356,094 | | | 38,140 | |
| Income tax expense (benefit) | 1,753 | | | (975) | | | 10,131 | | | 5,722 | |
| Adjusted EBITDA | $ | 47,737 | | | $ | (95,227) | | | $ | 4,294 | | | $ | (84,166) | |
(1) Restructuring charges of $356.1 million in fiscal year 2023 were composed primarily of operating lease right-of-use asset impairment charges of $131.6 million, property and equipment impairment charges of $72.3 million, content asset impairment charges of $65.5 million, employee severance and related charges of $83.2 million, and facilities exit costs of $3.5 million.
Restructuring charges of $38.1 million in fiscal year 2022 were composed primarily of employee severance and related charges of $30.6 million and an impairment charge of $7.5 million for the abandonment of certain technology intangible assets.
Free cash flow (TTM):
| | | | | | | | | | | | | | | | | | | | | | | | | | | | | |
| Q4 22 | | Q1 23 | | Q2 23 | | Q3 23 | | Q4 23 |
| Cash flow from operations | $ | 11,795 | | | $ | (243,415) | | | $ | 15,383 | | | $ | 246,882 | | | $ | 255,856 | |
| Less: Capital expenditures | (161,696) | | | (201,175) | | | (181,803) | | | (144,477) | | | (82,619) | |
| Add/(Less): Effects of exchange rates on cash | (4,170) | | | (3,515) | | | (2,914) | | | (1,599) | | | 2,654 | |
| Free cash flow (TTM) | $ | (154,071) | | | $ | (448,105) | | | $ | (169,334) | | | $ | 100,806 | | | $ | 175,891 | |
| | |
| Roku Q4 and Full Year 2023 Shareholder Letter |
14
| X |
- DefinitionBoolean flag that is true when the XBRL content amends previously-filed or accepted submission.
| Name: |
dei_AmendmentFlag |
| Namespace Prefix: |
dei_ |
| Data Type: |
xbrli:booleanItemType |
| Balance Type: |
na |
| Period Type: |
duration |
|
| X |
- DefinitionFor the EDGAR submission types of Form 8-K: the date of the report, the date of the earliest event reported; for the EDGAR submission types of Form N-1A: the filing date; for all other submission types: the end of the reporting or transition period. The format of the date is YYYY-MM-DD.
| Name: |
dei_DocumentPeriodEndDate |
| Namespace Prefix: |
dei_ |
| Data Type: |
xbrli:dateItemType |
| Balance Type: |
na |
| Period Type: |
duration |
|
| X |
- DefinitionThe type of document being provided (such as 10-K, 10-Q, 485BPOS, etc). The document type is limited to the same value as the supporting SEC submission type, or the word 'Other'.
| Name: |
dei_DocumentType |
| Namespace Prefix: |
dei_ |
| Data Type: |
dei:submissionTypeItemType |
| Balance Type: |
na |
| Period Type: |
duration |
|
| X |
- DefinitionAddress Line 1 such as Attn, Building Name, Street Name
| Name: |
dei_EntityAddressAddressLine1 |
| Namespace Prefix: |
dei_ |
| Data Type: |
xbrli:normalizedStringItemType |
| Balance Type: |
na |
| Period Type: |
duration |
|
| X |
- Definition
+ References
+ Details
| Name: |
dei_EntityAddressCityOrTown |
| Namespace Prefix: |
dei_ |
| Data Type: |
xbrli:normalizedStringItemType |
| Balance Type: |
na |
| Period Type: |
duration |
|
| X |
- DefinitionCode for the postal or zip code
| Name: |
dei_EntityAddressPostalZipCode |
| Namespace Prefix: |
dei_ |
| Data Type: |
xbrli:normalizedStringItemType |
| Balance Type: |
na |
| Period Type: |
duration |
|
| X |
- DefinitionName of the state or province.
| Name: |
dei_EntityAddressStateOrProvince |
| Namespace Prefix: |
dei_ |
| Data Type: |
dei:stateOrProvinceItemType |
| Balance Type: |
na |
| Period Type: |
duration |
|
| X |
- DefinitionA unique 10-digit SEC-issued value to identify entities that have filed disclosures with the SEC. It is commonly abbreviated as CIK. Reference 1: http://www.xbrl.org/2003/role/presentationRef
-Publisher SEC
-Name Exchange Act
-Number 240
-Section 12
-Subsection b-2
| Name: |
dei_EntityCentralIndexKey |
| Namespace Prefix: |
dei_ |
| Data Type: |
dei:centralIndexKeyItemType |
| Balance Type: |
na |
| Period Type: |
duration |
|
| X |
- DefinitionIndicate if registrant meets the emerging growth company criteria. Reference 1: http://www.xbrl.org/2003/role/presentationRef
-Publisher SEC
-Name Exchange Act
-Number 240
-Section 12
-Subsection b-2
| Name: |
dei_EntityEmergingGrowthCompany |
| Namespace Prefix: |
dei_ |
| Data Type: |
xbrli:booleanItemType |
| Balance Type: |
na |
| Period Type: |
duration |
|
| X |
- DefinitionCommission file number. The field allows up to 17 characters. The prefix may contain 1-3 digits, the sequence number may contain 1-8 digits, the optional suffix may contain 1-4 characters, and the fields are separated with a hyphen.
| Name: |
dei_EntityFileNumber |
| Namespace Prefix: |
dei_ |
| Data Type: |
dei:fileNumberItemType |
| Balance Type: |
na |
| Period Type: |
duration |
|
| X |
- DefinitionTwo-character EDGAR code representing the state or country of incorporation.
| Name: |
dei_EntityIncorporationStateCountryCode |
| Namespace Prefix: |
dei_ |
| Data Type: |
dei:edgarStateCountryItemType |
| Balance Type: |
na |
| Period Type: |
duration |
|
| X |
- DefinitionThe exact name of the entity filing the report as specified in its charter, which is required by forms filed with the SEC. Reference 1: http://www.xbrl.org/2003/role/presentationRef
-Publisher SEC
-Name Exchange Act
-Number 240
-Section 12
-Subsection b-2
| Name: |
dei_EntityRegistrantName |
| Namespace Prefix: |
dei_ |
| Data Type: |
xbrli:normalizedStringItemType |
| Balance Type: |
na |
| Period Type: |
duration |
|
| X |
- DefinitionThe Tax Identification Number (TIN), also known as an Employer Identification Number (EIN), is a unique 9-digit value assigned by the IRS. Reference 1: http://www.xbrl.org/2003/role/presentationRef
-Publisher SEC
-Name Exchange Act
-Number 240
-Section 12
-Subsection b-2
| Name: |
dei_EntityTaxIdentificationNumber |
| Namespace Prefix: |
dei_ |
| Data Type: |
dei:employerIdItemType |
| Balance Type: |
na |
| Period Type: |
duration |
|
| X |
- DefinitionLocal phone number for entity.
| Name: |
dei_LocalPhoneNumber |
| Namespace Prefix: |
dei_ |
| Data Type: |
xbrli:normalizedStringItemType |
| Balance Type: |
na |
| Period Type: |
duration |
|
| X |
- DefinitionBoolean flag that is true when the Form 8-K filing is intended to satisfy the filing obligation of the registrant as pre-commencement communications pursuant to Rule 13e-4(c) under the Exchange Act. Reference 1: http://www.xbrl.org/2003/role/presentationRef
-Publisher SEC
-Name Exchange Act
-Number 240
-Section 13e
-Subsection 4c
| Name: |
dei_PreCommencementIssuerTenderOffer |
| Namespace Prefix: |
dei_ |
| Data Type: |
xbrli:booleanItemType |
| Balance Type: |
na |
| Period Type: |
duration |
|
| X |
- DefinitionBoolean flag that is true when the Form 8-K filing is intended to satisfy the filing obligation of the registrant as pre-commencement communications pursuant to Rule 14d-2(b) under the Exchange Act. Reference 1: http://www.xbrl.org/2003/role/presentationRef
-Publisher SEC
-Name Exchange Act
-Number 240
-Section 14d
-Subsection 2b
| Name: |
dei_PreCommencementTenderOffer |
| Namespace Prefix: |
dei_ |
| Data Type: |
xbrli:booleanItemType |
| Balance Type: |
na |
| Period Type: |
duration |
|
| X |
- DefinitionTitle of a 12(b) registered security. Reference 1: http://www.xbrl.org/2003/role/presentationRef
-Publisher SEC
-Name Exchange Act
-Number 240
-Section 12
-Subsection b
| Name: |
dei_Security12bTitle |
| Namespace Prefix: |
dei_ |
| Data Type: |
dei:securityTitleItemType |
| Balance Type: |
na |
| Period Type: |
duration |
|
| X |
- DefinitionName of the Exchange on which a security is registered. Reference 1: http://www.xbrl.org/2003/role/presentationRef
-Publisher SEC
-Name Exchange Act
-Number 240
-Section 12
-Subsection d1-1
| Name: |
dei_SecurityExchangeName |
| Namespace Prefix: |
dei_ |
| Data Type: |
dei:edgarExchangeCodeItemType |
| Balance Type: |
na |
| Period Type: |
duration |
|
| X |
- DefinitionBoolean flag that is true when the Form 8-K filing is intended to satisfy the filing obligation of the registrant as soliciting material pursuant to Rule 14a-12 under the Exchange Act. Reference 1: http://www.xbrl.org/2003/role/presentationRef
-Publisher SEC
-Name Exchange Act
-Section 14a
-Number 240
-Subsection 12
| Name: |
dei_SolicitingMaterial |
| Namespace Prefix: |
dei_ |
| Data Type: |
xbrli:booleanItemType |
| Balance Type: |
na |
| Period Type: |
duration |
|
| X |
- DefinitionTrading symbol of an instrument as listed on an exchange.
| Name: |
dei_TradingSymbol |
| Namespace Prefix: |
dei_ |
| Data Type: |
dei:tradingSymbolItemType |
| Balance Type: |
na |
| Period Type: |
duration |
|
| X |
- DefinitionBoolean flag that is true when the Form 8-K filing is intended to satisfy the filing obligation of the registrant as written communications pursuant to Rule 425 under the Securities Act. Reference 1: http://www.xbrl.org/2003/role/presentationRef
-Publisher SEC
-Name Securities Act
-Number 230
-Section 425
| Name: |
dei_WrittenCommunications |
| Namespace Prefix: |
dei_ |
| Data Type: |
xbrli:booleanItemType |
| Balance Type: |
na |
| Period Type: |
duration |
|
Roku (NASDAQ:ROKU)
Historical Stock Chart
From Mar 2024 to Apr 2024

Roku (NASDAQ:ROKU)
Historical Stock Chart
From Apr 2023 to Apr 2024
