false000181141400018114142024-02-142024-02-14
UNITED STATES
SECURITIES AND EXCHANGE COMMISSION
Washington, D.C. 20549
FORM 8-K
CURRENT REPORT
Pursuant to Section 13 or 15(d) of the Securities Exchange Act of 1934
Date of Report (Date of earliest event reported): February 14, 2024
QuantumScape Corporation
(Exact name of registrant as specified in its charter)
|
|
|
Delaware |
001-39345 |
85-0796578 |
(State or other jurisdiction of incorporation) |
(Commission File Number) |
(IRS Employer Identification No.) |
|
|
|
1730 Technology Drive, San Jose, California |
|
95110 |
(Address of principal executive offices) |
|
(Zip Code) |
Registrant’s telephone number, including area code: (408) 452-2000
Not Applicable
(Former name or former address, if changed since last report)
Check the appropriate box below if the Form 8-K filing is intended to simultaneously satisfy the filing obligation of the registrant under any of the following provisions:
|
|
☐ |
Written communications pursuant to Rule 425 under the Securities Act (17 CFR 230.425) |
☐ |
Soliciting material pursuant to Rule 14a-12 under the Exchange Act (17 CFR 240.14a-12) |
☐ |
Pre-commencement communications pursuant to Rule 14d-2(b) under the Exchange Act (17 CFR 240.14d-2(b)) |
☐ |
Pre-commencement communications pursuant to Rule 13e-4(c) under the Exchange Act (17 CFR 240.13e-4(c)) |
Securities registered pursuant to Section 12(b) of the Act:
|
|
|
|
|
Title of each class |
|
Trading Symbol(s) |
|
Name of each exchange on which registered |
Class A common stock, par value $0.0001 per share |
|
QS |
|
The New York Stock Exchange |
Indicate by check mark whether the registrant is an emerging growth company as defined in Rule 405 of the Securities Act of 1933 (§ 230.405 of this chapter) or Rule 12b-2 of the Securities Exchange Act of 1934 (§ 240.12b-2 of this chapter).
Emerging growth company ☐
If an emerging growth company, indicate by check mark if the registrant has elected not to use the extended transition period for complying with any new or revised financial accounting standards provided pursuant to Section 13(a) of the Exchange Act. ☐
Item 2.02 Results of Operations and Financial Condition.
On February 14, 2024, QuantumScape Corporation (the “Company”) announced its business and financial results for its fiscal quarter and fiscal year ended December 31, 2023. A copy of the Company’s Shareholder Letter is furnished as Exhibit 99.1 to this Current Report on Form 8-K.
On February 14, 2024, the Company issued a press release announcing the release of its business and financial results. A copy of the press release is attached as Exhibit 99.2 to this Current Report on Form 8-K.
The information contained in this Item 2.02 and in the accompanying Exhibits 99.1 and 99.2 shall not be deemed “filed” for purposes of Section 18 of the Securities Exchange Act of 1934, as amended (the “Exchange Act”), or otherwise subject to the liabilities of that section, nor shall it be deemed incorporated by reference in any filing under the Securities Act of 1933, as amended, or the Exchange Act, regardless of any general incorporation language in such filing, unless expressly incorporated by specific reference in such filing.
Item 9.01 Financial Statements and Exhibits.
(d) Exhibits.
* Filed herewith.
SIGNATURES
Pursuant to the requirements of the Securities Exchange Act of 1934, the registrant has duly caused this report to be signed on its behalf by the undersigned thereunto duly authorized.
|
|
|
|
|
|
QUANTUMSCAPE CORPORATION |
|
|
|
|
Date: February 14, 2024 |
|
By: |
/s/ Kevin Hettrich |
|
|
|
Kevin Hettrich |
|
|
|
Chief Financial Officer (Principal Financial and Accounting Officer) |
Exhibit 99.1

Q4 FISCAL 2023
LETTER TO SHAREHOLDERS
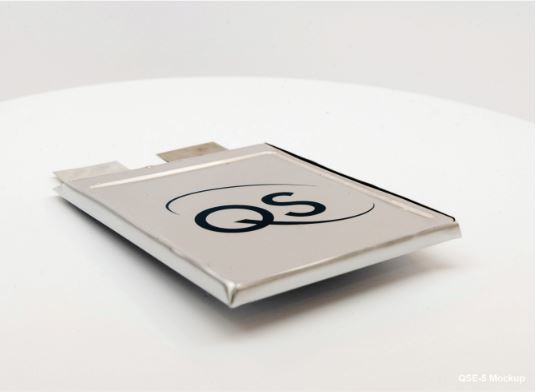
QSE-5 Mockup
FEBRUARY 14, 2023
Dear shareholders,
2023 marked the beginning of a transformational period for QuantumScape, starting with the shipment of our first A0 prototype cells in late 2022 and continuing in 2023 with the development and demonstration of the key component-level improvements needed to go from prototype to product: higher cathode loading, an efficient commercial packaging design, and an improved and more scalable separator process.
We expect our transformation to continue in 2024, culminating in the integration of these improvements into our target first commercial product, the QSE-5 cell. Our goal is to begin low volume QSE-5 prototype production in 2024, with higher volumes targeted in 2025. To facilitate this transformation and the subsequent industrialization of our solid-state lithium-metal technology, in 2023 we bolstered our balance sheet, engaged with some of the world’s largest automakers as prospective customers, and recruited top talent from across the battery and high-tech manufacturing industries, including our President, Dr. Siva Sivaram.
With that larger context in mind, we’d like to share some accomplishments from 2023, and lay our key goals for the year ahead.
2023 in Review: Key Accomplishments
We entered 2023 having just shipped our first A0 prototype cells to customers. The A0s were early prototypes intended to demonstrate the core capability of the technology, ahead of achieving the reliability and other characteristics expected of a commercial product. One of the customers that received A0 prototype cells was our longstanding partner, the Volkswagen Group, whose battery manufacturing arm PowerCo confirmed the results we reported in our Q3’23 Shareholder Letter — the best-performing cell achieved over 1,000 cycles with over 95% capacity retention.
These are very encouraging results that impressively underpin the potential of the solid-state cell. The final result of this development could be a battery cell that enables long ranges, can be charged super-quickly, and practically does not age. We are convinced of the solid-state cell and are continuing to work with our partner QuantumScape toward series production. — PowerCo CEO Frank Blome
In 2023, we focused on improving the key components of the A0 prototype cell required to go from prototype to product, including a better cathode with higher mass loading, improved separator films made via our new fast separator process, and more efficient packaging optimized for energy density.
With respect to cathode loading, we reported performance results from higher-loading cells in our Q1’23 Shareholder Letter. This increase in cathode loading, from ~3 mAh/cm2 to ~5 mAh/cm2, means our new cathodes offer ~60% more capacity per unit area. This improvement has been integrated into our baseline cell builds, representing a significant step toward achieving our target energy density for QSE-5.
Improved packaging efficiency is another key enabler of high energy density, and the packaging of QSE-5 is more efficient compared with our A0 prototype cells. In Q4, we finished integrating several packaging improvements, including tighter internal margins, thinner current collectors, and a slimmer frame design. For a more detailed look at these improvements, we recently released a deep-dive webinar and a series of educational blogs on our innovative FlexFrame cell format.

A comparison of the QSE-5 and A0 prototype cell packaging. The QSE-5 packaging is designed to be physically smaller than the A0 packaging even while storing more energy.
Another focus in 2023 was to improve production quality and consistency. With respect to reliability, we improved the quality of the interface between the cathode and separator, which we have determined is one of the major drivers of reliability. We reduced ambient and process-related particle contamination, improved the components and processes that go into cell assembly, and made advances across our entire production flow. These improvements allowed us to integrate the higher-loading cathodes and more efficient packaging into the Alpha-2 prototype cells we plan to ship this year (see 2024 Goals).
Our final goal was to introduce our new fast separator heat-treatment process. This goal is important because heat treatment is one of the most cost-intensive parts of ceramics processing and is often the main bottleneck in terms of throughput. This faster process also results in an improved separator, and we are rolling it out in two stages: Raptor, which was successfully deployed in Q4, and its successor, Cobra.
Manufacturing Process Roadmap: Raptor and Cobra
Raptor represents the first deployment of a disruptively faster separator heat treatment process. With respect to the heat processing step, Raptor is approximately eight times faster than our current-generation process, cutting the amount of energy needed per separator and increasing throughput: taking upstream and downstream processes into account, we expect it to provide up to three times as much production capacity as our current-gen process. Raptor also removes several other process steps entirely, eliminating material inputs that would otherwise introduce particle contamination. Raptor has already been deployed; note that certain pieces of automation for other steps in the process flow must still be qualified to enable the Raptor process to reach its full planned run rate.
When it reaches its full planned run rate, Raptor will be capable of more separator starts per week than the combined capacity of every previous generation of heat treatment equipment put together. Thanks to this step-change increase in productivity, Raptor is capable of providing enough separator films to enable low-volume QSE-5 production this year.
Cobra takes the core innovations of Raptor and adds three more improvements. First and foremost, the Cobra heat processing step is designed to be faster than Raptor by more than an order of magnitude, which dramatically improves throughput and energy efficiency. Second, the Cobra heat treatment equipment has a footprint an order of magnitude smaller than Raptor while also increasing production capacity, which saves space on the production floor and further improves the process economics. Third, the Cobra process consolidates or eliminates additional individual process steps from Raptor, which removes more potential sources of variability from the process, eases production bottlenecks and lowers cost.
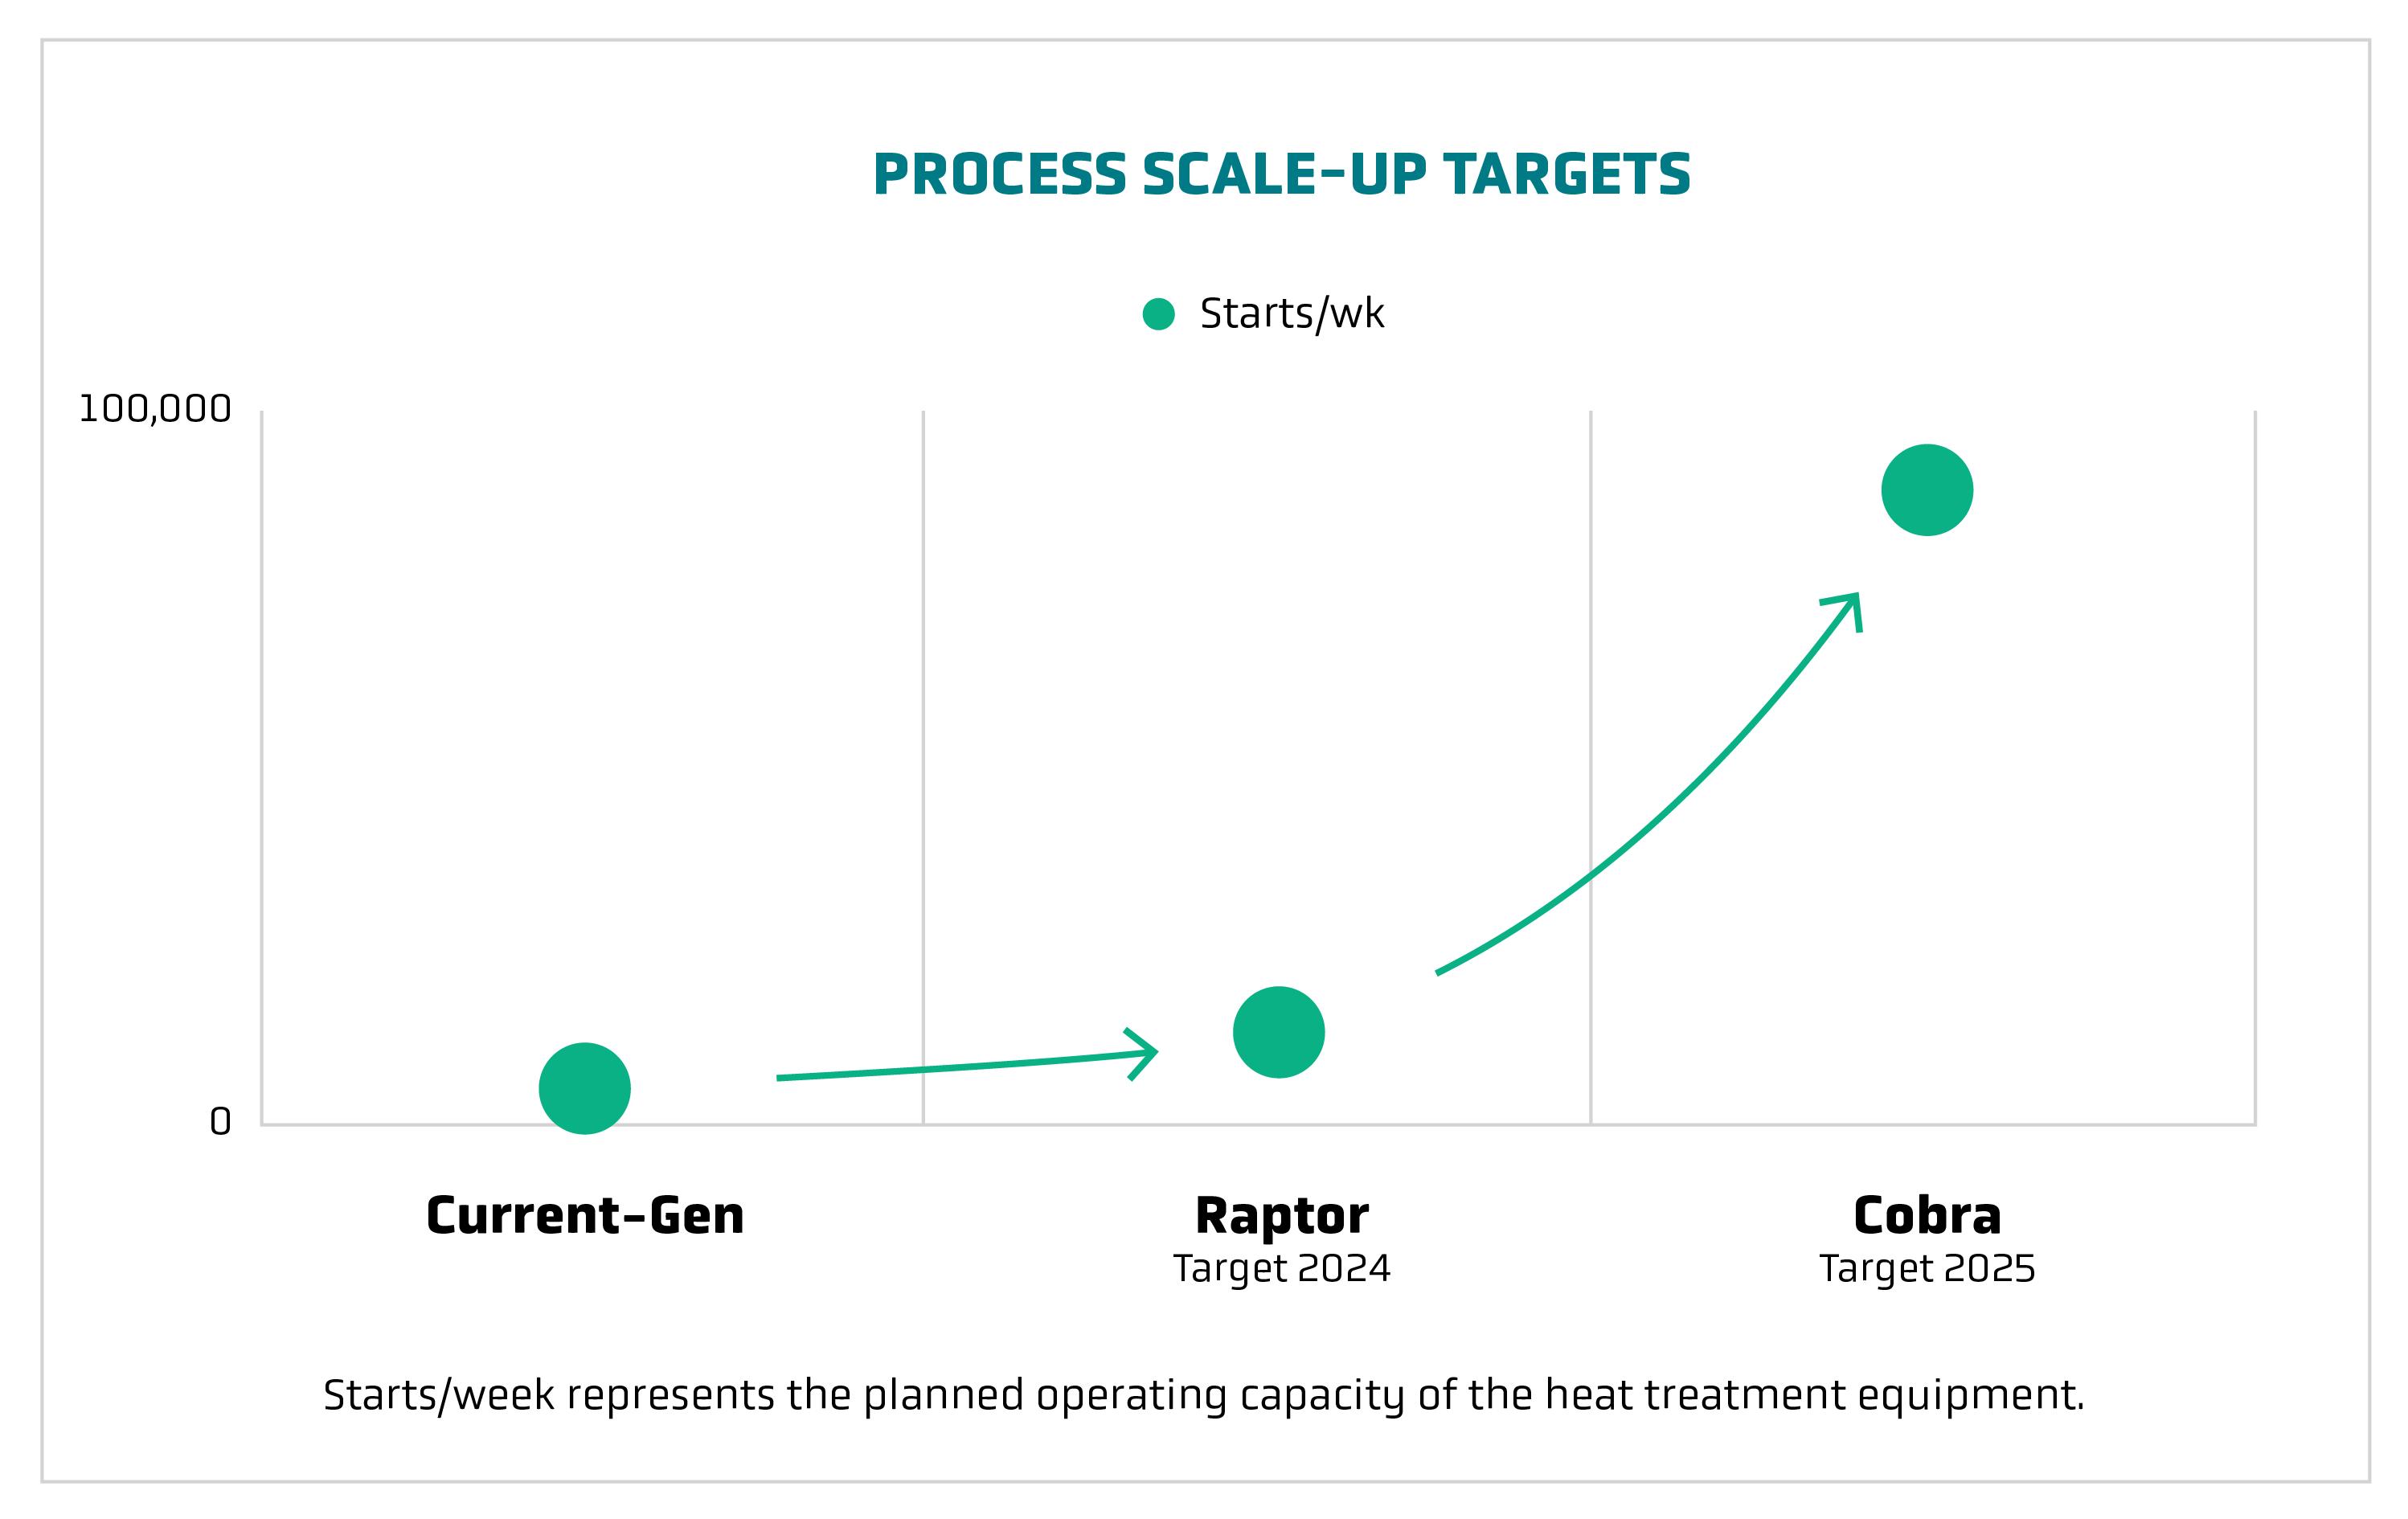
Capacity represents the planned operating capacity of the heat treatment equipment.
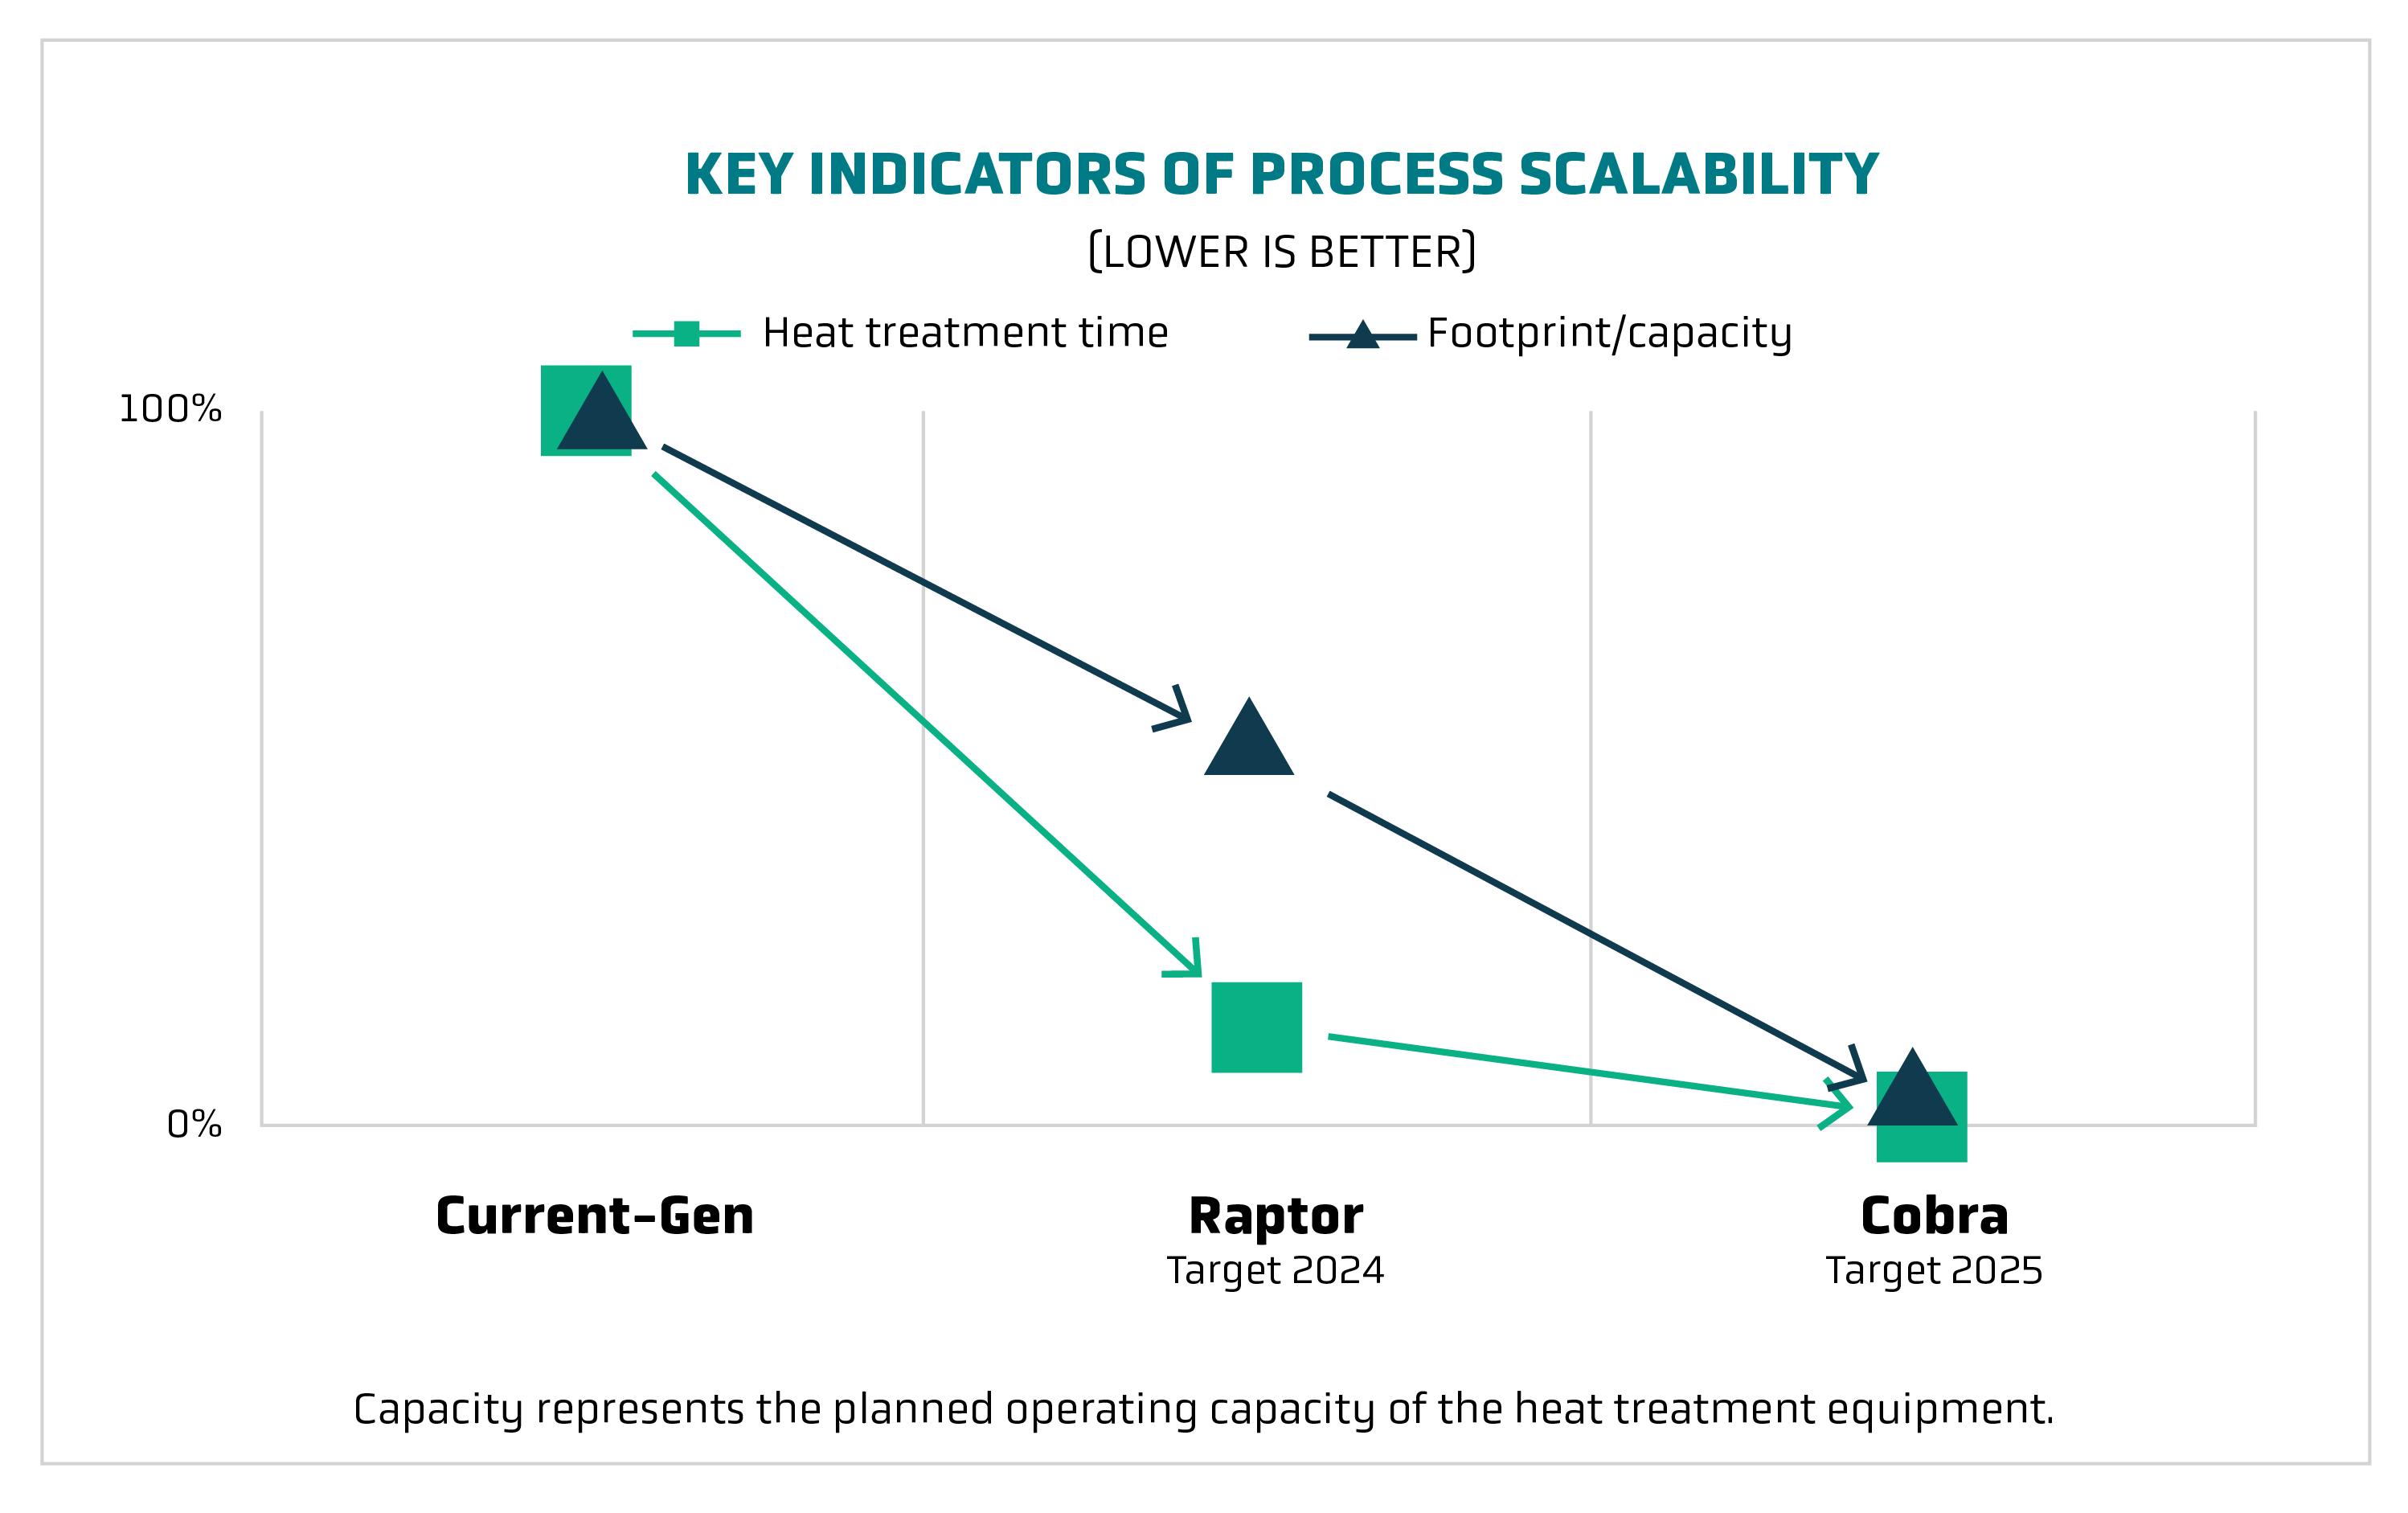
Capacity represents the planned operating capacity of the heat treatment equipment.
We believe these advantages make the Cobra process the most attractive pathway to gigawatt-hour scale production, though such volumes will require larger configurations of Cobra equipment. Bringing a disruptive improvement online presents a technical challenge, and significant work remains to develop a fully mature Cobra production process and we have prioritized bringing it online as quickly as possible.
Financial Outlook
Capital expenditures for the fourth quarter and full-year 2023 were $13.8M and $84.5M, respectively. Q4’23 capex included facilities investment and prototype equipment for our Cobra process. GAAP operating expenses were $124.6M in the fourth quarter and $479.0M for the full-year 2023. Cash operating expenses were $73.9M in the fourth quarter and $264.1M for the full-year 2023, consistent with our previous guidance.
In lieu of a cash operating expense metric, moving forward we will provide guidance on Adjusted EBITDA. Adjusted EBITDA is a similar measure we believe offers improved comparability with other companies. Included in our shareholder letter is a reconciliation of Adjusted EBITDA to GAAP net loss. Adjusted EBITDA was ($60.7M) in the fourth quarter and ($249.2M) for the full-year 2023.
For the full-year 2024, we expect capital expenditures to be between $70M and $120M. Priorities for 2024 capital expenditure include investment to support low volume QSE-5 prototype production, notably cell assembly and metrology as well as investments into the Cobra process as we prepare for higher volume QSE-5 production in 2025. For the full year 2024, we forecast Adjusted EBITDA to be between ($250M) and ($300M). Our 2024 guidance reflects efforts to maintain our commercialization timeline while conserving cash and extending our runway, primarily by focusing on process improvement. The result is an operating plan that increases QS-0 output while holding 2024 capex to similar levels as 2023.
We ended the year with $1.07B in liquidity, strongly positioning the company as we transition from prototype to product and prepare for subsequent industrialization. We continue to be prudent with our balance sheet and optimize spending. As a result of cost-saving initiatives and judicious planning, we now forecast our cash runway will extend into the second half of 2026, two quarters beyond our prior estimates. Any additional funds raised from capital markets activity, including under our ATM prospectus supplement, would further extend this cash runway.
Longer term, our capital requirements will be shaped by our industrialization business model, which we believe could reflect a mix of wholly owned production, joint venture, and licensing relationships. As always, we encourage investors to read more on our financial information, business outlook and risk factors in our quarterly and annual SEC filings on our investor relations website.
2024 Goals
In 2024, our key focus is to take the improvements we demonstrated at the component level in 2023 and integrate them into QSE-5, the ~5Ah cell that we are targeting as our first commercial product. We believe QSE-5 fills a unique, high-value segment of the EV battery market, by combining high energy density with high power. Our four annual goals for 2024 are all oriented toward accomplishing this overarching task.
Goal #1 – Ship Alpha-2 sample
Our first major goal for the year is to ship a round of samples, designated Alpha-2, which integrates the improved cathode and packaging we developed in 2023 into a multi-layer cell design. Alpha-2 is an important milestone in de-risking many of the key elements of integration and, when combined with Raptor films and other refinements and incorporated into a ~5Ah design, represents the core of QSE-5.
Goal #2 – Ramp Raptor process
In 2024, we plan to transition to Raptor production, going from initial deployment at the end of last year to its full planned run rate. To enable this transition, we must install and qualify upstream and downstream automation for Raptor. We expect it to provide up to three times the separator production capacity compared to our current-gen process, enabling low-volume QSE-5 prototype production this year.
Goal #3 – Begin low-volume QSE-5 prototype production
Our third goal for this year is to begin low-volume B0 prototype production of our first commercial cell, QSE-5. We define B0 prototypes as the near-final QSE-5 product design: a 24-layer cell integrating improved packaging efficiency and higher loading cathode, using films produced by our Raptor process. It’s important to note that final designation of a B-sample by an automotive OEM occurs only after extensive testing of candidate cells.
Goal #4 – Prepare for Cobra production in 2025
We are already operating prototype versions of Cobra heat-treatment equipment, and in light of the promising data from our prototype equipment and the significant advantages of Cobra as a pathway to gigawatt hour-scale production, we have prioritized bringing Cobra into production as soon as possible to support higher volumes of QSE-5 in 2025. Our goal for 2024 is to set the stage for Cobra by taking delivery of key pieces of Cobra equipment and preparing to bring them into production.
These goals are challenging and ambitious, and will require a focused effort on behalf of the entire team. We believe that achieving them will represent major progress along our industrialization roadmap.
Chairman’s Note
“Since our founding, our mission has been simple: revolutionize energy storage and enable a more sustainable future. Reflecting on this journey, we’ve made remarkable progress toward bringing our solid-state lithium-metal technology to market, from the single-layer pouch cells we first showcased in December 2020 all the way to our 24-layer A0 cells shipped in December 2022. These A0 cells have now yielded impressive cycle life performance, as reported by Volkswagen’s battery arm PowerCo based on testing in their own labs in Germany.
In 2023, we set out to turn these A0 prototypes into a commercial product, and with advances in cathode loading, packaging efficiency and process quality, we now have our first commercial product, QSE-5, in our sights. When it comes to the combination of customer engagement, financial strength, and product development, I believe our position is stronger than it’s ever been. When we begin shipping QSE-5, we believe it will mark a world first for automotive solid-state lithium-metal battery technology, representing the culmination of years of development on the part of the QuantumScape team, and further solidifying our leadership in the next-gen battery industry.
But starting low-volume production of our first product is not the end of the journey; it’s just the beginning. To truly fulfill the promise of our breakthrough technology, we will need to increase production by orders of magnitude from where we are today.
For that reason, early last year I set out to recruit a leader with extensive experience in high-volume manufacturing of sophisticated technology products. Such a candidate would need to have extensive experience bringing complex emerging technology into high-volume production, a proven track record of operational discipline, and an appreciation for the significance of QuantumScape’s mission and the scale of our ambition. I believe our company is closer than ever to having a profound impact on the automotive industry and the wider world while delivering exceptional returns for shareholders. I was looking for a leader who both shared that vision and had the tools to make it a reality.
|
|

|
I’m pleased to say we found the ideal candidate in Dr. Siva Sivaram. He has decades of experience taking groundbreaking technology products into high-volume production: building factories, establishing partnerships and scaling production across the world. Since coming on as President, Siva has impressed the team with his operational skills, strategic vision and ability to drive results, as well as his connections within the broader high-tech manufacturing industry. Most importantly, he fits in perfectly with the culture we’ve worked hard to build and the values we all hold: respect, curiosity, integrity, and passion to solve the problem of building a better battery. That’s why, as Chairman, I’m thrilled to announce that, with my recommendation, the board has agreed to appoint Dr. Siva Sivaram as Chief Executive Officer. I have total confidence that he is the right person to take on the challenge of bringing our transformational solid-state battery technology to market, driving this next phase of growth, fulfilling our mission of revolutionizing energy storage, and delivering exceptional returns for shareholders. There is no doubt in our minds that Siva is the right person at the right time to lead us on the next phase of our journey. We look forward to reporting on our progress over the years to come.” |
|
|
|

|

|

|
Jagdeep Singh
Founder, CEO & Chairman |
Dr. Siva Sivaram President |
Kevin Hettrich CFO |
QuantumScape Corporation
Consolidated Balance Sheets (Unaudited)
(In Thousands)
|
|
|
|
|
|
|
|
|
|
|
December 31, |
|
|
|
2023 |
|
|
2022 |
|
Assets |
|
|
|
|
|
|
Current assets |
|
|
|
|
|
|
Cash and cash equivalents ($3,522 and $3,395 as of December 31, 2023 and 2022, respectively, for joint venture) |
|
$ |
142,524 |
|
|
$ |
235,393 |
|
Marketable securities |
|
|
928,284 |
|
|
|
826,340 |
|
Prepaid expenses and other current assets |
|
|
12,709 |
|
|
|
10,591 |
|
Total current assets |
|
|
1,083,517 |
|
|
|
1,072,324 |
|
Property and equipment, net |
|
|
313,164 |
|
|
|
295,934 |
|
Right-of-use assets - finance lease |
|
|
25,140 |
|
|
|
28,013 |
|
Right-of-use assets - operating lease |
|
|
55,863 |
|
|
|
60,782 |
|
Other assets |
|
|
24,294 |
|
|
|
18,353 |
|
Total assets |
|
$ |
1,501,978 |
|
|
$ |
1,475,406 |
|
Liabilities, redeemable non-controlling interest and stockholders’ equity |
|
|
|
|
|
|
Current liabilities |
|
|
|
|
|
|
Accounts payable |
|
$ |
12,959 |
|
|
$ |
21,420 |
|
Accrued liabilities |
|
|
10,180 |
|
|
|
7,477 |
|
Accrued compensation and benefits |
|
|
26,043 |
|
|
|
13,061 |
|
Operating lease liability, short-term |
|
|
5,006 |
|
|
|
3,478 |
|
Finance lease liability, short-term |
|
|
2,907 |
|
|
|
1,373 |
|
Total current liabilities |
|
|
57,095 |
|
|
|
46,809 |
|
Operating lease liability, long-term |
|
|
57,622 |
|
|
|
62,560 |
|
Finance lease liability, long-term |
|
|
35,098 |
|
|
|
38,005 |
|
Other liabilities |
|
|
11,986 |
|
|
|
8,488 |
|
Total liabilities |
|
|
161,801 |
|
|
|
155,862 |
|
Redeemable non-controlling interest |
|
|
1,770 |
|
|
|
1,704 |
|
Stockholders’ equity |
|
|
|
|
|
|
Preferred stock |
|
|
— |
|
|
— |
|
Common stock |
|
|
49 |
|
|
|
44 |
|
Additional paid-in-capital |
|
|
4,221,892 |
|
|
|
3,771,181 |
|
Accumulated other comprehensive loss |
|
|
(2,877 |
) |
|
|
(17,873 |
) |
Accumulated deficit |
|
|
(2,880,657 |
) |
|
|
(2,435,512 |
) |
Total stockholders’ equity |
|
|
1,338,407 |
|
|
|
1,317,840 |
|
Total liabilities, redeemable non-controlling interest and stockholders’ equity |
|
$ |
1,501,978 |
|
|
$ |
1,475,406 |
|
QuantumScape Corporation
Consolidated Statements of Operations and Comprehensive Loss (Unaudited)
(In Thousands, Except per Share Amounts)
|
|
|
|
|
|
|
|
|
|
|
|
|
|
|
|
|
|
|
|
|
|
|
|
|
|
|
Three Months Ended December 31, |
|
|
Twelve Months Ended December 31, |
|
|
|
2023 |
|
|
2022 |
|
|
2021 |
|
|
2023 |
|
|
2022 |
|
|
2021 |
|
Operating expenses: |
|
|
|
|
|
|
|
|
|
|
|
|
|
|
|
|
|
|
Research and development |
|
$ |
96,397 |
|
|
$ |
83,375 |
|
|
$ |
46,788 |
|
|
$ |
347,945 |
|
|
$ |
297,435 |
|
|
$ |
151,496 |
|
General and administrative |
|
|
28,243 |
|
|
|
30,059 |
|
|
|
20,349 |
|
|
|
131,085 |
|
|
|
123,183 |
|
|
|
63,770 |
|
Total operating expenses |
|
|
124,640 |
|
|
|
113,434 |
|
|
|
67,137 |
|
|
|
479,030 |
|
|
|
420,618 |
|
|
|
215,266 |
|
Loss from operations |
|
|
(124,640 |
) |
|
|
(113,434 |
) |
|
|
(67,137 |
) |
|
|
(479,030 |
) |
|
|
(420,618 |
) |
|
|
(215,266 |
) |
Other income (loss): |
|
|
|
|
|
|
|
|
|
|
|
|
|
|
|
|
|
|
Interest expense |
|
|
(582 |
) |
|
|
(592 |
) |
|
|
(822 |
) |
|
|
(2,377 |
) |
|
|
(2,399 |
) |
|
|
(1,419 |
) |
Interest income |
|
|
12,413 |
|
|
|
5,092 |
|
|
|
682 |
|
|
|
36,488 |
|
|
|
10,905 |
|
|
|
1,883 |
|
Change in fair value of assumed common stock warrant liabilities |
|
|
— |
|
|
|
— |
|
|
|
— |
|
|
|
— |
|
|
|
— |
|
|
|
168,674 |
|
Other income (loss) |
|
|
(530 |
) |
|
|
(119 |
) |
|
|
50 |
|
|
|
(160 |
) |
|
|
216 |
|
|
|
151 |
|
Total other income (loss) |
|
|
11,301 |
|
|
|
4,381 |
|
|
|
(90 |
) |
|
|
33,951 |
|
|
|
8,722 |
|
|
|
169,289 |
|
Net loss |
|
|
(113,339 |
) |
|
|
(109,053 |
) |
|
|
(67,227 |
) |
|
|
(445,079 |
) |
|
|
(411,896 |
) |
|
|
(45,977 |
) |
Less: Net income (loss) attributable to non-controlling interest, net of tax of $0 |
|
|
21 |
|
|
|
13 |
|
|
|
(1 |
) |
|
|
66 |
|
|
|
11 |
|
|
|
(11 |
) |
Net loss attributable to common stockholders |
|
$ |
(113,360 |
) |
|
$ |
(109,066 |
) |
|
$ |
(67,226 |
) |
|
$ |
(445,145 |
) |
|
$ |
(411,907 |
) |
|
$ |
(45,966 |
) |
Net loss |
|
$ |
(113,339 |
) |
|
$ |
(109,053 |
) |
|
$ |
(67,227 |
) |
|
$ |
(445,079 |
) |
|
$ |
(411,896 |
) |
|
$ |
(45,977 |
) |
Other comprehensive income (loss): |
|
|
|
|
|
|
|
|
|
|
|
|
|
|
|
|
|
|
Unrealized income (loss) on marketable securities |
|
|
3,446 |
|
|
|
4,205 |
|
|
|
(3,579 |
) |
|
|
14,996 |
|
|
|
(13,665 |
) |
|
|
(4,177 |
) |
Total comprehensive loss |
|
|
(109,893 |
) |
|
|
(104,848 |
) |
|
|
(70,806 |
) |
|
|
(430,083 |
) |
|
|
(425,561 |
) |
|
|
(50,154 |
) |
Less: Comprehensive income (loss) attributable to non-controlling interest |
|
|
21 |
|
|
|
13 |
|
|
|
(1 |
) |
|
|
66 |
|
|
|
11 |
|
|
|
(11 |
) |
Comprehensive loss attributable to common stockholders |
|
$ |
(109,914 |
) |
|
$ |
(104,861 |
) |
|
$ |
(70,805 |
) |
|
$ |
(430,149 |
) |
|
$ |
(425,572 |
) |
|
$ |
(50,143 |
) |
|
|
|
|
|
|
|
|
|
|
|
|
|
|
|
|
|
|
|
Net loss per share of common stock attributable to common stockholders |
|
|
|
|
|
|
|
|
|
|
|
|
|
|
|
|
|
|
Basic |
|
$ |
(0.23 |
) |
|
$ |
(0.25 |
) |
|
$ |
(0.16 |
) |
|
$ |
(0.96 |
) |
|
$ |
(0.95 |
) |
|
$ |
(0.11 |
) |
Diluted |
|
$ |
(0.23 |
) |
|
$ |
(0.25 |
) |
|
$ |
(0.16 |
) |
|
$ |
(0.96 |
) |
|
$ |
(0.95 |
) |
|
$ |
(0.52 |
) |
Weighted-average shares used in computing net loss per share of common stock |
|
|
|
|
|
|
|
|
|
|
|
|
|
|
|
|
|
|
Basic |
|
|
491,129 |
|
|
|
436,888 |
|
|
|
424,704 |
|
|
|
462,239 |
|
|
|
432,973 |
|
|
|
404,259 |
|
Diluted |
|
|
491,129 |
|
|
|
436,888 |
|
|
|
424,704 |
|
|
|
462,239 |
|
|
|
432,973 |
|
|
|
409,509 |
|
QuantumScape Corporation
Consolidated Statements of Cash Flows (Unaudited)
(In Thousands)
|
|
|
|
|
|
|
|
|
|
|
|
|
|
|
|
|
|
|
|
|
|
|
|
|
|
|
Three Months Ended December 31, |
|
|
Twelve Months Ended December 31, |
|
|
|
2023 |
|
|
2022 |
|
|
2021 |
|
|
2023 |
|
|
2022 |
|
|
2021 |
|
Operating activities |
|
|
|
|
|
|
|
|
|
|
|
|
|
|
|
|
|
|
Net loss |
|
$ |
(113,339 |
) |
|
$ |
(109,053 |
) |
|
$ |
(67,227 |
) |
|
$ |
(445,079 |
) |
|
$ |
(411,896 |
) |
|
$ |
(45,977 |
) |
Adjustments to reconcile net loss to net cash used in operating activities: |
|
|
|
|
|
|
|
|
|
|
|
|
|
|
|
|
|
|
Depreciation and amortization |
|
|
10,781 |
|
|
|
9,305 |
|
|
|
3,575 |
|
|
|
41,958 |
|
|
|
28,280 |
|
|
|
11,207 |
|
Amortization of right-of-use assets and non-cash lease expense |
|
|
1,966 |
|
|
|
2,172 |
|
|
|
902 |
|
|
|
7,791 |
|
|
|
7,843 |
|
|
|
3,492 |
|
Amortization of premiums and accretion of discounts on marketable securities |
|
|
(8,053 |
) |
|
|
(515 |
) |
|
|
2,790 |
|
|
|
(18,908 |
) |
|
|
3,989 |
|
|
|
11,845 |
|
Stock-based compensation expense |
|
|
37,924 |
|
|
|
34,125 |
|
|
|
16,165 |
|
|
|
166,297 |
|
|
|
127,110 |
|
|
|
52,175 |
|
Change in fair value of assumed common stock warrant liabilities |
|
|
— |
|
|
|
— |
|
|
|
— |
|
|
|
— |
|
|
|
— |
|
|
|
(168,674 |
) |
Write-off of property and equipment |
|
|
15,186 |
|
|
|
5,889 |
|
|
|
— |
|
|
|
21,528 |
|
|
|
13,695 |
|
|
|
— |
|
Other |
|
|
(5 |
) |
|
|
366 |
|
|
|
675 |
|
|
|
469 |
|
|
|
840 |
|
|
|
899 |
|
Changes in operating assets and liabilities: |
|
|
|
|
|
|
|
|
|
|
|
|
|
|
|
|
|
|
Prepaid expenses and other assets |
|
|
(3,548 |
) |
|
|
(345 |
) |
|
|
(7,271 |
) |
|
|
(7,533 |
) |
|
|
5,048 |
|
|
|
(4,852 |
) |
Accounts payable, accrued liabilities and accrued compensation |
|
|
2,640 |
|
|
|
(3,905 |
) |
|
|
5,817 |
|
|
|
(2,904 |
) |
|
|
5,611 |
|
|
|
13,178 |
|
Other long-term liabilities |
|
|
114 |
|
|
|
200 |
|
|
|
— |
|
|
|
(234 |
) |
|
|
2,300 |
|
|
|
— |
|
Operating lease liability |
|
|
(1,140 |
) |
|
|
(1,155 |
) |
|
|
(34 |
) |
|
|
(3,410 |
) |
|
|
(844 |
) |
|
|
(1,202 |
) |
Net cash used in operating activities |
|
|
(57,474 |
) |
|
|
(62,916 |
) |
|
|
(44,608 |
) |
|
|
(240,025 |
) |
|
|
(218,024 |
) |
|
|
(127,909 |
) |
Investing activities |
|
|
|
|
|
|
|
|
|
|
|
|
|
|
|
|
|
|
Purchases of property and equipment |
|
|
(13,802 |
) |
|
|
(37,841 |
) |
|
|
(44,782 |
) |
|
|
(84,510 |
) |
|
|
(158,845 |
) |
|
|
(127,178 |
) |
Proceeds from maturities of marketable securities |
|
|
339,400 |
|
|
|
203,020 |
|
|
|
283,220 |
|
|
|
1,041,528 |
|
|
|
837,410 |
|
|
|
894,225 |
|
Proceeds from sales of marketable securities |
|
|
— |
|
|
|
— |
|
|
|
51,765 |
|
|
|
1,477 |
|
|
|
15,105 |
|
|
|
224,058 |
|
Purchases of marketable securities |
|
|
(379,566 |
) |
|
|
(167,304 |
) |
|
|
(270,772 |
) |
|
|
(1,111,027 |
) |
|
|
(569,551 |
) |
|
|
(1,376,939 |
) |
Net cash (used in) provided by investing activities |
|
|
(53,968 |
) |
|
|
(2,125 |
) |
|
|
19,431 |
|
|
|
(152,532 |
) |
|
|
124,119 |
|
|
|
(385,834 |
) |
Financing activities |
|
|
|
|
|
|
|
|
|
|
|
|
|
|
|
|
|
|
Proceeds from exercise of stock options and employee stock purchase plan |
|
|
4,092 |
|
|
|
2,473 |
|
|
|
6,447 |
|
|
|
14,022 |
|
|
|
9,407 |
|
|
|
17,779 |
|
Proceeds from exercise of warrants |
|
|
— |
|
|
|
— |
|
|
|
— |
|
|
|
— |
|
|
|
— |
|
|
|
151,431 |
|
Proceeds from issuance of common stock, net of issuance costs paid |
|
|
(267 |
) |
|
|
— |
|
|
|
— |
|
|
|
288,164 |
|
|
|
— |
|
|
|
462,926 |
|
Proceeds from issuance of Class A Common Stock pursuant to Legacy QuantumScape Series F Preferred Stock Purchase Agreement, net of issuance costs |
|
|
— |
|
|
|
— |
|
|
|
— |
|
|
|
— |
|
|
|
— |
|
|
|
99,930 |
|
Business Combination, net of issuance costs paid |
|
|
— |
|
|
|
— |
|
|
|
— |
|
|
|
— |
|
|
|
— |
|
|
|
(1,016 |
) |
Principal payment for finance lease |
|
|
(683 |
) |
|
|
— |
|
|
|
297 |
|
|
|
(1,973 |
) |
|
|
(809 |
) |
|
|
5,507 |
|
Net cash provided by financing activities |
|
|
3,142 |
|
|
|
2,473 |
|
|
|
6,744 |
|
|
|
300,213 |
|
|
|
8,598 |
|
|
|
736,557 |
|
Net increase (decrease) in cash, cash equivalents and restricted cash |
|
|
(108,300 |
) |
|
|
(62,568 |
) |
|
|
(18,433 |
) |
|
|
(92,344 |
) |
|
|
(85,307 |
) |
|
|
222,814 |
|
Cash, cash equivalents and restricted cash at beginning of period |
|
|
268,872 |
|
|
|
315,484 |
|
|
|
356,656 |
|
|
|
252,916 |
|
|
|
338,223 |
|
|
|
115,409 |
|
Cash, cash equivalents and restricted cash at end of period |
|
$ |
160,572 |
|
|
$ |
252,916 |
|
|
$ |
338,223 |
|
|
$ |
160,572 |
|
|
$ |
252,916 |
|
|
$ |
338,223 |
|
Supplemental disclosure of cash flow information |
|
|
|
|
|
|
|
|
|
|
|
|
|
|
|
|
|
|
Cash paid for interest |
|
$ |
583 |
|
|
$ |
403 |
|
|
$ |
92 |
|
|
$ |
1,778 |
|
|
$ |
1,610 |
|
|
$ |
330 |
|
Fair value of assumed common stock warrants exercised |
|
$ |
— |
|
|
$ |
— |
|
|
$ |
— |
|
|
$ |
— |
|
|
$ |
— |
|
|
$ |
521,025 |
|
Purchases of property and equipment, not yet paid |
|
$ |
10,554 |
|
|
$ |
18,192 |
|
|
$ |
11,073 |
|
|
$ |
10,554 |
|
|
$ |
18,192 |
|
|
$ |
11,073 |
|
Net Loss to Adjusted EBITDA
Adjusted EBITDA is a non-GAAP supplemental measure of operating performance that does not represent and should not be considered an alternative to operating loss or cash flow from operations, as determined by GAAP. Adjusted EBITDA is defined as net income (loss) before interest expense, non-controlling interest, revaluations, impairments, stock-based compensation and depreciation and amortization expense. We use Adjusted EBITDA to measure the operating performance of our business, excluding specifically identified items that we do not believe directly reflect our core operations and may not be indicative of our recurring operations. Adjusted EBITDA may not be comparable to similarly titled measures provided by other companies due to potential differences in methods of calculations. A reconciliation of Adjusted EBITDA to net loss is as follows:
|
|
|
|
|
|
|
|
|
|
|
|
|
|
|
|
|
|
|
|
|
|
|
|
|
($ in Thousands)
(unaudited) |
|
Three Months Ended
December 31, |
|
|
Twelve Months Ended
December 31, |
|
|
|
2023 |
|
|
2022 |
|
|
2021 |
|
|
2023 |
|
|
2022 |
|
|
2021 |
|
GAAP net income (loss) attributable to Common Stockholders |
|
$ |
(113,360 |
) |
|
$ |
(109,066 |
) |
|
$ |
(67,226 |
) |
|
$ |
(445,145 |
) |
|
$ |
(411,907 |
) |
|
$ |
(45,966 |
) |
Interest expense (income), net |
|
|
(11,831 |
) |
|
|
(4,500 |
) |
|
|
140 |
|
|
|
(34,111 |
) |
|
|
(8,506 |
) |
|
|
(464 |
) |
Other expense (income), net |
|
|
530 |
|
|
|
119 |
|
|
|
(50 |
) |
|
|
160 |
|
|
|
(216 |
) |
|
|
(151 |
) |
Change in fair value of assumed common stock warrant liabilities |
|
|
— |
|
|
|
— |
|
|
|
— |
|
|
|
— |
|
|
|
— |
|
|
|
(168,674 |
) |
Net gain (loss) attributable to non-controlling interests |
|
|
21 |
|
|
|
13 |
|
|
|
(1 |
) |
|
|
66 |
|
|
|
11 |
|
|
|
(11 |
) |
Stock-based compensation |
|
|
37,924 |
|
|
|
34,125 |
|
|
|
16,165 |
|
|
|
166,297 |
|
|
|
127,110 |
|
|
|
52,175 |
|
Impairment of fixed assets and cancellation charges |
|
|
— |
|
|
|
5,203 |
|
|
|
— |
|
|
|
— |
|
|
|
16,457 |
|
|
|
— |
|
Non-GAAP operating loss |
|
$ |
(86,716 |
) |
|
$ |
(74,106 |
) |
|
$ |
(50,972 |
) |
|
$ |
(312,733 |
) |
|
$ |
(277,051 |
) |
|
$ |
(163,091 |
) |
Depreciation and amortization expense (1) |
|
|
25,967 |
|
|
|
9,305 |
|
|
|
3,575 |
|
|
|
63,486 |
|
|
|
28,280 |
|
|
|
11,207 |
|
Adjusted EBITDA |
|
$ |
(60,749 |
) |
|
$ |
(64,801 |
) |
|
$ |
(47,397 |
) |
|
$ |
(249,247 |
) |
|
$ |
(248,771 |
) |
|
$ |
(151,884 |
) |
|
|
(1) |
Includes accelerated depreciation and write-off of property and equipment no longer in use of approximately $15.2 million and $21.5 million for the three and twelve months ended December 31, 2023, respectively. |
Management’s Use of Non-GAAP Financial Measures
This letter includes certain non-GAAP financial measures as defined by SEC rules. These non-GAAP financial measures are in addition to, and not a substitute for or superior to, measures of financial performance prepared in accordance with U.S. GAAP. There are a number of limitations related to the use of these non-GAAP financial measures versus their nearest GAAP equivalents. For example, other companies may calculate non-GAAP financial measures differently or may use other measures to evaluate their performance, all of which could reduce the usefulness of our non-GAAP financial measures as tools for comparison. We urge you to review the reconciliations of our non-GAAP financial measures to the most directly comparable U.S. GAAP financial measures set forth in this letter, and not to rely on any single financial measure to evaluate our business.
Forward-Looking Statements
This letter contains forward-looking statements within the meaning of the federal securities laws and information based on management’s current expectations as of the date of this letter. All statements other than statements of historical fact contained in this letter, including statements regarding the future development of the Company’s battery technology, the anticipated benefits of the Company's technologies and the performance of its batteries, plans and objectives for future operations, forecasted cash usage, including spending and investment, are forward-looking statements. When used in this letter, the words “may,” “will,” ”can,” “estimate,” “aim,” “pro forma,” “expect,” “plan,” “believe,” “focus,” “potential,” “predict,” “target,” “should,” “would,” “could,” “continue,” “project,” “intend,” “anticipates,” “reiterate,” “seek,” “working toward,” “progress toward,” “prospective” the negative of such terms and other similar expressions are intended to identify forward-looking statements, although not all forward-looking statements contain such identifying words. These forward-looking statements are based on management’s current expectations, assumptions, hopes, beliefs, intentions, and strategies regarding future events and are based on currently available information as to the outcome and timing of future events.
These forward-looking statements involve significant risks and uncertainties that could cause the actual results to differ materially from the expected results. Many of these factors are outside the Company’s control and are difficult to predict. Factors that may cause such differences include but are not limited to ones listed here. The Company faces significant challenges in its attempts to scale up a solid-state battery cell and produce it at high volumes and may not be able to successfully develop its solid-state battery cell or build high volumes of multilayer cells for commercialization. The Company could encounter significant delays and/or technical challenges in replicating and scaling up the performance seen in its single-layer and early multilayer cells, in achieving the high quality, consistency, reliability, safety, cost, and throughput required for commercial production and sale (e.g., unanticipated contamination issues), and in developing a cell architecture that meets all the technical requirements. The Company has encountered delays and other obstacles in acquiring, installing and operating new manufacturing equipment for automated and/or continuous-flow processes, including vendor delays and other supply chain disruptions and challenges in optimizing its complex manufacturing processes. The Company may encounter delays and cost overruns in hiring and retaining the engineers it needs to expand its development and production efforts, including as a result of management changes, delays in building out or scaling up QS-0, and delays in establishing supply relationships for necessary materials, components or equipment. Delays in increasing production of engineering samples have slowed the Company’s development efforts in the past. These or other sources of delay could impact our delivery of A-samples and B-samples and delay or prevent successful commercialization of our products. Delays or difficulties in meeting technical milestones or scaling up QS-0 could cause prospective customers and joint venture partners not to purchase cells from our pre-production line or not to proceed with a manufacturing joint venture. The Company may be unable to adequately control the costs associated with its operations and the components necessary to build its solid-state battery cells at competitive prices. The Company’s spending may be higher than currently anticipated. The Company may encounter difficulties, including due to challenges related to the management transition, the building out of high-volume processes, the achievement of the quality, consistency, reliability, safety, cost and throughput required for commercial production and sale, changes in economic and financial conditions, and not be successful in competing in the battery market industry or establishing and maintaining confidence in its long-term business prospects among current and future partners and customers. The Company is at an early stage of testing its battery technology for use in consumer electronics applications, and we may discover technical or other hurdles that impede our ability to serve that market. The Company cautions that the foregoing list of factors is not exclusive. The Company cautions readers not to place undue reliance upon any forward-looking statements, which speak only as of the date made.
Except as otherwise required by applicable law, the Company disclaims any duty to update any forward-looking statements. Should underlying assumptions prove incorrect, actual results and projections could differ materially from those expressed in any forward-looking statements. Additional information concerning these and other factors that could materially affect the Company’s actual results can be found in the Company’s periodic filings with the SEC. The Company’s SEC filings are available publicly on the SEC’s website at www.sec.gov.
Exhibit 99.2

QuantumScape Reports Fourth Quarter 2023 Business and Financial Results
SAN JOSE, Calif. – February 14, 2024 – QuantumScape Corporation (NYSE: QS), a leader in developing next-generation solid-state lithium-metal batteries, today announced its business and financial results for the fourth quarter of 2023, which ended December 31.
The company posted a letter to shareholders on its Investor Relations website, ir.quantumscape.com, that details fourth-quarter financial results and provides a business update.
QuantumScape will host a live webcast today at 2 p.m. Pacific Time (5 p.m. Eastern Time), accessible via its IR Events page. Jagdeep Singh, co-founder and chief executive officer, Kevin Hettrich, chief financial officer, and Dr. Siva Sivaram, president, will participate on the call.
An archive of the webcast will be available shortly after the call for 12 months.
About QuantumScape Corporation
QuantumScape is on a mission to transform energy storage with solid-state lithium-metal battery technology. The company’s next-generation batteries are designed to enable greater energy density, faster charging and enhanced safety to support the transition away from legacy energy sources toward a lower carbon future. For more information, visit www.quantumscape.com.
For Investors
ir@quantumscape.com
For Media
media@quantumscape.com
v3.24.0.1
| X |
- DefinitionBoolean flag that is true when the XBRL content amends previously-filed or accepted submission.
| Name: |
dei_AmendmentFlag |
| Namespace Prefix: |
dei_ |
| Data Type: |
xbrli:booleanItemType |
| Balance Type: |
na |
| Period Type: |
duration |
|
| X |
- DefinitionFor the EDGAR submission types of Form 8-K: the date of the report, the date of the earliest event reported; for the EDGAR submission types of Form N-1A: the filing date; for all other submission types: the end of the reporting or transition period. The format of the date is YYYY-MM-DD.
| Name: |
dei_DocumentPeriodEndDate |
| Namespace Prefix: |
dei_ |
| Data Type: |
xbrli:dateItemType |
| Balance Type: |
na |
| Period Type: |
duration |
|
| X |
- DefinitionThe type of document being provided (such as 10-K, 10-Q, 485BPOS, etc). The document type is limited to the same value as the supporting SEC submission type, or the word 'Other'.
| Name: |
dei_DocumentType |
| Namespace Prefix: |
dei_ |
| Data Type: |
dei:submissionTypeItemType |
| Balance Type: |
na |
| Period Type: |
duration |
|
| X |
- DefinitionAddress Line 1 such as Attn, Building Name, Street Name
| Name: |
dei_EntityAddressAddressLine1 |
| Namespace Prefix: |
dei_ |
| Data Type: |
xbrli:normalizedStringItemType |
| Balance Type: |
na |
| Period Type: |
duration |
|
| X |
- Definition
+ References
+ Details
| Name: |
dei_EntityAddressCityOrTown |
| Namespace Prefix: |
dei_ |
| Data Type: |
xbrli:normalizedStringItemType |
| Balance Type: |
na |
| Period Type: |
duration |
|
| X |
- DefinitionCode for the postal or zip code
| Name: |
dei_EntityAddressPostalZipCode |
| Namespace Prefix: |
dei_ |
| Data Type: |
xbrli:normalizedStringItemType |
| Balance Type: |
na |
| Period Type: |
duration |
|
| X |
- DefinitionName of the state or province.
| Name: |
dei_EntityAddressStateOrProvince |
| Namespace Prefix: |
dei_ |
| Data Type: |
dei:stateOrProvinceItemType |
| Balance Type: |
na |
| Period Type: |
duration |
|
| X |
- DefinitionA unique 10-digit SEC-issued value to identify entities that have filed disclosures with the SEC. It is commonly abbreviated as CIK. Reference 1: http://www.xbrl.org/2003/role/presentationRef
-Publisher SEC
-Name Exchange Act
-Number 240
-Section 12
-Subsection b-2
| Name: |
dei_EntityCentralIndexKey |
| Namespace Prefix: |
dei_ |
| Data Type: |
dei:centralIndexKeyItemType |
| Balance Type: |
na |
| Period Type: |
duration |
|
| X |
- DefinitionIndicate if registrant meets the emerging growth company criteria. Reference 1: http://www.xbrl.org/2003/role/presentationRef
-Publisher SEC
-Name Exchange Act
-Number 240
-Section 12
-Subsection b-2
| Name: |
dei_EntityEmergingGrowthCompany |
| Namespace Prefix: |
dei_ |
| Data Type: |
xbrli:booleanItemType |
| Balance Type: |
na |
| Period Type: |
duration |
|
| X |
- DefinitionCommission file number. The field allows up to 17 characters. The prefix may contain 1-3 digits, the sequence number may contain 1-8 digits, the optional suffix may contain 1-4 characters, and the fields are separated with a hyphen.
| Name: |
dei_EntityFileNumber |
| Namespace Prefix: |
dei_ |
| Data Type: |
dei:fileNumberItemType |
| Balance Type: |
na |
| Period Type: |
duration |
|
| X |
- DefinitionTwo-character EDGAR code representing the state or country of incorporation.
| Name: |
dei_EntityIncorporationStateCountryCode |
| Namespace Prefix: |
dei_ |
| Data Type: |
dei:edgarStateCountryItemType |
| Balance Type: |
na |
| Period Type: |
duration |
|
| X |
- DefinitionThe exact name of the entity filing the report as specified in its charter, which is required by forms filed with the SEC. Reference 1: http://www.xbrl.org/2003/role/presentationRef
-Publisher SEC
-Name Exchange Act
-Number 240
-Section 12
-Subsection b-2
| Name: |
dei_EntityRegistrantName |
| Namespace Prefix: |
dei_ |
| Data Type: |
xbrli:normalizedStringItemType |
| Balance Type: |
na |
| Period Type: |
duration |
|
| X |
- DefinitionThe Tax Identification Number (TIN), also known as an Employer Identification Number (EIN), is a unique 9-digit value assigned by the IRS. Reference 1: http://www.xbrl.org/2003/role/presentationRef
-Publisher SEC
-Name Exchange Act
-Number 240
-Section 12
-Subsection b-2
| Name: |
dei_EntityTaxIdentificationNumber |
| Namespace Prefix: |
dei_ |
| Data Type: |
dei:employerIdItemType |
| Balance Type: |
na |
| Period Type: |
duration |
|
| X |
- DefinitionLocal phone number for entity.
| Name: |
dei_LocalPhoneNumber |
| Namespace Prefix: |
dei_ |
| Data Type: |
xbrli:normalizedStringItemType |
| Balance Type: |
na |
| Period Type: |
duration |
|
| X |
- DefinitionBoolean flag that is true when the Form 8-K filing is intended to satisfy the filing obligation of the registrant as pre-commencement communications pursuant to Rule 13e-4(c) under the Exchange Act. Reference 1: http://www.xbrl.org/2003/role/presentationRef
-Publisher SEC
-Name Exchange Act
-Number 240
-Section 13e
-Subsection 4c
| Name: |
dei_PreCommencementIssuerTenderOffer |
| Namespace Prefix: |
dei_ |
| Data Type: |
xbrli:booleanItemType |
| Balance Type: |
na |
| Period Type: |
duration |
|
| X |
- DefinitionBoolean flag that is true when the Form 8-K filing is intended to satisfy the filing obligation of the registrant as pre-commencement communications pursuant to Rule 14d-2(b) under the Exchange Act. Reference 1: http://www.xbrl.org/2003/role/presentationRef
-Publisher SEC
-Name Exchange Act
-Number 240
-Section 14d
-Subsection 2b
| Name: |
dei_PreCommencementTenderOffer |
| Namespace Prefix: |
dei_ |
| Data Type: |
xbrli:booleanItemType |
| Balance Type: |
na |
| Period Type: |
duration |
|
| X |
- DefinitionTitle of a 12(b) registered security. Reference 1: http://www.xbrl.org/2003/role/presentationRef
-Publisher SEC
-Name Exchange Act
-Number 240
-Section 12
-Subsection b
| Name: |
dei_Security12bTitle |
| Namespace Prefix: |
dei_ |
| Data Type: |
dei:securityTitleItemType |
| Balance Type: |
na |
| Period Type: |
duration |
|
| X |
- DefinitionName of the Exchange on which a security is registered. Reference 1: http://www.xbrl.org/2003/role/presentationRef
-Publisher SEC
-Name Exchange Act
-Number 240
-Section 12
-Subsection d1-1
| Name: |
dei_SecurityExchangeName |
| Namespace Prefix: |
dei_ |
| Data Type: |
dei:edgarExchangeCodeItemType |
| Balance Type: |
na |
| Period Type: |
duration |
|
| X |
- DefinitionBoolean flag that is true when the Form 8-K filing is intended to satisfy the filing obligation of the registrant as soliciting material pursuant to Rule 14a-12 under the Exchange Act. Reference 1: http://www.xbrl.org/2003/role/presentationRef
-Publisher SEC
-Name Exchange Act
-Section 14a
-Number 240
-Subsection 12
| Name: |
dei_SolicitingMaterial |
| Namespace Prefix: |
dei_ |
| Data Type: |
xbrli:booleanItemType |
| Balance Type: |
na |
| Period Type: |
duration |
|
| X |
- DefinitionTrading symbol of an instrument as listed on an exchange.
| Name: |
dei_TradingSymbol |
| Namespace Prefix: |
dei_ |
| Data Type: |
dei:tradingSymbolItemType |
| Balance Type: |
na |
| Period Type: |
duration |
|
| X |
- DefinitionBoolean flag that is true when the Form 8-K filing is intended to satisfy the filing obligation of the registrant as written communications pursuant to Rule 425 under the Securities Act. Reference 1: http://www.xbrl.org/2003/role/presentationRef
-Publisher SEC
-Name Securities Act
-Number 230
-Section 425
| Name: |
dei_WrittenCommunications |
| Namespace Prefix: |
dei_ |
| Data Type: |
xbrli:booleanItemType |
| Balance Type: |
na |
| Period Type: |
duration |
|
Quantumscape (NYSE:QS)
Historical Stock Chart
From Mar 2024 to Apr 2024

Quantumscape (NYSE:QS)
Historical Stock Chart
From Apr 2023 to Apr 2024
