false 0001524741 0001524741 2023-12-13 2023-12-13
UNITED STATES
SECURITIES AND EXCHANGE COMMISSION
Washington, D.C. 20549
FORM 8-K
CURRENT REPORT
Pursuant to Section 13 or 15(d)
of the Securities Exchange Act of 1934
Date of Report (date of earliest event reported): December 13, 2023
U.S. Silica Holdings, Inc.
(Exact name of registrant as specified in its charter)
Delaware
(State or other jurisdiction of incorporation)
|
|
|
| 001-35416 |
|
26-3718801 |
| (Commission File Number) |
|
(IRS Employer Identification No.) |
|
|
|
|
|
|
|
| 24275 Katy Freeway, Suite 600, |
|
Katy, |
|
Texas |
|
77494 |
| (Address of principal executive offices) |
|
(Zip Code) |
Registrant’s telephone number, including area code: (281) 258-2170
Check the appropriate box below if the Form 8-K filing is intended to simultaneously satisfy the filing obligation of the registrant under any of the following provisions:
| ☐ |
Written communications pursuant to Rule 425 under the Securities Act (17 CFR 230.425) |
| ☐ |
Soliciting material pursuant to Rule 14a-12 under the Exchange Act (17 CFR 240.14a-12) |
| ☐ |
Pre-commencement communications pursuant to Rule 14d-2(b) under the Exchange Act (17 CFR 240.14d-2(b)) |
| ☐ |
Pre-commencement communications pursuant to Rule 13e-4(c) under the Exchange Act (17 CFR 240.13e-4(c)) |
Securities registered pursuant to Section 12(b) of the Act:
|
|
|
|
|
| Title of each class |
|
Trading Symbol |
|
Name of each exchange on which registered |
| Common Stock, $0.01 par value |
|
SLCA |
|
New York Stock Exchange |
Indicate by check mark whether the registrant is an emerging growth company as defined in Rule 405 of the Securities Act of 1933 (§230.405 of this chapter) or Rule 12b-2 of the Securities Exchange Act of 1934 (§240.12b-2 of this chapter).
Emerging growth company ☐
If an emerging growth company, indicate by check mark if the registrant has elected not to use the extended transition period for complying with any new or revised financial accounting standards provided pursuant to Section 13(a) of the Exchange Act. ☐
| Item 7.01 |
Regulation FD Disclosure. |
U.S. Silica Holdings, Inc. (“U.S. Silica” or the “Company”) will host a virtual investor event at 9:00 a.m. CST (10:00 a.m. EST), Wednesday, December 13, 2023, to showcase its Industrial & Specialty Products (“ISP”) business segment. Chief Executive Officer Bryan Shinn, Executive Vice President and ISP President Zach Carusona, and members of the ISP team will provide an in-depth look at the business, including strategy, new market opportunities, and research and development. A copy of the presentation that will be used at the virtual investor event is included as Exhibit 99.1 hereto.
“We are unlocking new opportunities for long-term and sustainable value creation in our ISP segment,” said Bryan Shinn. “U.S. Silica provides technical and mission-critical products that are spec’d for the exacting needs of more than 2,000 ISP customers across diverse and attractive markets. Our customers rely on us because of our technical expertise, superior manufacturing capabilities and unsurpassed supply network. This event will provide an in-depth look at what is a very exciting part of our growth story and will include discussions of our attractive market positions, high barriers to entry, robust product pipeline and significant growth potential.”
U.S. Silica provides advanced materials, essential ingredients and processing aids for numerous industrial value chains. The Company’s advanced materials can be found in a wide range of end products, including solar panels, building products, coatings, and absorbents. As of the date of this Current Report on Form 8-K, U.S. Silica has number-one and number-two market positions across numerous industries and end uses.
Registration for the live webcast is available at the Company’s website under the “Investors / Events & Presentations” page. A question-and-answer session will follow the ISP team’s prepared remarks. An archived version of the webcast will be available after the event. Information contained on the Company’s website is not incorporated by reference into this Current Report on Form 8-K, and you should not consider any information on, or that can be accessed from, the Company’s website as part of this Current Report on Form 8-K.
The information set forth in this Item 7.01 of this Current Report on Form 8-K and the accompanying Exhibit 99.1 shall not be deemed “filed” for purposes of Section 18 of the Securities Exchange Act of 1934, as amended (the “Exchange Act”) or otherwise subject to the liabilities of that section, nor shall it be deemed incorporated by reference in any filing under the Securities Act or the Exchange Act, regardless of any general incorporation language in such filing, unless expressly incorporated by reference in such filing.
Cautionary Statement Regarding Forward-Looking Statements
This Current Report on Form 8-K, including Exhibit 99.1 furnished herewith, contains “forward-looking statements” within the meaning of the federal securities laws - that is, statements about the future, not about past events. Forward-looking statements give our current expectations and projections relating to our financial condition, results of operations, plans, objectives, future performance and business. These statements may include words such as “anticipate,” “estimate,” “expect,” “project,” “plan,” “intend,” “believe,” “may,” “will,” “should,” “could,” “can have,” “likely” and other words and terms of similar meaning. Forward-looking statements made include any statement that does not directly relate to any historical or current fact and may include, but are not limited to, statements regarding the Company’s growth opportunities, strategy, future financial results, forecasts, projections, plans and capital expenditures, technological innovations, and the commercial silica and diatomaceous earth industry. Forward-looking statements are based on our current expectations and assumptions, which may not prove to be accurate. These statements are not guarantees and are subject to risks, uncertainties and changes in circumstances that are difficult to predict. Many factors could cause actual results to differ materially and adversely from these forward-looking statements. Among these factors are global economic conditions; fluctuations in demand for commercial silica, diatomaceous earth, perlite, clay and cellulose; fluctuations in demand for frac sand or the development of either effective alternative proppants or new processes to replace hydraulic fracturing; the entry of competitors into our marketplace; changes in production spending by companies in the oil and gas industry and changes in the level of oil and natural gas exploration and development; general economic, political and business conditions in key regions of the world; pricing pressure; weather and seasonal factors; the cyclical nature of our customers’ business; our inability to meet our financial and performance targets and other forecasts or expectations; our substantial indebtedness and pension obligations, including restrictions on our operations imposed by our indebtedness; operational modifications, delays or cancellations; prices for electricity, natural gas and diesel fuel; our ability to maintain our transportation network; changes in government regulations and regulatory requirements,
including those related to mining, explosives, chemicals, pharmaceuticals, and oil and gas production; silica-related health issues and corresponding litigation; and other risks and uncertainties detailed in our Forms 10-K, 10-Q, and 8-K filed with or furnished to the U.S. Securities and Exchange Commission. If one or more of these or other risks or uncertainties materialize (or the consequences of such a development changes), or should underlying assumptions prove incorrect, actual outcomes may vary materially from those reflected in our forward-looking statements. The forward-looking statements speak only as of the date of this Current Report on Form 8-K, and we disclaim any intention or obligation to update publicly or revise such statements, whether as a result of new information, future events or otherwise.
| Item 9.01 |
Financial Statements and Exhibits. |
SIGNATURES
Pursuant to the requirements of the Securities Exchange Act of 1934, the registrant has duly caused this report to be signed on its behalf by the undersigned hereunto duly authorized.
Date: December 13, 2023
|
|
|
| U.S. SILICA HOLDINGS, INC. |
|
|
| |
|
/s/ Stacy Russell |
|
|
Stacy Russell |
|
|
Executive Vice President, General Counsel & Corporate Secretary |

Exhibit 99.1 VIRTUAL INVESTOR EVENT Industrial & Specialty Products
Showcase DECEMBER 13, 2023

Welcome PATRICIA GIL VP, Investor Relations & Sustainability
2

VIRTUAL INVESTOR EVENT Forward Looking Statements This presentation
includes “forward-looking statements” within the meaning of of competitors into our marketplace; changes in production spending by the federal securities laws - that is, statements about the future, not about past companies in the oil
and gas industry and changes in the level of oil and natural events. Forward-looking statements give our current expectations and gas exploration and development; general economic, political and business projections relating to our financial
condition, results of operations, plans, conditions in key regions of the world; pricing pressure; weather and seasonal objectives, future performance and business. These statements may include factors; the cyclical nature of our customers’
business; our inability to meet our words such as “anticipate,” “estimate,” “expect,” “project,” “plan,” “intend,” financial and performance targets and other forecasts or
expectations; our “believe,” “may,” “will,” “should,” “could,” “can have,” “likely” and other words and substantial indebtedness and pension obligations, including
restrictions on our terms of similar meaning. Forward-looking statements made include any operations imposed by our indebtedness; operational modifications, delays or statement that does not directly relate to any historical or current fact and may
cancellations; prices for electricity, natural gas and diesel fuel; our ability to include, but are not limited to, statements regarding the Company’s growth maintain our transportation network; changes in government regulations and
opportunities, strategy, future financial results, forecasts, projections, plans and regulatory requirements, including those related to mining, explosives, capital expenditures, technological innovations, and the commercial silica and chemicals,
pharmaceuticals, and oil and gas production; silica-related health diatomaceous earth industry. Forward-looking statements are based on our issues and corresponding litigation; and other risks and uncertainties detailed in current expectations and
assumptions, which may not prove to be accurate. our Forms 10-K, 10-Q, and 8-K filed with or furnished to the U.S. Securities and These statements are not guarantees and are subject to risks, uncertainties and Exchange Commission. If one or more of
these or other risks or uncertainties changes in circumstances that are difficult to predict. Many factors could cause materialize (or the consequences of such a development changes), or should actual results to differ materially and adversely from
these forward-looking underlying assumptions prove incorrect, actual outcomes may vary materially statements. Among these factors are global economic conditions; fluctuations in from those reflected in our forward-looking statements. The
forward-looking demand for commercial silica, diatomaceous earth, perlite, clay and cellulose; statements speak only as of the date hereof, and we disclaim any intention or fluctuations in demand for frac sand or the development of either effective
obligation to update publicly or revise such statements, whether as a result of alternative proppants or new processes to replace hydraulic fracturing; the entry new information, future events or otherwise. 3
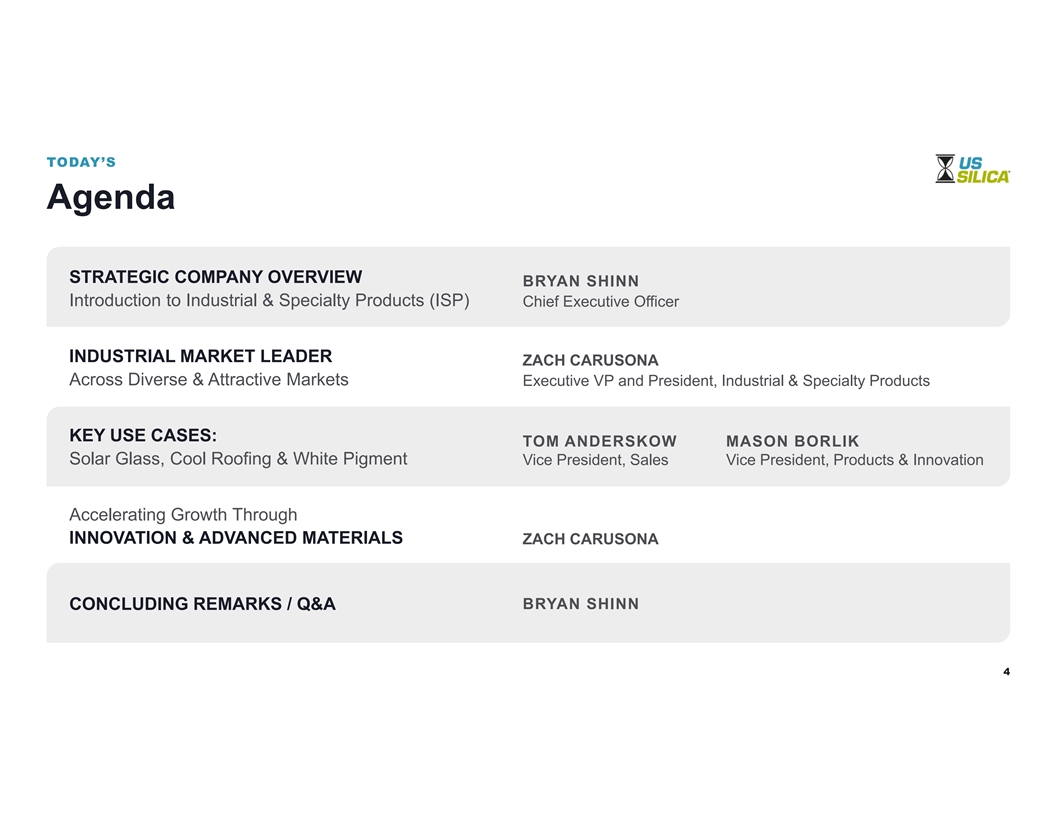
TODAY’S Agenda STRATEGIC COMPANY OVERVIEW BRYAN SHINN Introduction
to Industrial & Specialty Products (ISP) Chief Executive Officer INDUSTRIAL MARKET LEADER ZACH CARUSONA Across Diverse & Attractive Markets Executive VP and President, Industrial & Specialty Products KEY USE CASES: TOM ANDERSKOW MASON
BORLIK Solar Glass, Cool Roofing & White Pigment Vice President, Sales Vice President, Products & Innovation Accelerating Growth Through INNOVATION & ADVANCED MATERIALS ZACH CARUSONA BRYAN SHINN CONCLUDING REMARKS / Q&A 4

OPENING REMARKS U.S. Silica Today BRYAN SHINN Chief Executive Officer
5
U.S. SILICA AT A GLANCE Global Performance Materials Company Diversified
mining, materials and logistics enterprise+ Leading producer of industrial silica, diatomaceous earth, cristobalite, perlite, and specialty clays Value-added offerings designed to support highly specified customer requirements 6

U.S. SILICA AT A GLANCE Diverse & Innovative Product Portfolio
Industrial & Specialty Products NEW PRODUCTS NEW APPLICATIONS • Attractive market positions with high barriers to entry ® White Armor Renewable Cool Roof Granules Diesel • Technical expertise ® EverWhite Pharmaceutical
• Delivering results Pigment Filtration Cristobalite • Significant growth potential Formulated ® PurifiDE Products Diatomaceous Earth • Robust new product pipeline 7

REPOSITIONING FOR LONG-TERM GROWTH Most Exciting Time in Our History
Using Cash Flow from Operations to De-Lever Operating Cash Net Debt Unlocking the potential of Flow ($mm) Ratio $300 4.5x our Industrial business 4.3x 4.0x $250 $276.0 $262.7 3.5x Redefining our strategy $200 3.0x $150 $169.3 2.5x Expanding our
offerings 2.2x $100 2.0x $50 1.5x Significantly increasing 1.4x $0 1.0x our addressable markets 2021 2022 TTM TTM as of 9/30/23 8

POWERFUL GROWTH PLAN Three Pillars ISP Contribution Margin Dollar Growth
12% Grow base business at GDP+ 10% 8-10% 8% CAGR Expand capacity 8% 6% for high-value CAGR sold-out products 4% 5% CAGR 2% Launch new advanced materials 0% 20-23E 22-23E 23E-26E Base Case 4Q’23E based on guidance for contribution margin
dollars to increase 5% to 10% y/y 9

INDUSTRIAL SPECIALTY PRODUCTS (ISP) Delivering Value Across a Range of
Applications PROCESSING CRITICAL VALUE-ADD MAJOR AID INGREDIENT COMPONENT We are providing critical Purer & Look better More Value We cleaner & last longer abundant Deliver advanced ® ® ® Example PurifiDE High-purity
Sil-Co-Sil & Min-U-Sil Specialty Low Iron Silica Products Diatomaceous Earth ground silicas materials Filtration Sampling of Wide range of Paints, plastics, 100s of diverse finished Applications end-products, cosmetics, and more products, from
eyeglasses from beer & wine to to solar reflective roofing biologic medicines 10
WHY WE LIKE ISP Strong & Resilient Business Stable business
Reliable U.S. supplier High barriers to entry Aligned with demand for sustainable solutions Market leader in growing markets 11

Industrial & Specialty Products ZACH CARUSONA Executive Vice
President and President, Industrial & Specialty Products 12 12

ISP BUSINESS: Market leader across diverse & attractive markets
13

INDUSTRIAL & SPECIALTY PRODUCTS Market-Leading Offerings PRODUCTS
EXAMPLES END SEGMENTS POSITION VALUE PROPOSITION ® • Building Products Advanced White Armor Enhancing #1 Materials Cool Roof • Pharmaceutical Filtration End-Product Producer of Granules • Coatings & Fillers Performance
cool roof granules in the U.S. ® • Building Products Whole Grain & Sil-Co-Sil Highly Specified #1 Ground Silica Ground Silica •Glass Solutions Producer of • Fiberglass ground silica • Coatings / Fillers in the U.S.
® • Food & Beverage Diatomaceous Celatom Premier #1 Earth, Perlite, Diatomaceous • Chemicals & Refinery Quality with Producer of & Clay Earth • Absorbents Unique Deposits Diatomaceous • Coatings / Fillers
Earth in the U.S. 14

POSITIONED TO WIN Our Unique Capabilities Create Barriers to Entry
& Long-Term Customer Relationships Technical & Superior Unmatched Highly Leader in Mission Critical Manufacturing Supply Contracted Innovation Products Capabilities Network Revenue and R&D Spec’d into customer #1 producer in the US
Able to adapt to Long-standing Reliable partner needs; 800+ products for ground silica and customers’ needs relationships with ability to invest for 2k+ customers diatomaceous earth with 22 facilities enable consistency in R&D beyond core
across the US for customers 15

PAINTS & COATINGS MAKEUP & COSMETICS GROUTS & MORTARS SMART
PHONE & CONTAINER GLASS FOUNDRY INKS & PAPER COATINGS ARCHITECTURAL GLASS EDIBLE OIL FILTRATION QUARTZ SURFACES Our products are found in EVERYDAY ITEMS WINE, BEER & SPIRITS FILTRATION PET LITTER & OTHER ABSORBENTS 16

WIND TURBINES SOLAR PANELS ROOFING ARCHITECTURAL GLASS Our products are
found in EVERYDAY ITEMS INSULATON FIBER CEMENT SIDING STUCCO AUTOMOTIVE GLASS EMISSIONS PARTICULATE FILTERS RENEWABLE DIESEL PLASTIC & RUBBER PRODUCTS SOIL AMENDMENTS SWIMMING POOL FILTRATION 17 ORGANIC INSECTICIDE

STRONG MARKET POSITION Segment Leader Across Robust and Diversified
Industrial & Specialty Minerals End Segments 1 END SEGMENT ISP REVENUE SHARE - 2023 KEY TAKEAWAYS KEY CUSTOMERS Food & Beverage 17% Segment leader: #1 or #2 in most segments with defensible position Chemicals & Refinery 15% ISP SHOWCASE
HIGHLIGHTS Total addressable market at >$3 billion and growing Building Products 14% Unique technical capabilities Glass 13% deliver value to customers Industrial Applications 12% Robust and diversified end-segments enable GDP+ Absorbents 9%
growth in base business Fiberglass 7% Over 800 products serving as critical materials for Coatings / Fillers 7% 2,000+ customers 1 6% revenue tied to other end segments 18

KEY USE CASES: Solar Glass, Cool Roofing, New White Pigments
19
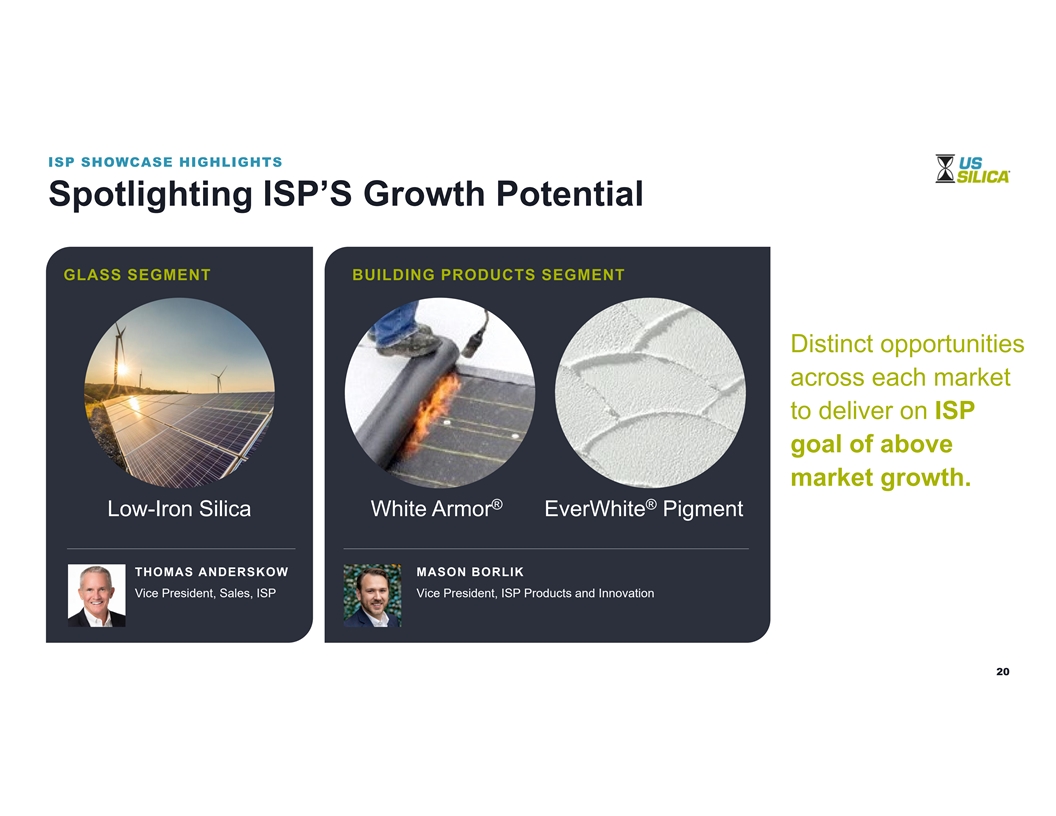
ISP SHOWCASE HIGHLIGHTS Spotlighting ISP’S Growth Potential GLASS
SEGMENT BUILDING PRODUCTS SEGMENT Distinct opportunities across each market to deliver on ISP goal of above market growth. ® ® Low-Iron Silica White Armor EverWhite Pigment THOMAS ANDERSKOW MASON BORLIK Vice President, Sales, ISP Vice
President, ISP Products and Innovation 20

KEY USE CASE Solar Glass Opportunity THOMAS ANDERSKOW Vice President,
Sales, Industrial & Specialty Products 21

MARKET DYNAMICS Serving Several Attractive & Growing Glass
Applications Fueled by Mega-trends Solar Glass Container Glass Flat Glass #1 END • Solar panels • Retail packaging • Architectural windows PRODUCTS Producer of Low • Architectural windows • Consumer stemware •
Automobile glass Iron Silica for 1 GROWTH IRA investment Sustainable Increased glass MEGA- in renewable packaging in automobiles Glass Applications TRENDS energy & housing in US TOTAL (20%-30% CAGR ~$40M $350-425M $225-275M ADDRESSABLE 2 over
next 3 years) MARKET 1 Inflation Reduction Act 2 22 2023 North America TAM

POSITIONING U.S. Silica Strongly Positioned to Support Glass Market
Growth Supplies the lowest-iron content VALUE PROPOSITION FOR GLASS MANUFACTURING glass sand in North America Rockwood, MI Quality & performance Mapleton Depot, PA high-purity sands enhance product Mauricetown, NJ Ottawa, IL Berkeley Springs, WV
aesthetics and transparency Montpelier, VA Pacific, MO Broad offerings & customization 12 Jackson, TN Mill Creek, OK SILICA Columbia, SC low-iron, high-aluminum, and more FACILITIES Hurtsboro, AL Dubberly, LA Strategically located plants ~12M
minimize freight costs and speed delivery time TOTAL NAME PLATE CAPACITY (TONS) 23

CASE STUDY FIRST SOLAR REACHES 14GW IN 2026 U.S. Silica Supporting
Expansion of Domestic Solar Panel Manufacturing 140% increase in Domestic solar glass projected over next 3 years, driven by IRA U.S. Silica supplies domestic glass manufacturers to support First Solar 5.9 GW 2018/2019 2022 build-out in US Expected
OHIO 1/2 OHIO 3 Capacity +8.2 GW First Solar now investing 2024 2025 Expected in additional facilities to Expected Expected Capacity ALABAMA 4 LOUISIANA 5 support future growth 24

U.S. Silica is vital in providing a reliable, “ responsibly
sourced domestic supply of low-iron silica required to produce the glass for our panels. High-quality glass is a primary component in our advanced thin film solar panels, and access to American-made glass is essential not just to our manufacturing
operations but also to our commitment to sustainability and supply chain transparency. We are pleased to count U.S. Silica as a valued partner as we continue to grow our American manufacturing footprint and enable the country's journey to a
sustainable energy future. MIKE KORALEWSKI ” Chief Supply Chain Officer, First Solar 25

KEY TAKEAWAYS Enabling Growth in Domestic Solar Panel Manufacturing
Highly-Differentiated Dramatic Domestic Stability of Product Solar Glass Growth Supply U.S. Silica has Domestic solar panel Strategically located high-purity, consistent production projected to and logistically silica product that more than double
over advantaged — can be used in the the next three years– Essential for glass most demanding U.S. Silica currently manufacturing at glass applications the primary supplier of this scale low-iron silica used in domestic solar glass
26

KEY USE CASE Cool Roofing & New White Pigments MASON BORLIK Vice
President, ISP Products and Innovation 27

MARKET DYNAMICS U.S. Silica Portfolio Touches All Aspects of Building
Products Wide breadth of ...resulting in ...driven by end markets… expansion mega-trends… • ESG focused regulations • Climate change driven >$2B remodels of incremental • Major infrastructure addressable market
upgrades expected by 2026 • Housing market fundamentals • Near-shoring of production 28

CORE CAPABILITIES Fully Servicing Building Products Customers
Positioned to grow rapidly with residential, commercial, and infrastructure tailwinds Largest silica Unique Consistent grinding patented high-volume “U.S. Silica has been a long-term partner network in manufacturing supply to the US
capabilities customers for Owens Corning and we appreciate the quality, reliability of the products they provide Producing ground Producing cool Large plant network silica products at roof granules and with superior for the manufacturing of our
products.” six U.S. locations cristobalite at product quality and NICOLAS SEIGNEURET U.S. locations performance Sourcing Director, Composites 29

INNOVATION PRODUCT SPOTLIGHT ® White Armor Protects the Most
Important, Most Valuable Buildings ® White Armor Commercial cool roofing can reflect away 90% of solar helps customers energy and offer 10-15% energy savings achieve regulatory Cool Roofing granules are used on high-value, long-lifetime
buildings compliance and Growth of this segment is 10% CAGR Regulatory standards (e.g., CA Title 24) drive minimum solar reflectance best-in-class standards across the U.S. performance 30

INNOVATION PRODUCT SPOTLIGHT ® EverWhite Pigment Provides Value in
Previously Untapped Applications Patented products provide new alternatives for Delivers performance benefits, $2B+ titanium dioxide market by 2026 supply chain reliability and cost Success achieved in multiple entry markets… savings into a
variable market • Lighter weight option • Higher total solar reflectivity • Increased durability and resilience GROUTS & MORTARS FLUID-APPLIED ROOFING • Greater cementitious strength • Decreased processing times
• Potential for opportunity outside building products ENGINEERED STONE OTHER INDUSTRIAL COUNTERTOPS MARKETS 31

KEY TAKEAWAYS Innovative Solutions Allow U.S. Silica to be on Leading
Edge of Building Products Growth Diverse Expanded New Product Product Lines Regulations Benefits And reliable supply Environmental Launch of the ® networks allow U.S. regulations, like CA EverWhite Pigment Silica to serve large Title 24, drive
growth for product line provide customers throughout the ESG-forward products customer cost savings ® residential, commercial, like White Armor Cool and new application and infrastructure Roof Granules at CAGRs performance benefits construction
markets well above market norms in a >$2B market 32

ACCELERATING GROWTH through innovation and advanced materials
33

THE FUTURE Significant Opportunity to Continue Expanding the
Addressable Market 100+ YRS AGO 70+ YRS AGO 2017 2018 TODAY 2026 Expanding addressable ADVANCED MATERIALS ® ® EverWhite PurifiDE markets & Pigment High Purity Cool Roof Granules DE, Clays & Industrial Sand Ground Silica
Applications Filtration Perlite Cristobalite enabling growth Renewable Others Diesel Filtration beyond core end segments Total TAM: ~$1B ~$3B ~$6B+ 34

ROCHELLE, IL INNOVATION CENTER Enhancing Innovation & Production
Capabilities Centralized community of world-class • Larger, geographically scientists and engineers Barriers concentrated R&D staff to Entry • Investment in novel, advanced technologies • Faster time to market with pilot plant
ability • Market-focused innovation pipeline 35

ACCELERATING INNOVATION R&D Investments Yielding Returns in 2023
2023E vs 2020-2022 Average Growth Capital Investment +80% +30% PhDs in Research & Business $CM from New Products, +60% 1 Development Applications and Markets R&D Spend +40% 1 (2023E vs 2020-2022 avg) 36

BRINGING IT ALL TOGETHER Long-term ISP Target Model DRIVERS Market
Leadership TARGET MODEL #1 or #2 leadership positions across the portfolio CONTRIBUTION CONTRIBUTION ISP Key Market Opportunities MARGIN MARGIN DOLLARS Segment $3B+ total addressable market growing to $6B+ Full-Year through new products and
applications 2022 30% $170M Accelerating New Product Development Full Year Significantly increasing investment on innovation 2023E capabilities 33% $184M Margin Expansion 3 Year Increasing sales of high margin advanced materials Target 35% 8-10%
with unique customer value propositions annual CM Growth 37

Concluding Remarks BRYAN SHINN Chief Executive Officer 38

ISP MARKET SHARE Rapidly Expanding Total Addressable Market Target 2026
Larger Addressable TAM Market enables $6B substantial new business opportunities 2023 $3B TAM 2023E $550M Revenues 39

INDUSTRIAL & SPECIALTY PRODUCTS Key Takeaways • Delivering
mission-critical materials across diverse markets Leading supplier • Resulting in sticky, long-term customer relationships Unique capabilities • Increasing profitability of base business at a GDP+ rate Strong & resilient business
• Investing in high-value, differentiated products • Creating long-term opportunities Societal growth trends • Driving EBITDA multiple expansion for U.S. Silica Exciting value creation 40

OUR CORPORATE STRATEGY Repositioning U.S. Silica for Long-term Growth
Capitalizing on Long-Term Value Multi-Year Energy Cycle Enhancement Strong Cash Flow Generation Growing High-Margin ISP Segment Healthy Balance Sheet 41

Q&A 42

Thank You STAY TUNED See you at our 2024 investor day 43

Appendix 44
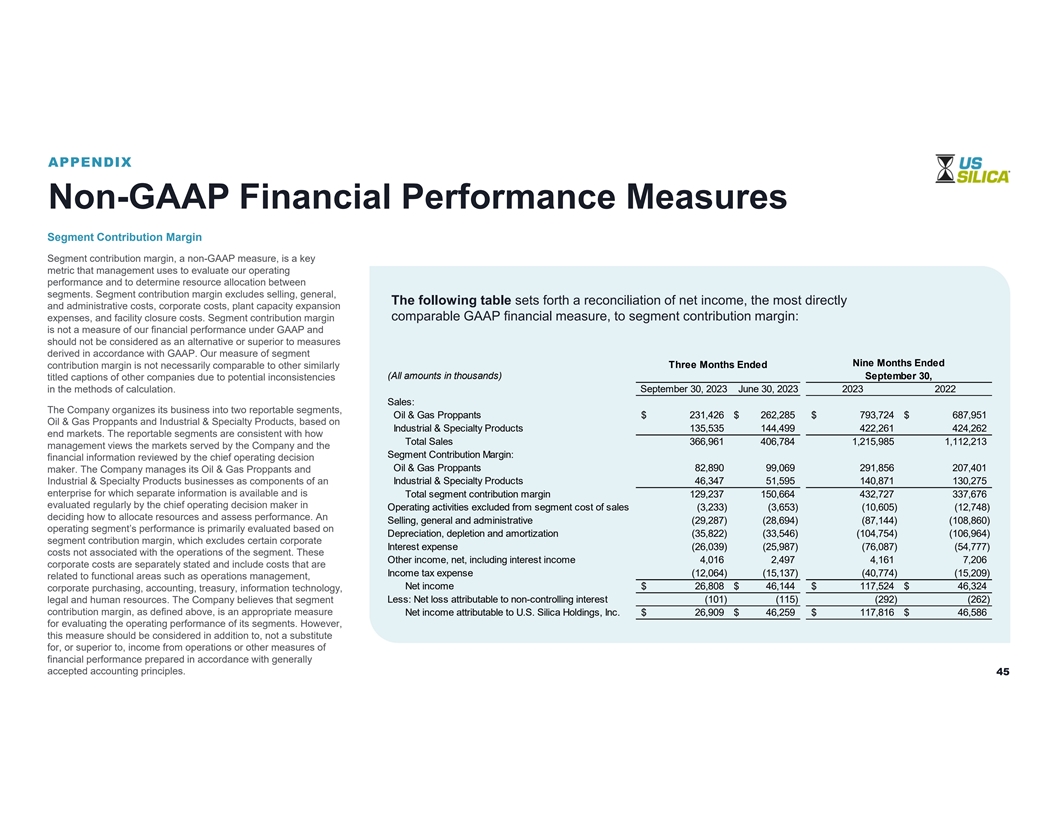
APPENDIX Non-GAAP Financial Performance Measures Segment Contribution
Margin Segment contribution margin, a non-GAAP measure, is a key metric that management uses to evaluate our operating performance and to determine resource allocation between segments. Segment contribution margin excludes selling, general, The
following table sets forth a reconciliation of net income, the most directly and administrative costs, corporate costs, plant capacity expansion expenses, and facility closure costs. Segment contribution margin comparable GAAP financial measure, to
segment contribution margin: is not a measure of our financial performance under GAAP and should not be considered as an alternative or superior to measures derived in accordance with GAAP. Our measure of segment Nine Months Ended Three Months Ended
contribution margin is not necessarily comparable to other similarly (All amounts in thousands) September 30, titled captions of other companies due to potential inconsistencies September 30, 2023 June 30, 2023 2023 2022 in the methods of
calculation. Sales: The Company organizes its business into two reportable segments, Oil & Gas Proppants $ 231,426 $ 262,285 $ 793,724 $ 687,951 Oil & Gas Proppants and Industrial & Specialty Products, based on Industrial & Specialty
Products 135,535 144,499 422,261 424,262 end markets. The reportable segments are consistent with how Total Sales 366,961 406,784 1,215,985 1,112,213 management views the markets served by the Company and the Segment Contribution Margin: financial
information reviewed by the chief operating decision Oil & Gas Proppants 82,890 99,069 291,856 207,401 maker. The Company manages its Oil & Gas Proppants and Industrial & Specialty Products 46,347 51,595 140,871 130,275 Industrial &
Specialty Products businesses as components of an enterprise for which separate information is available and is Total segment contribution margin 129,237 150,664 432,727 337,676 evaluated regularly by the chief operating decision maker in Operating
activities excluded from segment cost of sales (3,233) (3,653) (10,605) (12,748) deciding how to allocate resources and assess performance. An Selling, general and administrative (29,287) (28,694) (87,144) (108,860) operating segment’s
performance is primarily evaluated based on Depreciation, depletion and amortization (35,822) (33,546) (104,754) (106,964) segment contribution margin, which excludes certain corporate Interest expense (26,039) (25,987) (76,087) (54,777) costs not
associated with the operations of the segment. These Other income, net, including interest income 4,016 2,497 4,161 7,206 corporate costs are separately stated and include costs that are Income tax expense (12,064) (15,137) (40,774) (15,209) related
to functional areas such as operations management, Net income $ 26,808 $ 46,144 $ 117,524 $ 46,324 corporate purchasing, accounting, treasury, information technology, Less: Net loss attributable to non-controlling interest (101) (115) (292) (262)
legal and human resources. The Company believes that segment contribution margin, as defined above, is an appropriate measure Net income attributable to U.S. Silica Holdings, Inc. $ 26,909 $ 46,259 $ 117,816 $ 46,586 for evaluating the operating
performance of its segments. However, this measure should be considered in addition to, not a substitute for, or superior to, income from operations or other measures of financial performance prepared in accordance with generally accepted accounting
principles. 45
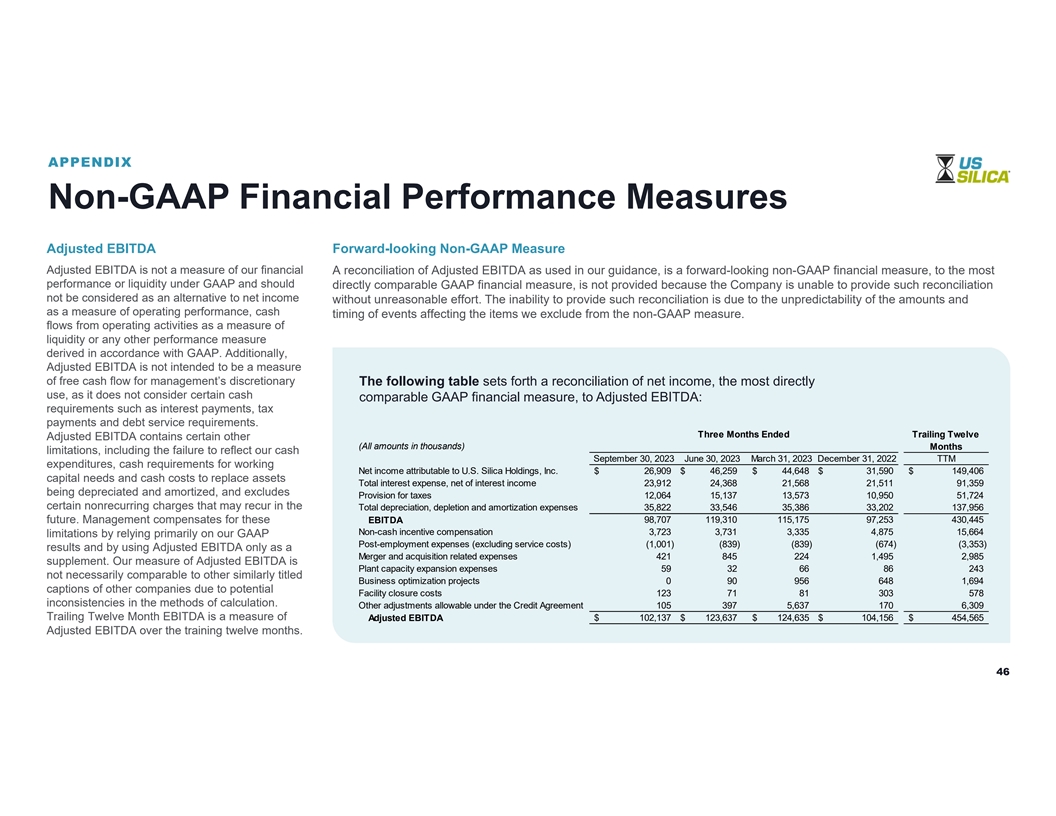
APPENDIX Non-GAAP Financial Performance Measures Adjusted EBITDA
Forward-looking Non-GAAP Measure Adjusted EBITDA is not a measure of our financial A reconciliation of Adjusted EBITDA as used in our guidance, is a forward-looking non-GAAP financial measure, to the most performance or liquidity under GAAP and
should directly comparable GAAP financial measure, is not provided because the Company is unable to provide such reconciliation not be considered as an alternative to net income without unreasonable effort. The inability to provide such
reconciliation is due to the unpredictability of the amounts and as a measure of operating performance, cash timing of events affecting the items we exclude from the non-GAAP measure. flows from operating activities as a measure of liquidity or any
other performance measure derived in accordance with GAAP. Additionally, Adjusted EBITDA is not intended to be a measure of free cash flow for management’s discretionary The following table sets forth a reconciliation of net income, the most
directly use, as it does not consider certain cash comparable GAAP financial measure, to Adjusted EBITDA: requirements such as interest payments, tax payments and debt service requirements. Three Months Ended Trailing Twelve Adjusted EBITDA contains
certain other (All amounts in thousands) Months limitations, including the failure to reflect our cash September 30, 2023 June 30, 2023 March 31, 2023 December 31, 2022 TTM expenditures, cash requirements for working Net income attributable to U.S.
Silica Holdings, Inc. $ 26,909 $ 46,259 $ 44,648 $ 31,590 $ 149,406 capital needs and cash costs to replace assets Total interest expense, net of interest income 23,912 24,368 21,568 21,511 91,359 being depreciated and amortized, and excludes
Provision for taxes 12,064 15,137 13,573 10,950 51,724 certain nonrecurring charges that may recur in the Total depreciation, depletion and amortization expenses 35,822 33,546 35,386 33,202 137,956 98,707 119,310 115,175 97,253 430,445 future.
Management compensates for these EBITDA Non-cash incentive compensation 3,723 3,731 3,335 4,875 15,664 limitations by relying primarily on our GAAP Post-employment expenses (excluding service costs) (1,001) (839) (839) (674) (3,353) results and by
using Adjusted EBITDA only as a Merger and acquisition related expenses 421 845 224 1,495 2,985 supplement. Our measure of Adjusted EBITDA is Plant capacity expansion expenses 59 32 66 86 243 not necessarily comparable to other similarly titled
Business optimization projects 0 90 956 648 1,694 captions of other companies due to potential Facility closure costs 123 71 81 303 578 inconsistencies in the methods of calculation. Other adjustments allowable under the Credit Agreement 105 397
5,637 170 6,309 Trailing Twelve Month EBITDA is a measure of Adjusted EBITDA $ 102,137 $ 123,637 $ 124,635 $ 104,156 $ 454,565 Adjusted EBITDA over the training twelve months. 46

APPENDIX Non-GAAP Financial Performance Measures Net Debt
Forward-looking Non-GAAP Measure Net Debt is calculated by adding together short-term debt A reconciliation of Net Leverage Ratio as used in our guidance, is a forward-looking non-GAAP financial measure, to the and long-term debt and subtracting
cash and cash most directly comparable GAAP financial measure, is not provided because the Company is unable to provide such equivalents from the total. Net debt shows how a company’s reconciliation without unreasonable effort. The inability
to provide such reconciliation is due to the unpredictability of the indebtedness has changed over a period as a result of cash amounts and timing of events affecting the items we exclude from the non-GAAP measure. flows and other non-cash
movements. Net debt allows investors to see how business financing has changed and assess whether an entity that has had a significant increase in cash has, for example, achieved this only by taking on a corresponding increase in debt. Net debt is
not a measure of our financial performance or liquidity under GAAP and should not be considered as an alternative to net income as a measure of operating performance, cash flows from ($mm) 2021 2022 1Q '23 2Q '23 3Q '23 operating activities as a
measure of liquidity or any other performance measure derived in accordance with GAAP. Cash and cash equivalents ($239.4) ($280.8) ($139.5) ($187.0) ($222.4) Current portion of long-term debt $18.3 $19.5 $13.6 $10.2 $19.8 Net Leverage Ratio
Long-term debt $1,193.1 $1,037.5 $897.0 $871.9 $847.8 Net Leverage Ratio is calculated by dividing net debt by Net debt $972.0 $776.1 $771.1 $695.1 $645.2 Trailing Twelve Month EBITDA. Management believes that net leverage ratio provides useful
information to investors because it is an important indicator of the Company’s TTM Adjusted EBITDA $223.5 $353.6 $425.3 $455.1 $454.6 indebtedness in relation to its operating performance. Net Leverage Ratio should be considered in addition to
results Net Leverage Ratio 4.3x 2.2x 1.8x 1.5x 1.4x prepared in accordance with GAAP and should not be considered substitutes for or superior to GAAP results. In addition, our Net Leverage Ratio may not be comparable to similarly titled measures
utilized by other companies. 47
v3.23.3
| X |
- DefinitionBoolean flag that is true when the XBRL content amends previously-filed or accepted submission.
| Name: |
dei_AmendmentFlag |
| Namespace Prefix: |
dei_ |
| Data Type: |
xbrli:booleanItemType |
| Balance Type: |
na |
| Period Type: |
duration |
|
| X |
- DefinitionFor the EDGAR submission types of Form 8-K: the date of the report, the date of the earliest event reported; for the EDGAR submission types of Form N-1A: the filing date; for all other submission types: the end of the reporting or transition period. The format of the date is YYYY-MM-DD.
| Name: |
dei_DocumentPeriodEndDate |
| Namespace Prefix: |
dei_ |
| Data Type: |
xbrli:dateItemType |
| Balance Type: |
na |
| Period Type: |
duration |
|
| X |
- DefinitionThe type of document being provided (such as 10-K, 10-Q, 485BPOS, etc). The document type is limited to the same value as the supporting SEC submission type, or the word 'Other'.
| Name: |
dei_DocumentType |
| Namespace Prefix: |
dei_ |
| Data Type: |
dei:submissionTypeItemType |
| Balance Type: |
na |
| Period Type: |
duration |
|
| X |
- DefinitionAddress Line 1 such as Attn, Building Name, Street Name
| Name: |
dei_EntityAddressAddressLine1 |
| Namespace Prefix: |
dei_ |
| Data Type: |
xbrli:normalizedStringItemType |
| Balance Type: |
na |
| Period Type: |
duration |
|
| X |
- DefinitionAddress Line 2 such as Street or Suite number
| Name: |
dei_EntityAddressAddressLine2 |
| Namespace Prefix: |
dei_ |
| Data Type: |
xbrli:normalizedStringItemType |
| Balance Type: |
na |
| Period Type: |
duration |
|
| X |
- Definition
+ References
+ Details
| Name: |
dei_EntityAddressCityOrTown |
| Namespace Prefix: |
dei_ |
| Data Type: |
xbrli:normalizedStringItemType |
| Balance Type: |
na |
| Period Type: |
duration |
|
| X |
- DefinitionCode for the postal or zip code
| Name: |
dei_EntityAddressPostalZipCode |
| Namespace Prefix: |
dei_ |
| Data Type: |
xbrli:normalizedStringItemType |
| Balance Type: |
na |
| Period Type: |
duration |
|
| X |
- DefinitionName of the state or province.
| Name: |
dei_EntityAddressStateOrProvince |
| Namespace Prefix: |
dei_ |
| Data Type: |
dei:stateOrProvinceItemType |
| Balance Type: |
na |
| Period Type: |
duration |
|
| X |
- DefinitionA unique 10-digit SEC-issued value to identify entities that have filed disclosures with the SEC. It is commonly abbreviated as CIK. Reference 1: http://www.xbrl.org/2003/role/presentationRef
-Publisher SEC
-Name Exchange Act
-Number 240
-Section 12
-Subsection b-2
| Name: |
dei_EntityCentralIndexKey |
| Namespace Prefix: |
dei_ |
| Data Type: |
dei:centralIndexKeyItemType |
| Balance Type: |
na |
| Period Type: |
duration |
|
| X |
- DefinitionIndicate if registrant meets the emerging growth company criteria. Reference 1: http://www.xbrl.org/2003/role/presentationRef
-Publisher SEC
-Name Exchange Act
-Number 240
-Section 12
-Subsection b-2
| Name: |
dei_EntityEmergingGrowthCompany |
| Namespace Prefix: |
dei_ |
| Data Type: |
xbrli:booleanItemType |
| Balance Type: |
na |
| Period Type: |
duration |
|
| X |
- DefinitionCommission file number. The field allows up to 17 characters. The prefix may contain 1-3 digits, the sequence number may contain 1-8 digits, the optional suffix may contain 1-4 characters, and the fields are separated with a hyphen.
| Name: |
dei_EntityFileNumber |
| Namespace Prefix: |
dei_ |
| Data Type: |
dei:fileNumberItemType |
| Balance Type: |
na |
| Period Type: |
duration |
|
| X |
- DefinitionTwo-character EDGAR code representing the state or country of incorporation.
| Name: |
dei_EntityIncorporationStateCountryCode |
| Namespace Prefix: |
dei_ |
| Data Type: |
dei:edgarStateCountryItemType |
| Balance Type: |
na |
| Period Type: |
duration |
|
| X |
- DefinitionThe exact name of the entity filing the report as specified in its charter, which is required by forms filed with the SEC. Reference 1: http://www.xbrl.org/2003/role/presentationRef
-Publisher SEC
-Name Exchange Act
-Number 240
-Section 12
-Subsection b-2
| Name: |
dei_EntityRegistrantName |
| Namespace Prefix: |
dei_ |
| Data Type: |
xbrli:normalizedStringItemType |
| Balance Type: |
na |
| Period Type: |
duration |
|
| X |
- DefinitionThe Tax Identification Number (TIN), also known as an Employer Identification Number (EIN), is a unique 9-digit value assigned by the IRS. Reference 1: http://www.xbrl.org/2003/role/presentationRef
-Publisher SEC
-Name Exchange Act
-Number 240
-Section 12
-Subsection b-2
| Name: |
dei_EntityTaxIdentificationNumber |
| Namespace Prefix: |
dei_ |
| Data Type: |
dei:employerIdItemType |
| Balance Type: |
na |
| Period Type: |
duration |
|
| X |
- DefinitionLocal phone number for entity.
| Name: |
dei_LocalPhoneNumber |
| Namespace Prefix: |
dei_ |
| Data Type: |
xbrli:normalizedStringItemType |
| Balance Type: |
na |
| Period Type: |
duration |
|
| X |
- DefinitionBoolean flag that is true when the Form 8-K filing is intended to satisfy the filing obligation of the registrant as pre-commencement communications pursuant to Rule 13e-4(c) under the Exchange Act. Reference 1: http://www.xbrl.org/2003/role/presentationRef
-Publisher SEC
-Name Exchange Act
-Number 240
-Section 13e
-Subsection 4c
| Name: |
dei_PreCommencementIssuerTenderOffer |
| Namespace Prefix: |
dei_ |
| Data Type: |
xbrli:booleanItemType |
| Balance Type: |
na |
| Period Type: |
duration |
|
| X |
- DefinitionBoolean flag that is true when the Form 8-K filing is intended to satisfy the filing obligation of the registrant as pre-commencement communications pursuant to Rule 14d-2(b) under the Exchange Act. Reference 1: http://www.xbrl.org/2003/role/presentationRef
-Publisher SEC
-Name Exchange Act
-Number 240
-Section 14d
-Subsection 2b
| Name: |
dei_PreCommencementTenderOffer |
| Namespace Prefix: |
dei_ |
| Data Type: |
xbrli:booleanItemType |
| Balance Type: |
na |
| Period Type: |
duration |
|
| X |
- DefinitionTitle of a 12(b) registered security. Reference 1: http://www.xbrl.org/2003/role/presentationRef
-Publisher SEC
-Name Exchange Act
-Number 240
-Section 12
-Subsection b
| Name: |
dei_Security12bTitle |
| Namespace Prefix: |
dei_ |
| Data Type: |
dei:securityTitleItemType |
| Balance Type: |
na |
| Period Type: |
duration |
|
| X |
- DefinitionName of the Exchange on which a security is registered. Reference 1: http://www.xbrl.org/2003/role/presentationRef
-Publisher SEC
-Name Exchange Act
-Number 240
-Section 12
-Subsection d1-1
| Name: |
dei_SecurityExchangeName |
| Namespace Prefix: |
dei_ |
| Data Type: |
dei:edgarExchangeCodeItemType |
| Balance Type: |
na |
| Period Type: |
duration |
|
| X |
- DefinitionBoolean flag that is true when the Form 8-K filing is intended to satisfy the filing obligation of the registrant as soliciting material pursuant to Rule 14a-12 under the Exchange Act. Reference 1: http://www.xbrl.org/2003/role/presentationRef
-Publisher SEC
-Name Exchange Act
-Section 14a
-Number 240
-Subsection 12
| Name: |
dei_SolicitingMaterial |
| Namespace Prefix: |
dei_ |
| Data Type: |
xbrli:booleanItemType |
| Balance Type: |
na |
| Period Type: |
duration |
|
| X |
- DefinitionTrading symbol of an instrument as listed on an exchange.
| Name: |
dei_TradingSymbol |
| Namespace Prefix: |
dei_ |
| Data Type: |
dei:tradingSymbolItemType |
| Balance Type: |
na |
| Period Type: |
duration |
|
| X |
- DefinitionBoolean flag that is true when the Form 8-K filing is intended to satisfy the filing obligation of the registrant as written communications pursuant to Rule 425 under the Securities Act. Reference 1: http://www.xbrl.org/2003/role/presentationRef
-Publisher SEC
-Name Securities Act
-Number 230
-Section 425
| Name: |
dei_WrittenCommunications |
| Namespace Prefix: |
dei_ |
| Data Type: |
xbrli:booleanItemType |
| Balance Type: |
na |
| Period Type: |
duration |
|
Silica (NYSE:SLCA)
Historical Stock Chart
From Mar 2024 to Apr 2024

Silica (NYSE:SLCA)
Historical Stock Chart
From Apr 2023 to Apr 2024
