ADTRAN, Inc. (NASDAQ:ADTN) reported results for the first
quarter 2018. For the quarter, sales were $120.8 million compared
to $170.3 million for the first quarter of 2017. Net loss was $9.1
million compared to net income of $6.7 million for the first
quarter of 2017. Earnings per share, assuming dilution, were a loss
of $0.19 compared to income of $0.14 for the first quarter of 2017.
Non-GAAP earnings per share were a loss of $0.29 compared to income
of $0.18 for the first quarter of 2017. GAAP earnings per share
include the benefit of an acquisition-related bargain purchase
gain, as well as the expense of a restructuring program. The
reconciliation between GAAP earnings per share, diluted, and
non-GAAP earnings per share, diluted, is in the table provided.
ADTRAN Chairman and Chief Executive Officer Tom
Stanton stated, “As we expected, our performance this quarter
continued to be impacted by a merger-related review and slowdown in
the spending at a domestic Tier 1 customer. While our international
Tier 1 revenue exceeded expectations, lower overall product volumes
resulting from the domestic slowdown, coupled with restructuring
expenses and lower international gross margins, negatively affected
our profit margins for the quarter and further hampered our
results. Looking ahead, we expect continued strength in our
European business in the second quarter and a rebound in our North
American business in the second half. Our level of engagement with
domestic and international Tier 1 customers remains at all-time
highs, and our recent acquisition of the market leadership in EPON
for the North American cable/MSO market positions us for further
growth moving forward.”
The Company also announced that its Board of Directors declared
a cash dividend for the first quarter of 2018. The quarterly cash
dividend is $0.09 per common share to be paid to holders of record
at the close of business on May 2, 2018. The ex-dividend date is
May 1, 2018, and the payment date is May 16, 2018.
The Company confirmed that its first quarter conference call
will be held Wednesday, April 18, 2018, at 9:30 a.m. Central Time.
ADTRAN will webcast this conference. To listen, simply visit the
Investor Relations site at www.investors.adtran.com approximately
10 minutes prior to the start of the call and click on the
conference call link provided.
An online replay and transcript of the conference call will be
available on the Investor Relations site approximately 24 hours
following the call and will remain available for at least 12
months.
ADTRAN, Inc. is the leading global provider of networking and
communications equipment. ADTRAN’s products enable voice, data,
video and Internet communications across a variety of network
infrastructures. ADTRAN solutions are currently in use by service
providers, private enterprises, government organizations, and
millions of individual users worldwide. For more information,
please visit us at www.adtran.com, LinkedIn and Twitter.
For more information, contact the company at 256-963-8220 or via
email at investor.relations@adtran.com. On the Web,
visit www.adtran.com.
This press release contains forward-looking statements which
reflect management’s best judgment based on factors currently
known. However, these statements involve risks and uncertainties,
including the successful development and market acceptance of new
products, the degree of competition in the market for such
products, the product and channel mix, component costs,
manufacturing efficiencies, and other risks detailed in our annual
report on Form 10-K for the year ended December 31, 2017.
These risks and uncertainties could cause actual results to differ
materially from those in the forward-looking statements included in
this press release.
Condensed Consolidated Balance
Sheet
(Unaudited)
(In thousands)
March 31, December 31, 2018
2017 Assets Cash and cash equivalents $ 82,623 $
86,433 Short-term investments 16,402 16,129 Accounts receivable,
net 80,883 144,150 Other receivables 34,690 26,578 Inventory, net
120,021 122,542 Prepaid expenses and other current assets
9,693 17,282
Total Current Assets 344,312
413,114 Property, plant and equipment, net 83,875
85,079 Deferred tax assets, net 21,661 23,428 Goodwill 3,492 3,492
Other assets 32,635 13,725 Long-term investments 156,472
130,256
Total Assets $ 642,447 $
669,094 Liabilities and Stockholders' Equity
Accounts payable $ 50,653 $ 60,632 Unearned revenue 13,948 13,070
Accrued expenses 13,826 13,232 Accrued wages and benefits 15,863
15,948 Income tax payable 7,708 3,936
Total
Current Liabilities 101,998 106,818
Non-current unearned revenue 4,154 4,556 Other non-current
liabilities 34,590 34,209 Bonds payable 25,600 25,600
Total Liabilities 166,342 171,183
Stockholders' Equity 476,105
497,911 Total Liabilities and Stockholders'
Equity $ 642,447 $ 669,094
Consolidated Statements of
Income
(Unaudited)
(In thousands, except per share
data)
Three Months Ended March 31,
2018 2017 Sales Products
$ 105,253 $ 143,597 Services 15,553 26,682
Total
Sales 120,806 170,279 Cost of Sales
Products 68,612 76,664 Services 12,461 19,906
Total Cost of Sales 81,073 96,570 Gross
Profit 39,733 73,709 Selling, general and
administrative expenses 33,531 34,789 Research and development
expenses 32,849 31,971
Operating Income (Loss)
(26,647 ) 6,949 Interest and dividend income
866 933 Interest expense (132 ) (141 ) Net realized investment gain
1,991 470 Other income (expense), net (57 ) 134 Gain on bargain
purchase of a business 11,322 —
Income (loss)
before provision for income taxes (12,657 )
8,345 Provision for income taxes 3,521 (1,694
)
Net Income (Loss) $ (9,136 ) $
6,651 Weighted average shares outstanding – basic
48,232 48,430 Weighted average shares outstanding – diluted 48,292
48,939 Earnings per common share – basic $ (0.19 ) $ 0.14
Earnings per common share – diluted $ (0.19 ) $ 0.14
(1) Assumes exercise of dilutive stock
options calculated under the treasury stock method.
Consolidated Statements of
Comprehensive Income
(Unaudited)
(In thousands)
Three Months Ended March 31, 2018
2017 Net Income (Loss) $ (9,136 ) $
6,651
Other Comprehensive Income (Loss), net of tax Net
unrealized gains (losses) on available-for-sale securities (1,500 )
1,335 Net unrealized gains (losses) on cash flow hedges — 79
Defined benefit plan adjustments 62 55 Foreign currency translation
842 1,242
Other Comprehensive Income (Loss), net
of tax (596 ) 2,711
Comprehensive Income (Loss), net of tax $
(9,732 ) $ 9,362
Consolidated Statements of Cash
Flows
(Unaudited)
(In thousands)
Three Months Ended March 31, 2018
2017 Cash flows from operating activities: Net
income (loss) $ (9,136 ) $ 6,651 Adjustments to reconcile net
income to net cash provided by operating activities: Depreciation
and amortization 3,614 4,323 Amortization of net premium on
available-for-sale investments 42 124 Net realized gain on
long-term investments (1,991 ) (470 ) Net (gain) loss on disposal
of property, plant and equipment 67 (16 ) Gain on bargain purchase
of a business (11,322 ) — Stock-based compensation expense 1,819
1,883 Deferred income taxes (1,332 ) (1,947 ) Changes in operating
assets and liabilities: Accounts receivable, net 63,904 7,247 Other
receivables (6,164 ) 1,884 Inventory 3,368 (7,399 ) Prepaid
expenses and other assets 10,583 (2,413 ) Accounts payable (10,233
) (1,713 ) Accrued expenses and other liabilities 826 (3,166 )
Income tax payable 2,184 4,049
Net cash provided
by operating activities 46,229
9,037 Cash flows from investing activities:
Purchases of property, plant and equipment (1,950 ) (3,872 )
Proceeds from disposals of property, plant and equipment — 16
Proceeds from sales and maturities of available-for-sale
investments 49,074 24,471 Purchases of available-for-sale
investments (75,960 ) (29,517 ) Acquisition of business
(7,806 ) —
Net cash used in investing activities
(36,642 ) (8,902 )
Cash flows from financing activities: Proceeds from stock
option exercises 369 1,377 Purchases of treasury stock (10,171 )
(5,559 ) Dividend payments (4,367 ) (4,369 )
Net
cash used in financing activities (14,169
) (8,551 ) Net decrease in cash
and cash equivalents (4,582 ) (8,416 ) Effect of exchange rate
changes 772 1,079
Cash and cash equivalents, beginning of
period 86,433 79,895 Cash
and cash equivalents, end of period $ 82,623
$ 72,558 Supplemental disclosure of non-cash
investing activities: Purchases of property, plant and equipment
included in accounts payable $ 95 $ 509
Supplemental Information
Restructuring Expenses
(Unaudited)
(In thousands)
Restructuring expense was recorded in the
following Consolidated Statements of Income categories for the
three months ended March 31, 2018 and 2017:
Three Months Ended March 31, 2018
2017 Restructuring expense included in cost
of sales $ 2,370 $ —
Selling, general and administrative expense 1,766 — Research and
development expense 1,814 —
Restructuring expense
included in operating expenses 3,580
— Total restructuring expense 5,950
— Provision for income taxes (1,547 ) —
Total restructuring expense, net of tax $
4,403 $ —
Supplemental Information
Acquisition Related Expenses,
Amortizations and Adjustments
(Unaudited)
(In thousands)
On August 4, 2011, we closed on the
acquisition of Bluesocket, Inc., on May 4, 2012, we closed on the
acquisition of the Nokia Siemens Networks Broadband Access business
(NSN BBA), on September 13, 2016, we closed on the acquisition of
CommScope’s active fiber business (CommScope), and on March 19,
2018, we closed on the acquisition of Sumitomo Electric Lightwave
Corp.’s North American EPON business (Sumitomo). Acquisition
related expenses, amortizations and adjustments for the three
months ended March 31, 2018 and 2017 for all four transactions
are as follows:
Three Months Ended March 31, 2018
2017 Bluesocket, Inc. acquisition Amortization of
acquired intangible assets $ 158 $ 158 NSN BBA acquisition
Amortization of acquired intangible assets 92 208 Amortization of
other purchase accounting adjustments — 28
Subtotal - NSN BBA acquisition 92 236
CommScope acquisition Amortization of acquired intangible assets
125 686 Amortization of other purchase accounting adjustments 1 50
Acquisition related professional fees, travel and other expenses
— 8
Subtotal - CommScope acquisition
126 744 Sumitomo acquisition
Amortization of acquired intangible assets 110 — Acquisition
related professional fees, travel and other expenses 97
—
Subtotal - Sumitomo acquisition 207
— Total acquisition related expenses,
amortizations and adjustments 583 1,138 Provision
for income taxes (156 ) (425 )
Total acquisition
related expenses, amortizations and adjustments, net of tax
$ 427 $ 713
The acquisition related expenses, amortizations and adjustments
above were recorded in the following Consolidated Statements of
Income categories for the three months ended March 31, 2018
and 2017:
Three Months Ended March 31,
2018 2017 Cost of goods sold
$ 59 $ 50 Selling, general and
administrative expenses 266 62 Research and development expenses
258 1,026
Total acquisition related expenses,
amortizations and
adjustments included in operating
expenses
524 1,088 Total acquisition related
expenses, amortizations and adjustments 583 1,138
Provision for income taxes (156 ) (425 )
Total
acquisition related expenses, amortizations and adjustments, net of
tax $ 427 $ 713
Supplemental Information
Stock-based Compensation
Expense
(Unaudited)
(In thousands)
Three Months Ended March 31, 2018
2017 Stock-based compensation expense
included in cost of sales $ 95 $ 91
Selling, general and administrative expense 1,035 1,016
Research and development expense 689 776
Stock-based compensation expense included in operating
expenses 1,724 1,792
Total stock-based compensation expense 1,819
1,883 Tax benefit for expense associated with non-qualified
options, PSUs,
RSUs and restricted stock
(384 ) (380 )
Total stock-based
compensation expense, net of tax $ 1,435 $
1,503
Reconciliation of GAAP net income per
share, diluted, to
Non-GAAP net income per share,
diluted
(Unaudited)
Three Months Ended March 31, 2018
2017 GAAP earnings per common share -
diluted $ (0.19 ) $ 0.14
Restructuring expense 0.09 — Acquisition related expenses,
amortizations and adjustments 0.01 0.01 Stock-based compensation
expense 0.03 0.03 Gain on bargain purchase of a business
(0.23 ) —
Non-GAAP earnings per common share -
diluted $ (0.29 ) $ 0.18
View source
version on businesswire.com: https://www.businesswire.com/news/home/20180417006767/en/
ADTRAN, Inc.Gloria Brown,
256-963-8220investor.relations@adtran.com
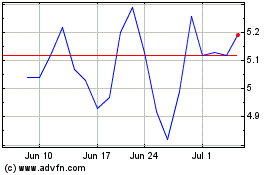
ADTRAN (NASDAQ:ADTN)
Historical Stock Chart
From Aug 2024 to Sep 2024

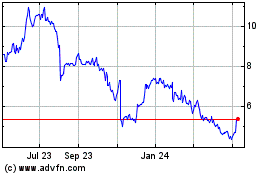
ADTRAN (NASDAQ:ADTN)
Historical Stock Chart
From Sep 2023 to Sep 2024
