Azimut Exploration Inc. (“Azimut” or the
“Company”) (
TSXV: AZM)
(
OTCQX: AZMTF) is pleased to announce the
commencement of a diamond drilling program that will focus on the
recently discovered high-grade antimony
corridor (the “
Fortin Zone”) on its
wholly-owned Wabamisk Property
(the “Property”) in the Eeyou Istchee James Bay (“James Bay”)
region of Quebec (see Figures 1 to 4).
Azimut is proceeding with a
5,000-metre diamond drilling program to assess the
corridor’s strike and grade continuity. An initial 2,000-metre
phase will be completed before the end of the year. Contingent on
positive results, the remaining 3,000 metres of drilling will be
carried out in early 2025. With approximately $9 million in its
treasury, the Company is fully funded for this drill program.
The discovery of a high-grade antimony system in
Quebec presents a rare opportunity, given the commodity's status as
a critical mineral and the current risk of
a supply shortage (see explanation below).
As previously disclosed (see press release of
October 29, 2024), the 2024 prospecting program has revealed an
antimony-rich system demonstrated by channel
samples (3.92% Sb over 14.0 m) and numerous
high-grade grab samples (up to 24.8%
Sb) collected along a 1.2-kilometre-long strike within the
Fortin Zone. Gold (up to
7.27 g/t Au in grabs) commonly accompanies antimony.
Note that grab samples are selective by nature and unlikely to
represent average grades.
Geoscientific data support a
minimum 3.5-kilometre length for the
antimony-gold exploration corridor. The corridor is
related to an extensive shear zone between a thick metasedimentary
unit to the north (the Auclair Formation) and a mafic volcanic
package to the south (the Natel Formation). It is marked by a
strong antimony footprint in lake sediments, till and soil. The
antimony showings (grades higher than 0.5% Sb) correlate well with
induced polarization (“IP”) chargeability anomalies and an axis of
moderate magnetic intensity. The spatial distribution of the
showings suggests a 30-metre-wide envelope for the mineralized
zone.
A recently completed high-resolution magnetic
heliborne survey (381 line-km covering 1 km by 8 km at
25-metre line spacing) further defines the extent of the target
zone. A string of magnetic anomalies, well correlated with antimony
showings and IP anomalies, highlights the priority targets to be
drilled during the current program (see Figures 5 and 6).
About Antimony
Supply shortage riskAntimony is
listed as a critical mineral by the Canadian and United States
governments and the European Commission. Five countries account for
about 91% of the world's production, estimated to be 83,000 tonnes
in 2023, including China (48.2%) and Tajikistan (25.3%). Antimony
is not currently mined in Canada or the United States. In
August 2024, China imposed restrictions on the export of antimony,
which led to a significant export reduction in October, increasing
the risk of supply disruptions. Prices have risen sharply since the
beginning of the year, reaching an all-time high of approximately
US$34,000 per tonne for antimony metal on the international market
in November. For comparative purposes, copper averaged about
US$9,500 per tonne in November.
Mineral deposit types and
gradesMost antimony deposits occur in clastic siliceous
sedimentary rocks with significant fault and fracture systems.
Stibnite is the most common ore mineral. The main deposit types
correspond to hydrothermal systems with antimony as the primary
commodity or as a byproduct in gold deposits. Quartz-stibnite and
replacement deposits account for most of the current mining
production. These deposits typically form the peripheral parts of
orogenic and intrusion-related gold deposits. Representative
examples include Xikuangshan in China (mining reserves of
11.5 Mt at 3.5% Sb in 1980) and Sarylakh in Russia (resources
of 2.17 Mt at 6% Sb and 6 g/t Au). Canadian examples include Beaver
Brook in Newfoundland and Lake George in New Brunswick. The classic
example of an Archean deposit is the past-producing Consolidated
Murchison mine in South Africa. The above tonnage and grade
references are historical and do not correspond to National
Instrument 43-101 standards. This section's main source of
information is USGS Professional Paper 1802-C (2017).
About the Wabamisk Property
Wabamisk is a wholly-owned project (39.5 km
by 9.2 km) comprising 544 claims covering 287.9 km2. It lies
13 km east of the Clearwater Property (Fury Gold Mines),
42 km northeast of the Whabouchi lithium deposit (Nemaska
Lithium), and 70 km south of the Eleonore gold mine (Newmont).
Major powerlines pass through or close to the property’s eastern
end, and the North Road highway passes 37 km to the south. The
nearest town is Nemaska, a Cree village municipality 55 km to
the southwest.
Geophysics and Drilling Contracts,
Analytical Protocols and Management
Novatem Inc., based in Mont-Saint-Hilaire,
Quebec, carried out the magnetic heliborne survey. Nouchimi / RJLL
Drilling Inc. of Rouyn-Noranda, Quebec, has been contracted to
conduct the drilling program using an NQ core diameter.
Samples are sent to ALS Laboratories in Val-d’Or
(Quebec), where gold is analyzed by fire assay with atomic
absorption and gravimetric finishes for grades above 3.0 g/t Au.
Samples are also analyzed for a 48-element suite using ICP.
Overlimit antimony assays (1%) are reanalyzed using four-acid
digestion and ICP-AES. Azimut applies industry-standard QA/QC
procedures to its drilling programs. All batches sent for analysis
include certified reference materials, blanks and field
duplicates.
The project is under the direction of Alain
Cayer (P.Geo.), Project Manager.
Qualified Person
Dr. Jean-Marc Lulin (P.Geo.), Azimut’s President
and CEO, has prepared this press release and approved the
scientific and technical information disclosed herein, acting as
the Company’s qualified person within the meaning of National
Instrument 43-101.
About Azimut
Azimut is a leading mineral exploration company
with a solid reputation for target generation and partnership
development. The Company holds the largest mineral exploration
portfolio in Quebec, controlling strategic land positions for
copper-gold, nickel and lithium. Its wholly owned flagship project,
the Elmer Gold Project, is at the resource stage
(311,200 oz Indicated; 513,900 oz
Inferred*) and has a strong exploration upside. Azimut is
also advancing the Galinée lithium discovery with
its joint venture partner SOQUEM Inc.
Azimut uses a pioneering approach to big data
analytics (the proprietary AZtechMine™ expert
system) enhanced by extensive exploration know-how. The Company’s
competitive edge is based on systematic regional-scale data
analysis. Azimut maintains rigorous financial discipline and a
strong balance sheet, with 85.6 million shares issued and
outstanding.
Contact and Information
Jean-Marc Lulin, President and
CEOTel.: (450) 646-3015 – Fax: (450) 646-3045
Jonathan Rosset, Vice President Corporate
DevelopmentTel.: (604)
202-7531info@azimut-exploration.com www.azimut-exploration.com
_____________________________________________________________________________________
* “Technical Report and Initial Mineral Resource
Estimate for the Patwon Deposit, Elmer Property, Quebec, Canada”,
prepared by: Martin Perron, P.Eng., Chafana Hamed Sako, P.Geo.,
Vincent Nadeau-Benoit, P.Geo. and Simon Boudreau, P.Eng. of
InnovExplo Inc., dated January 4, 2024.
Cautionary note regarding
forward-looking statements
Cautionary note regarding forward-looking
statements. This press release contains forward-looking statements,
which reflect the Company’s current expectations regarding future
events related to the drilling results from the Wabamisk Property.
To the extent that any statements in this press release contain
information that is not historical, the statements are essentially
forward-looking and are often identified by words such as
“consider”, “anticipate”, “expect”, “estimate”, “intend”,
“project”, “plan”, “potential”, “suggest” and “believe”. The
forward-looking statements involve risks, uncertainties, and other
factors that could cause actual results to differ materially from
those expressed or implied by such forward-looking statements. Many
factors could cause such differences, particularly volatility and
sensitivity to market metal prices, the impact of changes in
foreign currency exchange rates and interest rates, imprecision in
reserve estimates, recoveries of gold and other metals,
environmental risks including increased regulatory burdens,
unexpected geological conditions, adverse mining conditions,
community and non-governmental organization actions, changes in
government regulations and policies, including laws and policies,
global outbreaks of infectious diseases, including COVID-19, and
failure to obtain necessary permits and approvals from government
authorities, as well as other development and operating risks.
Although the Company believes that the assumptions inherent in the
forward-looking statements are reasonable, undue reliance should
not be placed on these statements, which only apply as of the date
of this document. The Company disclaims any intention or obligation
to update or revise any forward-looking statement, whether as a
result of new information, future events or otherwise, other than
as required to do so by applicable securities laws. The reader is
directed to carefully review the detailed risk discussion in our
most recent Annual Report filed on SEDAR+ for a fuller
understanding of the risks and uncertainties that affect the
Company’s business. Neither TSX Venture Exchange nor its Regulation
Services Provider (as that term is defined in the policies of the
TSX Venture Exchange) accepts responsibility for the adequacy or
accuracy of this release.
Neither TSX Venture Exchange nor its Regulation
Services Provider (as that term is defined in the policies of the
TSX Venture Exchange) accepts responsibility for the adequacy or
accuracy of this release.
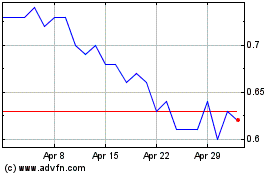
Azimut Exploration (TSXV:AZM)
Historical Stock Chart
From Dec 2024 to Jan 2025

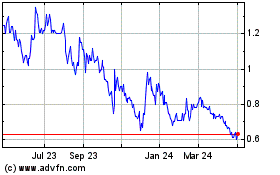
Azimut Exploration (TSXV:AZM)
Historical Stock Chart
From Jan 2024 to Jan 2025
