Archer Daniels Closed at 52-Week High - Analyst Blog
May 08 2013 - 12:47PM
Zacks
Archer Daniels Midland Company’s (ADM) shares
reached a new 52-week high of $34.34 on Tuesday, May 7. Closing at
its 52-week high mark, the world’s leading food processing company
gained about 1.4% from the previous day’s session, and generated a
year-to-date return of approximately 20.5%.
This Zacks Rank #3 (Hold) company currently trades at a forward P/E
of 14.26x, a 2.8% premium to the peer group average of 13.87x. The
average volume of shares traded over the last 3 months is
approximately 4,750K.
We believe that Archer Daniels’ consistent focus on enhancing its
processing capabilities and global footprints through strategic
acquisitions and joint ventures (JV) are the major forces that
drove the company’s shares to the new high.
Recently, Archer Daniels completed the due diligence for its
proposed acquisition of GrainCorp Limited. In accordance with the
takeover implementation deed entered last week, the company now
proposes to pay A$12.20 per share in cash for all outstanding
shares of GrainCorp, with the aggregate transaction value amounting
to A$3.4 billion.
Archer Daniels’ interest in acquiring GrainCorp is in sync with its
ongoing portfolio management initiative. The company’s strategy
focuses on expanding its Agricultural Services and Oilseeds
businesses across the globe by investing in key supply areas beyond
national borders.
Apart from making way for the company’s strategy of solidifying its
global footprint in the key agricultural regions, the buyout is
expected to help Archer Daniels to fortify its financial
position.
Simultaneously, companies such as Nordstrom Inc.
(JWN), V.F. Corp. (VFC) and Whirlpool
Corp. (WHR) achieved new 52-week highs of $58.66, $180.01
and $122.65, respectively, on Tuesday, May 7.
ARCHER DANIELS (ADM): Free Stock Analysis Report
NORDSTROM INC (JWN): Free Stock Analysis Report
V F CORP (VFC): Free Stock Analysis Report
WHIRLPOOL CORP (WHR): Free Stock Analysis Report
To read this article on Zacks.com click here.
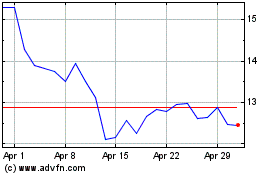
VF (NYSE:VFC)
Historical Stock Chart
From Jun 2024 to Jul 2024

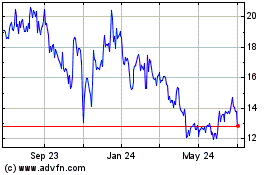
VF (NYSE:VFC)
Historical Stock Chart
From Jul 2023 to Jul 2024
