Core Labs Beats Q3 Earnings Estimates - Analyst Blog
October 17 2013 - 10:38AM
Zacks
Oilfield service company Core Laboratories NV
(CLB) reported excellent financial result in third-quarter 2013.
The record performances – revenue, earnings and net income – were
primarily on the back of the production enhancement segment, which
benefited from employment of new technologies and associated
services.
Adjusted earnings per share (EPS) came in at $1.36, surpassing the
Zacks Consensus Estimate of $1.34. Moreover, the bottom line
increased 20.4% as compared with a profit of $1.13 per share in the
year-ago quarter. The year over year EPS hike is the highest in the
last five quarters.
Total revenue was $273.2 million, up 11.3% from $245.4 million in
the prior-year quarter. The top line also came ahead of the Zacks
Consensus Estimate of $267.0 million.
Segment Performance
Reservoir Description Segment: Revenues from the
Reservoir Description segment (which focuses on international crude
oil related projects) increased 5.9% year over year to $131.5
million in the third quarter. However, adjusted operating income
from the unit decreased marginally by 1.0% year over year to $36.2
million. Operating margin was 28.0%. Increased general and
administrative expenses hurt the operating result.
Production Enhancement Segment: Core Labs’
Production Enhancement revenues grew 18.5% year over year to $119.5
million in the quarter and adjusted operating income increased
37.7% year over year to $42.6 million. Operating margin was 36.0%.
Maximization of the recovery rates of hydrocarbon from
unconventional oil plays in North America, owing to the successful
employment of improved technologies, aided the results.
Reservoir Management Segment: Quarterly revenues
from Reservoir Management operations were $22.1 million, up 8.4%
year over year, while adjusted operating income moved up 9.0% year
over year to $6.5 million. Operating margin was 29.0%.
The primary catalysts for the segment were impressive study
results that have attracted many projects. Core Labs has undertaken
a number of reservoir analysis ventures in onshore and offshore
plays, which boosted the segment’s results.
Balance Sheet & Free Cash Flow
As of Sep 30, 2013, Core Labs had cash and cash equivalents of
$22.2 million. Capital expenditures for the third quarter were $9.1
million. The company generated free cash flow of $65.1 million. The
debt-to-capitalization ratio of the company is 58.1%,
Quarterly Dividend
On Oct 8, 2013, Core Labs’ board of directors declared
fourth-quarter 2013 common stock dividend of 32 cents per share
($1.28 per share annualized). The dividend will be paid on Nov 20,
to shareholders of record as of Oct 18.
Outlook
Amsterdam, the Netherlands-based Core Labs provided a positive
outlook for 2014, reflecting the favorable Brent crude pricing
along with the arrival of additional deepwater drilling rigs. These
will enable the company to take up new projects and operate in
other rich oil and gas acreages. Core Labs also plans to use
advanced technologies and add services aimed at boosting the daily
production and hydrocarbon recovery rates.
For the fourth quarter, Core Labs forecasts total revenue in the
$278.0 million to $281.0 million range. Earnings per share will
likely be between $1.39 and $1.40.
Zacks Rating
Core Labs currently retains a Zacks Rank #2 (Buy), implying that it
is expected to outperform the broader U.S. equity market over the
next one to three months.
Apart from Core Labs one can look at other oilfield service firms
like Exterran Holdings Inc. (EXH),
Schlumberger Ltd (SLB) and Seacor Holdings
Inc. (CKH) that offer value. All the stocks sport a Zacks
Rank #2 (Buy).
SEACOR HLDGS (CKH): Get Free Report
CORE LABS NV (CLB): Free Stock Analysis Report
EXTERRAN HLDGS (EXH): Free Stock Analysis Report
SCHLUMBERGER LT (SLB): Free Stock Analysis Report
To read this article on Zacks.com click here.
Zacks Investment Research
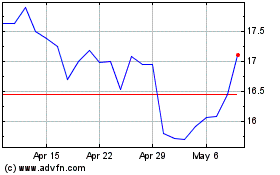
Core Laboratories (NYSE:CLB)
Historical Stock Chart
From Jun 2024 to Jul 2024

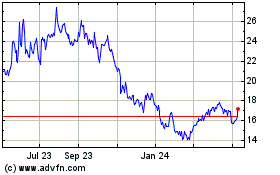
Core Laboratories (NYSE:CLB)
Historical Stock Chart
From Jul 2023 to Jul 2024
