false 0001316835 0001316835 2023-12-05 2023-12-05
UNITED STATES
SECURITIES AND EXCHANGE COMMISSION
Washington, D.C. 20549
FORM 8-K
CURRENT REPORT
Pursuant to Section 13 or 15(d)
of the Securities Exchange Act of 1934
Date of Report (Date of earliest event reported): December 5, 2023
BUILDERS FIRSTSOURCE, INC.
(Exact Name of Registrant as Specified in its Charter)
|
|
|
|
|
| Delaware |
|
001-40620 |
|
52-2084569 |
| (State or Other Jurisdiction of Incorporation) |
|
(Commission File Number) |
|
(IRS Employer Identification No.) |
6031 Connection Drive, Suite 400, Irving, Texas 75039
(Address of Principal Executive Offices)
(214) 880-3500
(Registrant’s telephone number, including area code)
Check the appropriate box below if the Form 8-K filing is intended to simultaneously satisfy the filing obligation of the registrant under any of the following provisions:
| |
☐ |
Written communications pursuant to Rule 425 under the Securities Act (17 CFR 230.425) |
| |
☐ |
Soliciting material pursuant to Rule 14a-12 under the Exchange Act (17 CFR 240.14a-12) |
| |
☐ |
Pre-commencement communications pursuant to Rule 14d-2(b) under the Exchange Act (17 CFR 240.14d-2(b)) |
| |
☐ |
Pre-commencement communications pursuant to Rule 13e-4(c) under the Exchange Act (17 CFR 240.13e-4(c)) |
Securities registered pursuant to Section 12(b) of the Act:
|
|
|
|
|
| Title of Each Class |
|
Trading Symbol(s) |
|
Name of Each Exchange on Which Registered |
| Common stock, par value $0.01 per share |
|
BLDR |
|
New York Stock Exchange |
Indicate by check mark whether the registrant is an emerging growth company as defined in Rule 405 of the Securities Act of 1933 (§ 230.405 of this chapter) or Rule 12b-2 of the Securities Exchange Act of 1934 (§ 240.12b-2 of this chapter).
Emerging growth company ☐
If an emerging growth company, indicate by check mark if the registrant has elected not to use the extended transition period for complying with any new or revised financial accounting standards provided pursuant to Section 13(a) of the Exchange Act. ☐
ITEM 7.01. Regulation FD
Builders FirstSource, Inc. (the “Company”) is hosting an Investor Day on December 5, 2023 at 8:30 a.m. Eastern Time (7:30 a.m. Central Time) in Atlanta, Georgia. A copy of the presentation materials to be used by the Company at its Investor Day is furnished as Exhibit 99.1 to this Current Report on Form 8-K and is incorporated in Item 7.01 of this Current Report by this reference. The presentation materials will also be available on the Company’s website at investors.bldr.com under the “Events & Presentations” tab.
The information contained in this Item 7.01, including the information set forth in the presentation materials furnished as Exhibit 99.1 to, and incorporated in, this Current Report, is being “furnished” and shall not be deemed “filed” for the purposes of Section 18 of the Securities Exchange Act of 1934, as amended (the “Exchange Act”), or otherwise subject to the liabilities of Section 18. The information in Exhibit 99.1 furnished pursuant to this Item 7.01 shall not be incorporated by reference into any registration statement or other documents pursuant to the Securities Act of 1933, as amended, or into any filing or other document pursuant to the Exchange Act except as otherwise expressly stated in any such filing.
ITEM 9.01. Financial Statements and Exhibits.
(d) Exhibits.
SIGNATURES
Pursuant to the requirements of the Securities Exchange Act of 1934, the Registrant has duly caused this Report to be signed on its behalf by the undersigned hereunto duly authorized.
|
|
|
|
|
| BUILDERS FIRSTSOURCE, INC. |
|
|
| By: |
|
/s/ Timothy D. Johnson |
|
|
Name: |
|
Timothy D. Johnson |
|
|
Title: |
|
Executive Vice President, General Counsel and Corporate Secretary |
Dated: December 5, 2023

Exhibit 99.1 OUTPERFORM TODAY. TRANSFORM TOMORROW. Investor Day 2023 A T
L A N T A , G A 1 2 . 0 5 . 2 3

Welcome and Opening Remarks HEATHER KOS • SVP, Investor Relations
I N V E S T O R D A Y 2 0 2 3 – © B U I L D E R S F I R S T S O U R C E 2

Safe Harbor and Non-GAAP Financial Measures Cautionary Notice Statements
in this presentation and the schedules hereto that are not purely historical facts or that necessarily depend upon future events, including statements about expected market share gains, forecasted financial performance or other statements about
anticipations, beliefs, expectations, hopes, intentions or strategies for the future, may be forward-looking statements within the meaning of Section 21E of the Securities Exchange Act of 1934, as amended. In addition, oral statements made by our
directors, officers and employees to the investor and analyst communities, media representatives and others, depending upon their nature, may also constitute forward-looking statements. All forward-looking statements are based upon currently
available information and the Company’s current assumptions, expectations and projections about future events. Readers are cautioned not to place undue reliance on forward-looking statements. Forward-looking statements are by nature inherently
uncertain, and actual results or events may differ materially from the results or events described in the forward-looking statements as a result of many factors. Builders FirstSource, Inc. undertakes no obligation to publicly update or revise any
forward-looking statements, whether as a result of new information, future events or otherwise. Any forward-looking statements involve risks and uncertainties, many of which are beyond the Company’s control or may be currently unknown to the
Company, that could cause actual events or results to differ materially from the events or results described in the forward-looking statements, including risks or uncertainties related to the Company’s growth strategies, including
acquisitions, organic growth and digital strategies, or the dependence of the Company’s revenues and operating results on, among other things, the homebuilding industry and, to a lesser extent, repair and remodel activity, which in each case
is dependent on economic conditions, including inflation, interest rates, consumer confidence, labor and supply shortages, and also lumber and other commodity prices. Builders FirstSource, Inc. may not succeed in addressing these and other risks.
Further information regarding factors that could affect our financial and other results can be found in the risk factors section of Builders FirstSource, Inc.’s most recent annual report on Form 10-K filed with the Securities and Exchange
Commission (“SEC”) and may also be described from time to time in the other reports the Company files with the SEC. Consequently, all forward-looking statements in this release are qualified by the factors, risks and uncertainties
contained therein. Use of Non-GAAP Financial Measures This presentation includes financial measures and terms not calculated in accordance with accounting principles generally accepted in the United States (“GAAP”) in order to provide
investors with an alternative method for assessing our operating results in a manner that enables investors to more thoroughly evaluate our current performance as compared to past performance. We believe these non-GAAP measures provide investors
with a better baseline for modeling our future earnings expectations. Our management uses these non-GAAP measures for the same purpose. We believe that our investors should have access to the same set of tools that we use in analyzing our results.
These non-GAAP measures should be considered in addition to results prepared in accordance with GAAP, but should not be considered a substitute for or superior to GAAP results. Our calculations of adjusted net income, adjusted net income per share,
adjusted EBITDA, free cash flow and net leverage are not necessarily comparable to similarly titled measures reported by other companies. The company provided detailed explanations and reconciliations of these non-GAAP financial measures in the
earnings release included in its Form 8-K filed with the Securities and Exchange Commission on November 1, 2023. I N V E S T O R D A Y 2 0 2 3 – © B U I L D E R S F I R S T S O U R C E 3

Today’s Agenda Welcome and Opening Remarks Elevating Commercial
Excellence 8:30 AM 10:10 AM HEATHER KOS • SVP, Investor Relations MIKE FARMER • President, Commercial Operations Differentiated, Established Market Leader Accelerating Industry-Leading DAVE RUSH • President & Chief Executive
Officer Digital Offerings TIM PAGE • EVP, Digital Solutions Driving Operational Excellence: Financial Excellence and Long-Term Targets Winning Together as PETER JACKSON • Chief Financial Officer STEVE HERRON • Chief Operating
Officer Closing Remarks Delivering Sustainability While Continuing DAVE RUSH • President & Chief Executive Officer to Build Our High-Performing Culture TIM JOHNSON • EVP, Legal, Safety & ESG AMY BASS MESSERSMITH • Chief
People Officer Q&A 1 Q&A 11:30 AM Depart for Automated Truss Facility Tour 10:00 AM Break In-person Attendees: Digital Product Demonstrations Available 1 Boxed lunches to be provided for in-person attendees. I N V E S T O R D A Y 2 0 2 3
– © B U I L D E R S F I R S T S O U R C E 4

Differentiated, Established Market Leader DAVE RUSH • President
& Chief Executive Officer I N V E S T O R D A Y 2 0 2 3 – © B U I L D E R S F I R S T S O U R C E 5

Key Messages Creating opportunity by addressing builder problems and 1
delivering value-added products and solutions across cycles; strong track record and experienced management team Investing for growth through new digital innovations and 2 building science that will deliver greater efficiency across homebuilding and
enhance product and service offerings Leveraging robust FCF generation from resilient 3 business model and broad product portfolio to fuel disciplined capital deployment Executing our profitable growth strategy and 4 compounding long-term
shareholder value * Non-GAAP financial measures; see Appendix for reconciliations to the most directly comparable GAAP financial measures. I N V E S T O R D A Y 2 0 2 3 – © B U I L D E R S F I R S T S O U R C E 6

Builders FirstSource Snapshot (NYSE: BLDR) KEY STATS NATIONAL REACH.
LOCAL EXPERTISE. Irving, TX ~$16.5B ~30K $16.8 – 17.1B $2.7 – 2.8B $1.8 – 2.0B 1 2 2 2 2 Headquarters Market-Cap Employees Net Sales Adj. EBITDA FCF ~51% Value-Added 20% Product Mix 24% 24% Product 2023E Net Sales End Locations:
13% Category Market Truss 67% Breakdown Millwork 25% 27% Yard ~570 89 48 43 Specialty Building Products & Services Single-Family Locations of Top 100 of Top 50 States Lumber & Lumber Sheet Goods Multi-Family (>280 Value-Added MSAs Served
MSAs Served Served Manufactured Products Repair & Remodel / Other 3 Product Operations ) Windows, Doors & Millwork Largest U.S. Supplier of Building Products, Prefabricated Components, and Value-Added Services to the Professional Builder 1 2
3 Source: FactSet as of 11/17/2023. 2023 estimate as provided on Q3 2023 earnings call on 11/1/23. Includes components (truss & wall panel) and millwork operations. * Non-GAAP financial measures; see Appendix for reconciliations to the most
directly comparable GAAP financial measures. I N V E S T O R D A Y 2 0 2 3 – © B U I L D E R S F I R S T S O U R C E 7

Company History – Respect the Past, Embrace the Future Builders
FirstSource BFS and BMC Acquired WTS Successfully acquired ProBuild, merge, creating nation’s Paradigm, a software Builders’ Supply navigated creating a national premier supplier of building solutions and services & Lumber Co. Great
Recession professional dealer with materials and services, provider for the building acquired by and housing market ~400 locations across operating ~550 locations products industry – major JLL Partners collapse 40 states across 40 states step
in digital journey 1998 2008 – 2011 JUL 2015 JAN 2021 AUG 2021 2005 2012 DEC 2015 JULY 2021 SINCE 2021 INVESTOR DAY Completed listing Commenced Exceeded $1B in Stock Building Supply revenues for first time transfer to NYSE IPO of Builders
completed merger with BMC, 14 Tuck-in Acquisitions in 5 years FirstSource on Nasdaq to form BMC Stock Holdings to further expand national reach and capabilities Continuing to Take Transformative Actions to Accelerate Our Lead I N V E S T O R D A Y 2
0 2 3 – © B U I L D E R S F I R S T S O U R C E 8

Our Mission, Vision, and Values MISSION VALUES VISION To be the best
supplier of At the center of everything we do – from the boardroom to the To make the dream of home building materials and jobsite, they define the Builders FirstSource culture and guide ownership more achievable services by having a people-
our priorities, decisions, and actions with a focus on S.P.I.C.E. for everyone, positioning first culture, exceptional Builders FirstSource as the customer service, and most valuable partner in innovative solutions that the industry create superior
value SAFETY PEOPLE INTEGRITY CUSTOMERS EXCELLENCE for stakeholders We make We lead with We are We deliver We challenge safety our a people-first honest exceptional the status quo top priority culture and reliable customer service Outperform Today.
Transform Tomorrow. I N V E S T O R D A Y 2 0 2 3 – © B U I L D E R S F I R S T S O U R C E 9

Since 2021 Investor Day, We Continue to Transform the Homebuilding
Industry Key Accomplishments ▪ Delivered organic sales growth and Continued Leadership Focus margin expansion ▪ Support BFS’ exceptional leadership team with ▪ Drove strong M&A execution and track record an average of
>30 years industry experience per ▪ Accelerated digital transformation field leader, providing deep bench strength ▪ Foster commercial and operational excellence Transformative Actions Underway ▪ Drive continued growth of
value-added solutions, ▪ Diversifying value-added products and services driving sustained double-digit Adjusted EBITDA ▪ Evolving and improving product mix with a focus on margins with less reliance on lumber digital tools and
capabilities ▪ Maintain fortress balance sheet and compound ▪ Investing in manufacturing automation ($130M since value through disciplined capital allocation 2020) to drive operational excellence and address labor challenges Consistent
and Clear Strategy to Compound Shareholder Value * Non-GAAP financial measures; see Appendix for reconciliations to the most directly comparable GAAP financial measures. I N V E S T O R D A Y 2 0 2 3 – © B U I L D E R S F I R S T S O U R
C E 10

Well-Positioned for Above-Market Growth in the Future 1,2 $16.8-17.1B
BLDR 2023E Revenue Total Addressable Market ( % BLDR Share) Positive Momentum and Clear Path Toward Additional Share Gains Driven by Growing wallet share with 1 existing customers ~11% ~1% ~2% ~$110B ~$140B 2 Expanding product offerings 3 ~$175B
Single-Family Multi- 5 R&R U.S. New Construction 4 Family Building Materials Increasing value-added products 3 Capturing market share in 4 under-penetrated geographies 13% 13% 5 Delivering our digital solutions 67% 2023E Revenue 2023E Revenue
2023E Revenue 1 2 2023 estimate as provided on Q3 2023 earnings call on 11/1/23. Percent of 2023E Revenue will not foot to 100% for Single-Family, Multi-Family and R&R because Other is not included. 3 Source: TAM generated using U.S. Census,
Dodge, HIRI, and Company estimates of all building materials and not just the products that we sell; ~$134k assumed materials cost per home based on 4 5 Company estimates as of November 2023. Share is based on TTM September 2023 Company sales.
Source: DODGE; TTM estimate as of November 2023. Source: HIRI estimate for Professional Repair & Remodel; TTM estimate as of November 2023. I N V E S T O R D A Y 2 0 2 3 – © B U I L D E R S F I R S T S O U R C E 11

Long-Term Housing Tailwinds Remain Supportive Housing Starts (000s) YoY
Growth in Households (000s) Housing Starts Cumulative Underbuilt Homes By 2022 Population Estimates, Only 10.4% of the 3,500 Cohort Aged 25-34 Are Homeowners 2,550 3,000 2,150 Underbuilt by ~1.7M – 3.5M 2,500 1,750 20-year Average Homes Since
2010 2,000 1,350 1,500 950 1,000 550 500 150 0 (250) Annual Average Rate on 30-year Fixed-Rate Mortgages (%) Demographic and Economic Factors 10.0 ▪ Homes have been underbuilt by ~1.7M – 3.5M since 2010, creating 9.0 a long-term tailwind
8.0 25-year Average 7.0 ▪ Current interest rates are elevated relative to historical averages, 6.0 delaying household formation 5.0 4.0 ▪ Existing home inventory for sale at a historic low, driving home 3.0 buyers to new build 2.0 1.0
▪ Strong case for housing to have room to run if we can be more efficient as an industry 1 Source: U.S. Census and MortgageNewsDaily, Evercore ISI Research, management estimates. As of 11/17/2023 the 30YR FRM was 7.37% sourced from
MortgageNewsDaily.com. I N V E S T O R D A Y 2 0 2 3 – © B U I L D E R S F I R S T S O U R C E 12 1998 1999 2003 2000 2004 2001 2005 2002 2006 2003 2007 2004 2005 2008 2006 2009 2007 2010 2008 2011 2009 2010 2012 2011 2013 2012 2014 2013
2015 2014 2016 2015 2016 2017 2017 2018 2018 2019 2019 2020 2020 2021 2021 2022 2022 1 2023 2023 2023E 2003 2004 2005 2006 2007 2008 2009 2010 2011 2012 2013 2014 2015 2016 2017 2018 2019 2020 2021 2022 2023

Our Sustainable Competitive Advantages PEOPLE SCALE PRODUCT DIGITAL
▪ Hire, train, and retain best ▪ Remain focused in top ▪ Focus on value-add to ▪ Continue to lead the people in industry through MSAs – currently serving address customer needs industry in developing talent leadership
programs, 89 of top 100 MSAs (e.g., cycle time, labor, digital solutions to solve including BFS University availability, and quality) builder pain points ▪ Gain share in underserved ▪ Promote from within: ▪ Capitalize on automation
▪ Win through value pricing, markets through tuck-ins >2,000 internal promotions investments for efficiency industry-leading logistics, since 2021 Investor Day advantage in offsite labor-saving solutions, and ▪ Maximize capacity
fabrication innovative tools utilization ▪ Leverage systems, processes, and tools for ▪ Leverage unique ▪ Enhance myBLDR.com continuous improvement capabilities to provide ▪ Gain share of wallet turnkey solutions –
Rigorous talent and through Digital strategy succession planning – Development plans for key talent – Train and develop at all levels Innovation Enhances Scale for End-to-End Solutions I N V E S T O R D A Y 2 0 2 3 – © B U I L
D E R S F I R S T S O U R C E 13

Our -TEAM Operating System Continues to Drive Strategic Growth
Priorities Building People Experienced field leadership and management working to develop the next generation of talent supported by a strong, inclusive culture and values- driven approach Building Excellence Drive >$100M in annual efficiencies
through our scale, continuing to invest in automation and process improvement, and leveraging the largest sales organization and offsite manufacturing network in the industry Building Growth Grow our business by continuing to invest in value-added
products and digital innovations to help address our customers’ pain points and deliver greater efficiency across homebuilding Delivering Superior Value through Operational Excellence I N V E S T O R D A Y 2 0 2 3 – © B U I L D E R
S F I R S T S O U R C E 14

Clear Strategic Pillars Driving Long-Term Profitable Growth Organic
Invest in Continue to Disciplined Growth of Innovation Build Our High- Capital Value-Added and Drive Performing Allocation Products and Operational Culture Services Excellence Continuing to Compound Value Creation with Strong Execution I N V E S T O
R D A Y 2 0 2 3 – © B U I L D E R S F I R S T S O U R C E 15

Significant Upside Potential in Value-Added Products and Services
▪ Accelerate Market Penetration – Capture Single-Family potential, especially in underserved regions and product categories – Grow Multi-Family and pro-remodeling segments in targeted markets ▪ Offer Innovative Solutions for
Customer Labor Challenges – Increase offsite assembly, other innovative solutions, and jobsite productivity, while fueling our profitable growth; strong tailwind to our manufactured products ▪ Deploy Capital to Grow and Increase
Value-Added Solutions – Truss & Panel: Well-positioned facilities allow us to respond to market demand – Millwork: Add capacity in key markets to meet growing demand ® – READY-FRAME : Expand our geographic scale from coast
to coast ▪ Continue to Pursue Solutions Across the Value-Added Continuum Now Future OFFSITE FAB INSTALL TURNKEY SHELL MODULAR Evolving Further Along the Value-Added Continuum is Essential in Our Long-Term Strategy I N V E S T O R D A Y 2 0 2 3
– © B U I L D E R S F I R S T S O U R C E 16

Future Opportunity – Focused Investment in Building Science Path
to Success ▪ Partnering with key customers and intentionally engaging with cutting-edge homebuilding products and technology ▪ Investing in promising early-stage technologies provides opportunities to leverage our market-leading
distribution platform in exchange for a financial or ownership interest ▪ Utilizing dedicated internal resources to conduct our own research into new building materials, tools, and methodologies keeps us ahead of potential threats and
opportunities Continue to Lead the Homebuilding Industry with Cutting-Edge Innovation I N V E S T O R D A Y 2 0 2 3 – © B U I L D E R S F I R S T S O U R C E 17

Commitment to Operational Excellence and Innovation Create Value
through Continuous Innovation and Efficiency are Improvement Initiatives Key Differentiators ▪ Investment in value-added solutions ▪ PIM and SKU Consolidation Scale and Integration▪ Leader in truss automation ▪ Strategic
Centralization ▪ Customer service tracking ▪ Pricing and cost harmonization ▪ ERP and MDM ▪ Automation Technology ▪ Automation and Digital ▪ Delivery optimization ▪ Nex Gen: ML, AI 1 ▪ ~$275M of
cumulative productivity savings ▪ Planning and Sourcing ▪ Back-office Efficiency Process Improvement ▪ Operating Metric benchmarking ▪ Playbooks / SMEs Investing in Innovation and Enhancing Digital Solutions for Our Customers
1 Note: PIM: Product Information Management, ML: Machine Learning, AI: Artificial Intelligence, MDM: Master Data Management. Represents sum of $123M of 2022 productivity savings and expected 2023 productivity savings at the midpoint. I N V E S T O R
D A Y 2 0 2 3 – © B U I L D E R S F I R S T S O U R C E 18

Continuing to Build Our High-Performing Culture Key Focus Areas ▪
Promote career growth through enhanced leadership development programs and proprietary courseware – ~20,000 professional development and leadership training classes completed since 2021 Investor Day ▪ Roll out improved work/life benefit
solutions that meet the needs of our workforce ▪ Strengthen talent acquisition through: – Enhanced talent acquisition partnerships • Building Talent Foundation, military and veteran associations, Historically Black Colleges &
Universities (HBCUs), vocational and training programs • Sponsorship of HBS Women in Hardware A Culture Focused on Building Leadership and Careers I N V E S T O R D A Y 2 0 2 3 – © B U I L D E R S F I R S T S O U R C E 19

Accelerating Our ESG Journey Key ESG Accomplishments ✓ Launched
inaugural ESG report in May 2022 and released latest report in May 2023 Environmental Social Governance ✓ Disclosed our Scope 1 and Scope 2 greenhouse gas emissions for the Focus on Green, Commitment to Safety and Disciplined Pursuit first
time in 2023 Sustainable Building – Giving Back to Communities of Long-Term Stakeholder 2 ✓ ~30% RIR reduction across the “Green Works” in Which We Live and Work Value Creation company in 2023 ✓ >90% sustainable
forestry certified ▪ Leader in offsite manufacturing▪ Ensuring safety remains core to ▪ Seasoned board comprised of vendors 1 our culture industry business leaders – Independent study confirms ✓ ~33 average hours of
training value creation of components vs. – “Drive to Zero” program ‒ 90% independence (100% per leader traditional stick frame – faster, non-employee director – Management incentives tied less waste, and safer
independence) to safety ✓ >$4M charitable contributions 2 ‒ Fully engaged with diverse, in 2023 – >10% annual RIR reduction effective skillset ▪ Giving back to communities we serve by fostering volunteer opportunities
for our team members Remain Committed to Making a Positive Impact 1 2 Source: 2023 CSR Report and company data. SBCA Framing the American Dream study. Recordable Incident Rate. I N V E S T O R D A Y 2 0 2 3 – © B U I L D E R S F I R S T S
O U R C E 20

Experienced Leadership Team Focused on Execution Dave Rush Peter
Jackson Steve Herron Amy Bass Tim Johnson Tim Page Chief Executive Chief Financial Chief Operating EVP, Legal, Safety, EVP, Digital Messersmith Officer Officer Officer and ESG Solutions Chief People Officer Mike Farmer Mike Hiller Scott Robins Mike
McCrobie Joe Barnes Jami Beckmann Heather Kos President, President, President, President, EVP, Sourcing & SVP, Chief SVP, Investor Commercial Operations Central Division West Division East Division Supply Chain Accounting Officer Relations
Energized Management Team Driving Positive Momentum I N V E S T O R D A Y 2 0 2 3 – © B U I L D E R S F I R S T S O U R C E 21

Experienced and Diversified Board of Directors Skills Matrix Business
Development / M&A 100% Finance 90% Public Company Director 80% Paul Levy Mark Alexander Cory Boydston Dirkson Charles Cleveland Christophe Director & Chairman Founder, Chairman, Former CFO, Ashton Founder and CEO, Former President,
Operational Excellence 70% Managing Director, & CEO, Landmark Woods USA LLC Loar Group, Inc. US&S, Inc. JLL Partners, Inc. Property Group Joined: 1998 2021 2021 2022 2005 Leadership Experience 70% Industry Experience 60% Board Attributes 90%
William Hayes Brett Milgrim James O’Leary Dave Rush Craig Steinke Independence Former EVP, CFO, Co-Chairman, Chairman, CEO, CEO and Director of & Treasurer, LabCorp Loar Group, Inc. Kinematics Builders FirstSource Service Logic, LLC
Manufacturing Company 63.6 Years 9.5 Years 2019 1999 2021 2022 2006 Average Age Average Tenure I N V E S T O R D A Y 2 0 2 3 – © B U I L D E R S F I R S T S O U R C E 22

Disciplined Capital Allocation 1 2022-2023E Capital Deployed: $6.1B
Consistent Capital Allocation Priorities $0.8B 1. Maintain Strong Balance Sheet $0.9B ▪ Target Base Business leverage ratio of 1.0x to 2.0x 2. Organic Growth ▪ Drive productivity and growth with growth investments $4.4B 3. Inorganic
Growth ▪ Pursue margin accretive deals with strategic, tuck-in M&A 4. Return Capital to Shareholders Cumulative (Since 12/31/21) ▪ Continue opportunistic share repurchases Share Repurchases Tuck-in M&A Organic Growth 2 Deployable
Capital Goal of $5.5B to $8.5B from 2024E to 2026E 1 2023 estimate as provided on Q3 2023 earnings call on 11/1/23. 2 Deployable capital includes Organic Growth, which is inclusive of capital expenditures. Target assumes 1.0x to 2.0x Base Business
leverage ratio. I N V E S T O R D A Y 2 0 2 3 – © B U I L D E R S F I R S T S O U R C E 23

Our Digital Platform to Fuel Long-Term Growth Digitizing Homebuilding
and DIGITAL INNOVATIONS INDUSTRY LEADER Materials Sourcing ~$110B 1 SINGLE-FAMILY HOMES – U.S. NEW CONSTRUCTION 1 2 3 BUILDING MATERIALS (TTM Sept. 2023) SHARE GROWTH Faster, Increased Design Greater Control Providing digital solutions to
solve ACCELERATOR More Accurate Functionality for Homebuilders builder pain points and Complete with Supply Chain and Other Project Being a key player in emerging Materials List Integration Participants digital homebuilder space Generating pull
through sales opportunities On Track to Deliver $1B of Revenue Growth from Incremental Sales by 2026 1 Source: TAM generated using U.S. Census, Dodge, HIRI, and Company estimates of all building materials and not just the products that we sell;
~$134k assumed materials cost per home based on Company estimates as of November 2023. Share is based on TTM September 2023 Company sales. I N V E S T O R D A Y 2 0 2 3 – © B U I L D E R S F I R S T S O U R C E 24

New 2026E Base Business Targets 2021-2025E Targets PROGRESS 2024E-2026E
(Announced at Dec. 2021 1 TO DATE TARGETS Investor Day) Revenue ~10% CAGR ~3% CAGR ~9% CAGR Adj. EBITDA ~15% CAGR ~13% CAGR ~12% CAGR ~50 bps ~115 bps ~30 bps Adj. EBITDA Expansion Expansion Expansion Margin Annually Annually Annually Adj. EPS ~30%
CAGR ~45% CAGR ~17% CAGR 2 Deployable Capital of $5.5B to $8.5B from 2024E to 2026E 1 2 Through 2023E. Deployable capital includes Organic Growth, which is inclusive of capital expenditures. Target assumes 1.0x to 2.0x Base Business leverage ratio.
* Non-GAAP financial measures; see Appendix for reconciliations to the most directly comparable GAAP financial measures. I N V E S T O R D A Y 2 0 2 3 – © B U I L D E R S F I R S T S O U R C E 25

Driving Operational Excellence: Winning Together as STEVE HERRON
• Chief Operating Officer I N V E S T O R D A Y 2 0 2 3 – © B U I L D E R S F I R S T S O U R C E 26

Driving Operational Excellence: Winning Together as STEVE HERRON
• Chief Operating Officer I N V E S T O R D A Y 2 0 2 3 – © B U I L D E R S F I R S T S O U R C E 27

Key Messages Building our people with a deep focus on safety, 1 talent
development, training, and retention to maximize customer service Building excellence through clear operational and 2 productivity improvement initiatives to deliver innovative products and services addressing customer needs Building growth with an
emphasis on organic growth 3 initiatives and select, disciplined tuck-in acquisitions I N V E S T O R D A Y 2 0 2 3 – © B U I L D E R S F I R S T S O U R C E 28 28

Building People SAFETY TRAINING ENGAGEMENT Continuously driving
Consistent onboarding Tracking team member safety initiatives to full and new team member engagement annually integration within our training culture ~5% YoY Implemented Engagement ▪ Incentive structure tied to >100 improvement leadership
high potential safety results goal leaders development identified program Industry-leading safety Disciplined annual protocols and track record Launched manager / review process ~55% sales-in-training focused on employee ~30% of locations YoY
reduction programs development path are 365 days in RIR incident free in 2023 Commitment to Safety and Development of High-Performing Workforce I N V E S T O R D A Y 2 0 2 3 – © B U I L D E R S F I R S T S O U R C E 29
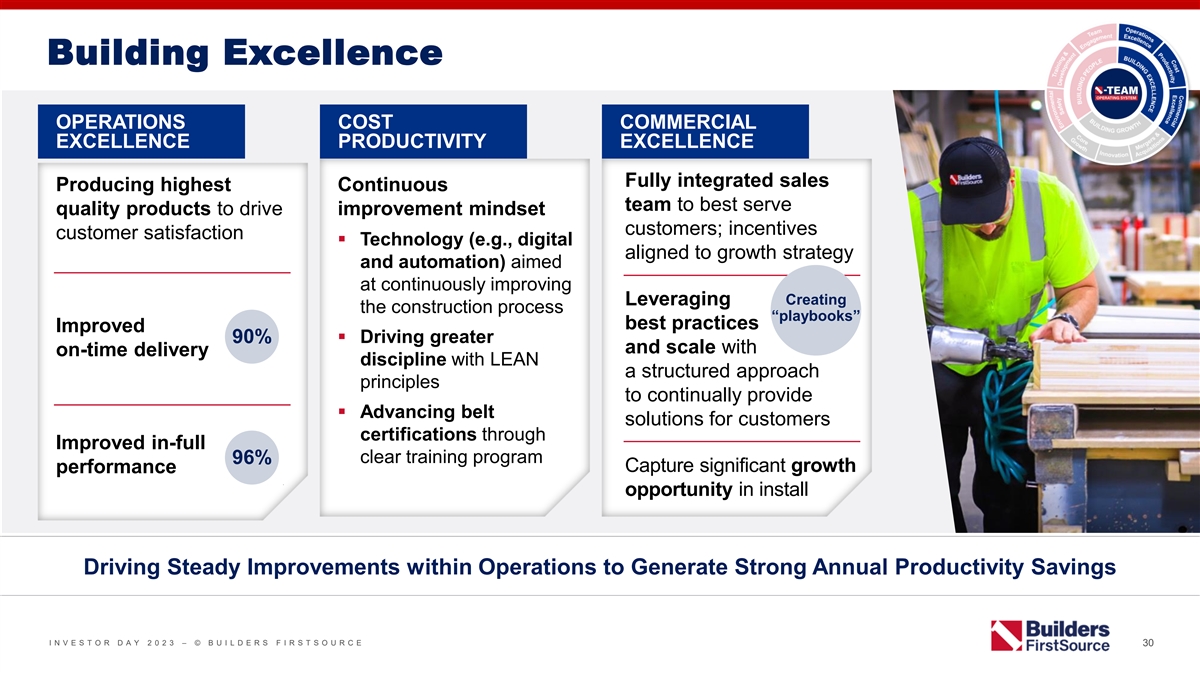
Building Excellence OPERATIONS COST COMMERCIAL EXCELLENCE PRODUCTIVITY
EXCELLENCE Fully integrated sales Producing highest Continuous team to best serve quality products to drive improvement mindset customers; incentives customer satisfaction ▪ Technology (e.g., digital aligned to growth strategy and automation)
aimed at continuously improving Leveraging Creating the construction process “playbooks” best practices Improved 90%▪ Driving greater and scale with on-time delivery discipline with LEAN a structured approach principles to
continually provide ▪ Advancing belt solutions for customers certifications through Improved in-full 96% clear training program Capture significant growth performance opportunity in install Driving Steady Improvements within Operations to
Generate Strong Annual Productivity Savings I N V E S T O R D A Y 2 0 2 3 – © B U I L D E R S F I R S T S O U R C E 30

Case Study | Optimizing Footprint to Lower Costs and Leverage
Scale… Background Operational Excellence in Action Results Merger with BMC▪ Consolidated 3 distribution yards due to general overlap $2.5M-$3.0M – Minimal impact to growth capacity Annual Overhead ▪ #1 player in vibrant, Cost
Reduction highly competitive ▪ Consolidated 2 component plants; invested in automation Atlanta market to retain and increase growth capacity >15% ▪ Combined company ▪ Invested in new state-of-the-art millwork plant, while
Increase in Truss Direct was operating with closing a smaller, sub-optimal site – new site Labor Efficiencies 12 distribution yards, advantages: 4 truss plants, and – Increases growth capacity and efficiencies via optimized layout 15% 4
millwork plants rd – Shifts lumber re-load from 3 -party vendors to internal control Working Capital Days Reduction …While Retaining Growth Capacity I N V E S T O R D A Y 2 0 2 3 – © B U I L D E R S F I R S T S O U R C E
31

Supply Chain Optimization Efforts COST CATEGORY RISK MANAGEMENT
MANAGEMENT MITIGATION ▪ Executing opportunities to ▪ Aligning costs to ▪ Maximizing spend with utilize our scale and revenue and driving the right supply partners achieve lower landed consistently higher ▪ Standardizing SKUs
for cost by: margins greater efficiency ‒ Shifting a higher ▪ Protecting costs during percentage of moulding ▪ Improving industry-best long selling cycles mix from domestic millwork lead times distribution to import ‒
Multi-Family can take (e.g. JIT program for the (>$15M for 2023E) 9-18 months vs. normal Dallas market) 2-4 months selling cycle ‒ Reducing inbound shipping for Single-Family costs by establishing in- house freight management capabilities
and tools (>$4M for 2023E) Leveraging Our Scale to Have the Industry Best Cost Position I N V E S T O R D A Y 2 0 2 3 – © B U I L D E R S F I R S T S O U R C E 32

Delivering Productivity through Targeted Initiatives ACHIEVEMENTS SINCE
2021 INVESTOR DAY Near-Term Efficiency Targets 1 § Productivity: ~$275M of cumulative productivity § Improve fleet utilization with ~20% improvement savings, exceeding our $100M annual target driven in truck turnaround times by improved
procurement and SG&A efficiencies § Reduce error rate by 10% in order entry 2 § Truss: improved board foot per hour ~45% since and manufacturing the BMC merger in January 2021 § Reduce inventory shrinkage by 10% through §
Millwork: improved doors per hour by ~5% and specific kaizen events in component plants increased overall Millwork capacity by 21% with the installation of 7 new high-speed door lines Repeatable Playbook to Drive Strong Annual Productivity in
Controllable Spend 1 Represents sum of $123M of 2022 productivity savings and expected 2023 productivity savings at the midpoint of the guidance range. 2 Adjusted to be on a same store basis. I N V E S T O R D A Y 2023 – © B UI L DE RS F
I RS T S O URCE 33

Building Growth INNOVATION CORE GROWTH M&A Delivering an end-to-end
Laser-focused on Disciplined and prudent digital platform to customer-centric tuck-in M&A within a fragmented market to transform homebuilding, innovation – partnering increase: extending market with our largest customers leadership to
drive to create and deliver ▪ Market strength revenue growth industry-leading product ▪ Value-added product mix and labor solutions ▪ Coverage in desirable Investing in value-added markets High solutions to solve builder Truss
Speed ▪ Customer stickiness pain points, including Automation Door through expanded reach Lines labor availability and time and solutions to build Digital Building Profitable Growth through Organic and Inorganic Opportunities I N V E S T O R D
A Y 2 0 2 3 – © B U I L D E R S F I R S T S O U R C E 34

Capitalizing on Industry-Leading Value-Added Footprint ▪ Current
footprint and capabilities – Components (truss & wall panels): >160 operations – ~$130M Added >30 new operations since 2021 Truss Plant Investment – Millwork: >120 operations – Added >25 new operations since
2021 Since 2020 ▪ Fully integrated all truss plants to serve both Single- and Multi-Family projects – Truss: Operating >725 setups: over 60% have some level of automation, including 4 setups with robotics ▪ Remain committed to
quality assurance and >280 value-added 120 operations as we continue to scale Truss Plants ▪ Continuing to optimize plants with new equipment ~4x the Size of Nearest – Truss: Upgrading 15 locations, including 3 robotic lines (2024)
Competitor – Millwork: Upgrading 11 locations (2024) Driving Best-in-Class, Lean Manufacturing I N V E S T O R D A Y 2 0 2 3 – © B U I L D E R S F I R S T S O U R C E 35

Capturing Significant Growth Opportunity in Install Operations 2023E
Install Sales 1 ~$2.5B (~15% of Total Revenue) ▪ Value-added opportunity for both BFS and customers – Providing bundled solutions with labor as a Top Product Opportunities service to address customers’ shortage of labor
availability – crucial across all markets – Offering multiple turnkey solutions for various residential construction sites (e.g., apartment complexes, single-family homes, etc.) MILLWORK WINDOWS FRAMING SIDING ▪ Continuing to grow
share in a down market – labor sales up 45% YoY ▪ Organic and inorganic growth opportunity Install Capability in Approximately Two-Thirds of Our Markets – Opportunity to Further Grow 1 Represents net sales from installation and
construction services, including the impact from the materials installed. I N V E S T O R D A Y 2 0 2 3 – © B U I L D E R S F I R S T S O U R C E 36

Key Takeaways 1 2 3 Building growth Building our people Building
excellence with an emphasis on with a deep focus on through clear operational organic growth initiatives safety, talent development, and productivity and select, disciplined training, and retention to improvement initiatives to tuck-in acquisitions
maximize customer service deliver innovative products and services addressing customer needs I N V E S T O R D A Y 2 0 2 3 – © B U I L D E R S F I R S T S O U R C E 37

Delivering Sustainability While Continuing to Build Our High Performing
Culture TIM JOHNSON • EVP, Legal, Safety & ESG AMY BASS MESSERSMITH • Chief People Officer I N V E S T O R D A Y 2 0 2 3 – © B U I L D E R S F I R S T S O U R C E 38

Key Messages Driving a clear and differentiated ESG strategy 1 to
outperform today and transform tomorrow Empowering customers with industry-leading solutions 2 to enable a sustainable future and drive profitable growth Building on our strong, inclusive culture and 3 values-driven approach to attract, retain and
develop the best talent in the industry I N V E S T O R D A Y 2 0 2 3 – © B U I L D E R S F I R S T S O U R C E 39

ESG Strategic Framework Customers Operations Communities Team Members
Provide innovative Operate effectively Make a positive Foster a workplace solutions for and efficiently impact in the where safety, careers, more sustainable to drive long-term local communities and diverse operations value we serve perspectives
thrive Industry Leader in Sustainability with Cleaner, Safer, and More Efficient Homebuilding Solutions I N V E S T O R D A Y 2 0 2 3 – © B U I L D E R S F I R S T S O U R C E 40

Sustainably Innovating to Create Customer Value… ▪ Leader
in offsite manufacturing – Addresses real customer needs, including labor availability and speed to build – Independent study confirms value creation of components vs. traditional stick frame 1 • Faster: ~2.5x faster to build homes
with components vs. stick framing 1 • Less Waste: ~25% less board footage per average US home (~14.5 cubic yards of less waste per home) 1 • Safer: reduces on-site cutting and ladder time – Drives outstanding retention of customers
▪ Increasing Digital innovations and adoption will accelerate and expand the importance of offsite manufacturing ▪ Investment in value-added solutions remains a key pillar of our strategy, driving product and service innovation,
differentiation, and growth opportunities – Focusing on organic growth of value-added components and solutions, which together will deliver strong sales CAGR with solid ESG benefits – Accelerating value-added through acquisitions;
>$800M annual revenues in truss and millwork acquisitions since the BMC merger …while Driving Sustainable Profitable Growth 1 SBCA Framing the American Dream study. I N V E S T O R D A Y 2 0 2 3 – © B U I L D E R S F I R S T S O
U R C E 41

Operating More Sustainably with a Clear Focus on Our Environmental
Impact Committed to Continuing to Reduce Our Environmental Footprint Sustainable Sourcing ▪ Implementing nationwide delivery routing system to maximize vehicle efficiency and minimize emissions Sourcing >90% of wood ▪ Introducing
alternative fuel vehicles from the Sustainable Forestry Initiative (SFI) ▪ Utilizing water-based paints to reduce hazardous waste risk and Forest Stewardship Council (FSC) ▪ Upgrading lighting to LEDs to save energy and reduce emissions
>5.4M ▪ Optimizing material usage and reducing construction waste Trees Saved ® Providing Energy Star by utilizing manufactured components and continually providing 1 Since 2019 qualified windows more efficient materials and doors
Commitment to Identifying Specific GHG Reduction Targets No Later Than 2025 Industry-Leader in Providing an Eco-Friendly Approach to Homebuilding 1 Source: Independent third-party study on lumber reduction from READY-FRAME® and SBCA Framing the
American Dream study. Internal calculation based on production data for Builders FirstSource READY-FRAME® precut framing packages, roof and floor trusses since January 1, 2019. I N V E S T O R D A Y 2 0 2 3 – © B U I L D E R S F I R
S T S O U R C E 42

Dedicated to Serving Our Local Communities BFS Cares Enduring
Partnership with LLS Created to help team members facing financial hardship immediately after a natural disaster or unforeseen personal hardship 17 $11M #1 years of raised for National ▪ Provides a tax-free grant ranging from support LLS
through fundraising $500 – $5,000 collected from individual team 2023 team member donations and support from the company Established ▪ Since 2017, over 1,300 grants totaling ~$900,000 BFS Foundation have helped team members during times
of to Enhance financial hardship Charitable Efforts Additional Charitable Partnerships On Track to Deliver Over $4M in Charitable Giving in 2023 I N V E S T O R D A Y 2 0 2 3 – © B U I L D E R S F I R S T S O U R C E 43

Continuing to Build Our High-Performing Culture AMY BASS MESSERSMITH
• Chief People Officer I N V E S T O R D A Y 2 0 2 3 – © B U I L D E R S F I R S T S O U R C E 44

Industry-Leading Approach to Talent Development Drives Competitive
Differentiation WE’RE A WE MAKE PEOPLE FIRST A LOCAL TEAM. IMPACT. WE GROW WE GIVE CAREERS BACK. FROM WITHIN. I N V E S T O R D A Y 2 0 2 3 – © B U I L D E R S F I R S T S O U R C E 45

Attracting Top Talent and Team Member Retention and Development DEFINED
CLEAR ELEVATED TOTAL DROVE A CULTURE WE ARE A VALUES-DRIVEN CAREER PATHS REWARDS OF ENGAGEMENT ORGANIZATION ▪ Formalized compensation ▪ Developed and articulate ▪ Established -TEAM SAFETY philosophy, pay grades, a differentiated
employee University and job levels value proposition (EVP) We make safety our top priority ‒ High-potential and ▪ Aligned short and ▪ Executed engagement emerging-leader PEOPLE long-term incentive survey action plans classes
approaches, organizational ▪ Embedded respect and We lead with a people-first culture structure, and support ▪ Supported processes inclusiveness into every that inform all aspects ▪ Detailed review of touchpoint of the team
INTEGRITY of the team member benefit plan designs member experience experience and programs We are honest and reliable ‒ Attraction ▪ Established Team Member ‒ Onboarding Services to ensure CUSTOMERS >2K internal promotions
responsiveness and timely SINCE ‒ Development We deliver exceptional customer service issue 2021 ‒ Succession resolution INVESTOR ~20K leadership training EXCELLENCE ‒ Bench planning / DAY classes completed offboarding We challenge
the status quo A Culture Focused on Creating a Better Future I N V E S T O R D A Y 2 0 2 3 – © B U I L D E R S F I R S T S O U R C E 46

-TEAM University: Our All-Encompassing Learning Platform LEADING
ORGANIZATIONS LEADING TEAMS Extensive >47K >46K ~33 on-the-job Total annual online Total annual Average hours training hours for all in-person training of training annually training team members in hours for leaders per leader for all team
members addition to on-the-job LEADING OTHERS training LEADING SELF Fully Committed to the Continuous Professional Development of All Team Members I N V E S T O R D A Y 2 0 2 3 – © B U I L D E R S F I R S T S O U R C E 47

Signature Programs Reinforce Authenticity of Employee Value Proposition
WE’RE A PEOPLE WE GROW CAREERS WE MAKE A WE GIVE FIRST TEAM. FROM WITHIN. LOCAL IMPACT. BACK. ▪ World-Class Safety Culture▪ -TEAM University▪ Feedback Driven ▪ BFS Cares Engagement Surveys ▪ First Team
Recognition▪ Leadership Development▪ Leukemia & Lymphoma ▪ Best Practice Councils Society ▪ Enhance Work & Life Benefits▪ Differentiated Career Paths ▪ Local Employee ▪ Expanded Military Resource
Groups Connections ▪ -TEAM Operating System▪ Local Community Causes & Volunteer Day I N V E S T O R D A Y 2 0 2 3 – © B U I L D E R S F I R S T S O U R C E 48

Key Takeaways 1 2 3 Building on our strong, Driving a clear and
Empowering customers inclusive culture and differentiated ESG with industry-leading values-driven approach strategy to outperform solutions to enable a to attract, retain, and today and transform sustainable future and develop the best talent
tomorrow drive profitable growth in the industry I N V E S T O R D A Y 2 0 2 3 – © B U I L D E R S F I R S T S O U R C E 49

Q&A I N V E S T O R D A Y 2 0 2 3 – © B U I L D E R S F
I R S T S O U R C E 50

BREAK I N V E S T O R D A Y 2 0 2 3 – © B U I L D E R S F I
R S T S O U R C E 51

Elevating Commercial Excellence MIKE FARMER • President,
Commercial Operations I N V E S T O R D A Y 2 0 2 3 – © B U I L D E R S F I R S T S O U R C E 52

K Ke ey y M Me es ss sa ag ge es s Leveraging largest sales
organization and offsite 1 manufacturing network in industry to deepen customer relationships and drive long-term revenue growth Improving data-driven sales process with 2 continuous improvement mindset to elevate commercial excellence Strengthening
relationships with homebuilders 3 to solidify industry leadership and capture incremental market share I N V E S T O R D A Y 2 0 2 3 – © B U I L D E R S F I R S T S O U R C E 53

Our Sales Organization is a Competitive Advantage Key Stats
Industry-Leading Sales Organization >13 years average tenure of our Outside Sales Team ~1,850 ~1,950 Solving Builder Pain Points by Leveraging Our OUTSIDE SALES INSIDE SALES Network of Value-Added Components REPRESENTATIVES REPRESENTATIVES
>160 component (truss & wall panel) operations today ~115K ~90% Clear Sales Incentives Aligned with CUSTOMERS CUSTOMER Long-Term Profitable Growth SERVED RETENTION >95% of sales team members are commission based ~85% Diversified Customer
Base CUSTOMERS BUYING Largest customer is ~5% of sales, which minimizes 2 OR MORE reliance on any one customer CATEGORIES I N V E S T O R D A Y 2 0 2 3 – © B U I L D E R S F I R S T S O U R C E 54

Commercial Excellence is Core to Long-Term Growth Sales Ops Leading
software enables greater customer visibility, system controls to reduce overrides, optimized market coverage Value-Based Selling Market Pricing Mature pricing process, promoting pricing excellence, Fully integrated sales force helps solve customer
best practices, and national deal support pain points and supports margin expansion Sales Analytics Category Management Customer profitability, margin transparency Supplier partnership and negotiating, cost Commercial and pricing support, focus on
customer value transparency and timely pass through Excellence Data-Driven Process to Further Enhance Commercial Excellence I N V E S T O R D A Y 2 0 2 3 – © B U I L D E R S F I R S T S O U R C E 55

Building a Culture of Sales Excellence Actions Benefits ▪
Leveraging largest Share gains, including customer data set in new customer wins, homebuilding industry increased wallet share, and stickiness + ▪ Driving deeper Sales Value-Based Sales Market Category understanding of Partner with customers
Analytics Selling Operations Pricing Management customer-level to improve efficiency profitability and reduce cycle times ▪ Exploring early-stage Faster and better- Sales and Pricing Proactive Market AI opportunity to informed decisions
Excellence Management empower sales force effectiveness Supporting Industry’s Largest Sales Force with the Industry’s Best Data and Analytics I N V E S T O R D A Y 2 0 2 3 – © B U I L D E R S F I R S T S O U R C E
56

Taking Proactive Steps to Enhance Pricing and Returns Actions Benefits
▪ Driving pricing Improved gross consistency within margin profile with markets value-added mix + ▪ Using data to drive National customer Sales Value-Based Sales Market Category better relationships alignment with local Analytics Selling
Operations Pricing Management with suppliers market needs ▪ Helping local teams Shift from “gatherer” understand cost and to “hunter” mindset Proactive Market Sales and Pricing profitability drivers Management
Excellence Optimizing Growth and Margins through Enhanced Focus on Pricing Management I N V E S T O R D A Y 2 0 2 3 – © B U I L D E R S F I R S T S O U R C E 57

Strengthening National Builder Relationships to Grow with Our Partners
Expanding Leading with Value- National Builders Relationships Added Solutions Demonstrating Resilience Continuing to build our Providing customer-centric in Current Market footprint and strengthen solutions that drive efficiency, national presence
reduce waste, and improve ▪ Leveraging strong balance sheets cycle times and cash flow to manage through market slowdown Leveraging Scale Acting Nationally ▪ Buying down rates and negotiating & Product Portfolio to Grow Locally
forward contracts to keep building Partnering with our Centralizing administration process moving ahead customers to help address to allow local teams to focus ▪ Capitalizing on market disruption labor challenges on serving customers to grow
market share more effectively Building a Growing Franchise to Support Largest Customers While Expanding Margins I N V E S T O R D A Y 2 0 2 3 – © B U I L D E R S F I R S T S O U R C E 58

Commercial Excellence in Action SOLVING PAIN POINTS Customer Segment
Value Proposition BFS BENEFITS FOR CUSTOMERS ▪ National – Leader in overall scale and offsite manufacturing across an aligned, nationwide footprint We are the easiest to do that matches to the builder need in our markets business with
given our product expertise and ▪ Regional – Leveraging our 1,800+ outside sellers to Value-Added Growth portfolio, footprint, and maintain relationships and strengthen builder capabilities Mix Improvement tenured sales team members
▪ Custom – Local coverage and expertise to support higher-touch custom homes and enhance builder image Creating value for a range Margin of homebuilders through ▪ Pro Remodeling – Inside and outside sales bolster Improvement
our offsite fabrication remodelers via dedicated locations and services in network and install business, key markets which address labor Share Growth ▪ Multi-Family – Value-added network provides footprint to availability challenges and
deliver our best-in-class design capabilities and capacity speed time to build to go where Multi-Family builders go Driving Meaningful Growth Through Commercial Excellence and Operational Efficiency I N V E S T O R D A Y 2 0 2 3 – © B U I
L D E R S F I R S T S O U R C E 59

Key Takeaways 1 2 3 Strengthening Leveraging largest sales Improving
data-driven relationships with organization and offsite sales process with homebuilders to solidify manufacturing network continuous improvement industry leadership and in industry to deepen mindset to elevate capture incremental customer
relationships commercial excellence market share and drive long-term revenue growth I N V E S T O R D A Y 2 0 2 3 – © B U I L D E R S F I R S T S O U R C E 60

Accelerating Industry- Leading Digital Offerings TIM PAGE • EVP,
Digital Solutions I N V E S T O R D A Y 2 0 2 3 – © B U I L D E R S F I R S T S O U R C E 61

Key Messages Significant progress on our digital journey, delivering on
1 our commitments to customers and shareholders Continued industry leadership, providing cutting-edge 2 digital solutions with a relentless focus on customer success and value to empower the next generation of homebuilding Strong commitment to value
creation, achieving 3 meaningful progress toward goal of $1B in incremental product revenue by 2026 I N V E S T O R D A Y 2 0 2 3 – © B U I L D E R S F I R S T S O U R C E 62

Creating a Better Way to Build as Demand for Modern, Digital Solutions
Continues to Grow Addressing industry …with industry-leading …to become the premier partner pain points… digital solutions… for builders and suppliers ▪ Lengthy design cycle remains þ Streamlined design in a
Increase Wallet Share with static in 2D blueprints dynamic, 3D digital model Existing Customers Driving Grow Market Share with ▪ Offline information storage þ Online collaboration provides New Customers $1B results in misunderstanding of
stakeholder alignment and project timeline and cost visibility throughout the project Expand across other Incremental Builder Segments Product ▪ Ongoing change requests þ Seamless connection from Revenue Expand Shoppable result in an
inefficient job site design through material by 2026 Product Catalog procurement and construction Transforming the Industry for Current and Next Generation of Homebuilders I N V E S T O R D A Y 2 0 2 3 – © B U I L D E R S F I R S T S O U
R C E 63

Digital Platform Expected to Fuel Long-Term Growth …and Continue
to Set the Pace for the Industry Laid Out a Bold Plan at 2021 Investor Day… KEY ACCOMPLISHMENTS FOREFRONT OF DIGITAL TRANSFORMATION ✓ Introduced myBLDR.com customer portal, hub for ✓ Industry leader; 3-5-year head start vs.
competitors greater functionality and improved user interface ✓ ~2-year head start on customer adoption ✓ Expanded 2D and 3D modeling and estimation ✓ Continuing to expand the digital solutions portfolio capabilities, with ~25K
automated takeoffs from customer plans on Paradigm technology in full year ✓ Delivering new capabilities that competitors don’t offer 1 2023 (+220% year-over-year ) ✓ Customer-centric focus with strong relationships ✓
Deployed Digital Twin technology and 3D Home upstream and downstream Configure pilot ✓ Set the stage for sales and operations adoption Building on Our Vision to Digitize the Industry 1 Represents the year-over-year change in automated
takeoffs on a year-to-date basis as of November 2023. I N V E S T O R D A Y 2 0 2 3 – © B U I L D E R S F I R S T S O U R C E 64

Driving Value for Key Stakeholders Through Distinct Competitive
Advantages Value for Key Stakeholders Competitive Advantages Scale and market ~4K sales team HOMEBUYER position to reach with direct and Improved homebuying experience, design choices, understanding of a fragmented trusted homebuilder cost
implications, and ability to store construction documents customer base relationships HOMEBUILDER Well-positioned Technical knowledge early in value chain spanning construction Competitive advantage in the selling process, shorter design cycle /
with planning and process reduced costs, construction efficiencies, and supplier / trade connectivity design services INTEGRATED SUPPLY PARTNERS Unmatched Aspiration for digital distribution platform transformation with Lower cost channel, extended
reach to potential homebuyers, with required supply access to capital operational efficiencies, and improved business insights partnerships Capitalizing on Scale to Drive Innovation and Transformation I N V E S T O R D A Y 2 0 2 3 – © B U
I L D E R S F I R S T S O U R C E 65

Three Pillars of Our Digital Strategy Technology Adoption Growth
Delivering digital Helping customers Extending market tools to transform accelerate their leadership to drive homebuilding digital journey revenue growth Increased Confidence to Achieve $1B in Incremental Revenue by 2026 I N V E S T O R D A Y 2 0 2
3 – © B U I L D E R S F I R S T S O U R C E 66

Expanding Digital Solutions to Deliver End-to-End Capabilities –
Establishing New 3D Digital Channel Current Industry Model Future State: Our New 3D Digital Channel Semi-Automated 2D 3D Modeling Within Expansion to a Whole Estimating within a a “Shoppable Digital House Take-Off with Collaboration Platform
– Twin Experience” Access to a Homebuilding myBLDR.com Marketplace Home Configure 3D Digital Twin & Take-off Product Catalog Best in our space at leveraging Use technology to improve Merging of technologies Improves homebuilder cost
current industry practices to fulfill homebuilder value and provides a new 3D channel and timeline transparency homebuilder product requirements service, create location for working with BFS that by expanding our 3D take-off productivity and value
chain will also integrate with to all materials required to collaboration structural design build a home I N V E S T O R D A Y 2 0 2 3 – © B U I L D E R S F I R S T S O U R C E 67

Digital Tools Solve Homebuilder Pain Points Deploy Technologies that
Create Significant Value for Homebuilders 2D PLAN 3D DIGITAL TWIN myBLDR HOME PLAN DRAFTING LIBRARY BUILD RENDER OPTIMIZE HOME Framing Truss MEPs CONFIGURE Offer Customers More Control Over Design, Saving Both Customers and Their Clients Time and
Money I N V E S T O R D A Y 2023 – © B UI L DE RS F I RS T S O URCE 68

Significant Progress on Our myBLDR.com Platform ▪ Access point
for delivering our Digital Tools in a collaborative customer experience ▪ With continued development, we will connect a homebuilder’s processes within one platform ✓ Plan intake and mark-up ✓ Ability to make structural and
finish selections ✓ Review frame walk with trade partners ✓ Request an estimate across all BFS categories ✓ Review quotes, purchase material, and track orders ✓ Set the schedule, aligning material receipt and labor
✓ View BFS invoices and track full project cost Documents Configure Build Materials Schedule Budget Crews I N V E S T O R D A Y 2 0 2 3 – © B U I L D E R S F I R S T S O U R C E 69

Customer Testimonial Video I N V E S T O R D A Y 2 0 2 3 – ©
B U I L D E R S F I R S T S O U R C E 70

Signs that Digital Adoption is Taking Hold ~5K ~5K Adoption Drivers
UNIQUE USERS PER NEW PLANS ADDED ▪ Expand adoption across leadership team MONTH in myBLDR.com myBLDR.com ▪ Track progress through area scorecards ▪ Host digital “roadshows” to raise awareness; AUTOMATED TAKE-OFF invest
in local markets ESTIMATES COMPLETED ~25K ▪ Collaborate with Customer Advisory Group YEAR-TO-DATE SALES FORCE TRAINED myBLDR.com Next-Gen Customer Portal TO SELL DIGITAL TOOLS ~30% $200M BY YEAR END ▪ Access point for delivering Digital
Tools and more collaborative 2024E customer experience INCREMENTAL PRODUCT ▪ With continued development, will be able to connect homebuilder’s Home Configure Pilot processes within one easy-to-use platform 3D REVENUE ACCESSIBLE VIA
myBLDR.com Growing Need for Digital Solutions Driving Increased Customer Adoption I N V E S T O R D A Y 2 0 2 3 – © B U I L D E R S F I R S T S O U R C E 71

Case Study | Early Technology Adoption Construction Trade Outcomes
Front Light Building x BFS Digital Tools Challenges ✓ Better quality ▪ Need to address where ✓ Cost efficiency trade tools were inconsistent with job ✓ Reduced cycle time requirements Home Configure Render Virtual Tour BIM
Preview ✓ Take-off accuracy ▪ Stress on trade activity ▪ At forefront of construction industry innovation connecting ✓ Waste reduction has been elevated design tools to the jobsite seamlessly over last 3 years due to
✓ Customer satisfaction labor shortages and ▪ Revolutionizing how customers see their new homes come (“see” your dream home) supply chain constraints to life by letting them see and experience the Digital Twin and house in
3D ✓ Greater confidence ▪ Inability to align between builders, ▪ Co-developed digital “construction” in 3 simple steps stakeholders on a suppliers, trades, and single platform ▪ 1 Start with a 2D plan homebuyers
2 ▪ Create a digital twin and receive cost estimates ▪ 3 Utilize 3D visualization technology prior to construction Where Smart Technology Meets Smart Building I N V E S T O R D A Y 2 0 2 3 – © B U I L D E R S F I R S T S O U R
C E 72

Growth: Monetizing Digital Assets to Increase Profitability Connecting
the Dots… …to Deliver Exceptional Value ▪ Comprehensive customer solutions Expand Deliver Enhance Grow Shoppable Fee-Based Existing Market Share ▪ Industry-leading innovation Product Digital Customer with New Catalog
Solutions Stickiness Customers ▪ Consistent shareholder value creation ▪ Sustainable, above-market growth rates Industry Leadership Drives Consistent Shareholder Value Creation I N V E S T O R D A Y 2 0 2 3 – © B U I L D E R S
F I R S T S O U R C E 73

Interview with an Early Technology Adopter TIM PAGE • EVP,
Digital Solutions MATT GREEN • President & CEO, Front Light Building I N V E S T O R D A Y 2 0 2 3 – © B U I L D E R S F I R S T S O U R C E 74

Key Takeaways 1 2 3 Strong commitment Significant progress on Continued
industry to value creation, our digital journey, leadership, providing achieving meaningful delivering on our cutting-edge digital progress toward commitments to solutions with a relentless goal of $1B in customers and focus on customer success
incremental product shareholders and value to empower revenue by 2026 the next generation of homebuilding I N V E S T O R D A Y 2 0 2 3 – © B U I L D E R S F I R S T S O U R C E 75

Financial Excellence and Long-Term Targets PETER JACKSON • Chief
Financial Officer I N V E S T O R D A Y 2 0 2 3 – © B U I L D E R S F I R S T S O U R C E 76

Key Messages Proven track record of execution and exceptional 1
financial results Continuous focus on margin expansion and 2 robust cash flow generation Fortress balance sheet fuels clear capital allocation 3 priorities to compound value for all stakeholders Well-positioned for profitable growth as we 4 continue
to lead the industry I N V E S T O R D A Y 2 0 2 3 – © B U I L D E R S F I R S T S O U R C E 77

Strong Historical Financial Performance and Margin Growth 1 Sales ($B)
Adj. EBITDA ($B) 12% CAGR (2019-2023E) 37% CAGR (2019-2023E) $22.7 7.7% 8.7% 11.2% 13.1% 13.5% $19.9 $5.0 $4.4 $17.0 $4.2 $0.6 $3.1 $2.1 $12.8 $2.8 $10.9 $0.3 $0.6 $1.3 $17.7 $16.4 $15.7 $12.5 $1.1 $11.5 $0.8 $2.3 $2.2 $1.8 $0.9 $1.1 ($0.6) ($0.1) 3
3 2019 2020 2021 2022 2023E 2019 2020 2021 2022 2023E SF Starts 888K 991K 1,127K 1,005K ~925K 1 2 Base Business Single Family Housing Starts (000s) Commodity <>$400mbf Adj. EBITDA Margin on Base Business CAGR Delivering Exceptional Results
With or Without Commodity Impact 1 Adjusted EBITDA and Adjusted EBITDA margin are Non-GAAP financial measures. See the non-GAAP Financial Measures slide in this presentation for a definition thereof and a discussion of certain 2 3 matters regarding
non-GAAP guidance. Source: U.S. Census and Freddie Mac, Evercore ISI Research, management estimates. 2023 estimate as provided on Q3 2023 earnings call on 11/1/23. * Non-GAAP financial measures; see Appendix for reconciliations to the most directly
comparable GAAP financial measures. I N V E S T O R D A Y 2 0 2 3 – © B U I L D E R S F I R S T S O U R C E 78

Solid Progress Against Base Business Targets Progress to Date
2021-2025E Targets 1 (Announced at Dec. 2021 Investor Day) (2021-2023E ) Revenue ($B) ~10% CAGR ~3% CAGR Adjusted EBITDA ($B) ~15% CAGR ~13% CAGR Adjusted EBITDA Margin ~50 bps ~115 bps (Annual Expansion) Adjusted EPS ~30% CAGR ~45% CAGR Compounding
Strong Financial Results in a Lower Starts Environment 1 2023 estimate as provided on Q3 2023 earnings call on 11/1/23. * Non-GAAP financial measures; see Appendix for reconciliations to the most directly comparable GAAP financial measures. I N V E
S T O R D A Y 2 0 2 3 – © B U I L D E R S F I R S T S O U R C E 79

Positioned to Outperform in All Market Scenarios Optionality to Manage
Across Environments BFS ADVANTAGES Weaker Economy Stronger Economy ✓ Manage fixed costs and overhead✓ Accelerate digital and technology Industry-Leading transformation ✓ Right-size network and optimize capacity Scale across
plants and yards✓ Identify and accelerate strong ROI projects ✓ Accelerate productivity projects ✓ Utilize excess FCF to increase share Operational repurchases ✓ Moderate CapEx where appropriate Excellence ✓
Leverage cost discipline to capitalize on ✓ Opportunistically capture market share economies of scale and expand margins Significant FCF Generation Ongoing Actions Efficient capacity Balance need Strong cash flow Working capital Fortress
Balance utilization and for variable cost generation and closely aligned to Sheet footprint reduction and focused capital demand signals optimization future capacity expenditures Multiple Levers to Further Compound Value for All Stakeholders *
Non-GAAP financial measures; see Appendix for reconciliations to the most directly comparable GAAP financial measures. I N V E S T O R D A Y 2 0 2 3 – © B U I L D E R S F I R S T S O U R C E 80

Strong Cash Flow Generation and Disciplined Working Capital Management
High Cash-Generating Effective Capital Substantial FCF ($B) & Adj. Net Income (%) Business $3.3 Allocation ▪ Low CapEx requirement: ▪ Strong FCF provides financial 1.5% to 2% of sales flexibility and multiple paths for capital
deployment ▪ Release large amount of $1.8 - $2.0 working capital that flexes ▪ Support growth both $1.5 with the size of the top line: organically and strategic ~10% incremental and tuck-in acquisitions decremental to sales ▪
Ongoing and disciplined ▪ Cash conversion is generally repurchases at attractive 105% 101% $0.3 76% around two-thirds of Adjusted long-term cost basis 49% EBITDA or 100% of Adjusted Net Income on the Base 1 2020PF 2021 2022 2023E Business Free
Cash Flow Adj. Net Income Robust FCF Generation Creates Shareholder Value 1 2023 estimate as provided on Q3 2023 earnings call on 11/1/23.. * Non-GAAP financial measures; see Appendix for reconciliations to the most directly comparable GAAP
financial measures. I N V E S T O R D A Y 2 0 2 3 – © B U I L D E R S F I R S T S O U R C E 81

Fortress Balance Sheet and Liquidity Provide Financial Resilience
Weighted Average Debt Maturity Low Net Leverage Profile 1 of ~7 Years ($B) 4.2x $2.0 $1.8 3.1x 5.3% 2.5x Avg. Rate (as of 11/21/23) 1.4x 1.3x 1.3x 1.3x $0.5 1.0x 0.7x 0.8x ~$0.2 2 2017 2018 2019 2020PF 2021 2022 2023E 2023 2024 2025 2026 2027 2028
2029 2030 2031 2032 ABL Senior Notes Base Business Leverage 1 Excludes finance leases and other finance obligations. Solid shading on ABL reflects forecast at year-end 2023. 2032 balance includes $1.3B of 4.25% and $0.7B of 6.375% notes. 2 2023
estimate as provided on Q3 2023 earnings call on 11/1/23. I N V E S T O R D A Y 2 0 2 3 – © B U I L D E R S F I R S T S O U R C E 82

Capital Allocation Continues to Drive Value Creation Consistent Capital
1 2022-2023E Deployed: $6.1B Allocation Priorities 1. Maintain Strong Balance Sheet $0.8B 2022-2025E ▪ Target Base Business leverage ratio $0.9B of 1.0x to 2.0x Deployable 2. Organic Growth Capital Goal ▪ Drive productivity and growth
with growth investments ~41% $7B-$10B $4.4B Shares Repurchased from 3. Inorganic Growth Announced at Dec. 2021 August 2021 through Q3 2023 ▪ Pursue margin accretive deals with Investor Day strategic, tuck-in M&A 4. Return Capital to
Shareholders Cumulative (Since 12/31/21)▪ Continue opportunistic share Share Repurchases Tuck-in M&A Organic Growth repurchases On Track to Deliver Deployable Capital Goal by 2025 1 2 2023 estimate as provided on Q3 2023 earnings call on
11/1/23. Deployable capital includes Organic Growth, which is inclusive of capital expenditures. Target assumes 1.0x to 2.0x Base Business leverage ratio. I N V E S T O R D A Y 2 0 2 3 – © B U I L D E R S F I R S T S O U R C E
83

Clear and Strategic Approach to Tuck-in M&A FINANCIAL STRATEGIC
FILTERS CRITERIA 1 2 3 Fit Product Size IRR > Cost ▪ Growth mindedness▪ Value add / specialty ▪ Advance leadership of Capital (e.g., Components, position in desirable ▪ Cultural alignment Millwork, Install) geographies
▪ Key leaders aligned ▪ Lumber only as an ▪ Enhance relative Clear add-on or foundation market strength (RMS) Synergy for growth (i.e., leader) in key products Opportunities I N V E S T O R D A Y 2 0 2 3 – © B U I L D E
R S F I R S T S O U R C E 84

Strong Track Record of Disciplined M&A Since 2021 DRIVING STRONG
OPERATIONAL AND FINANCIAL BENEFITS Specialty Building ~45% ~51% Products & Services Value- Value- 19% 20% 24% 24% Key Impacts Added Added 6% Lumber & Lumber Product Product Q4 Sheet Goods Growth in Mix Mix 2023E ▪ Continue to leverage
M&A 2021 Value Added Windows, Doors 25% as an accelerator of our Products 25% 36% & Millwork 27% growth strategy Manufactured Products ▪ Fill in market gaps ▪ Explore end markets / 19% 20% Single-Family service expansion 7%
Multi-Family 6% Q4 Growth in ▪ Optimize buy vs. build 2023E 13% 2021 Repair & Multi-Family capabilities (i.e., Greenfield) 67% as % of Mix Remodel/Other 75% Successful Acquisitions 14 Completed Since 2021 Investor Day Disciplined M&A
Playbook Driving Strong Returns I N V E S T O R D A Y 2 0 2 3 – © B U I L D E R S F I R S T S O U R C E 85

New 2026E Base Business Targets NEW 2024E-2026E TARGETS KEY DRIVERS
▪ Low- to mid-single-digit market growth ▪ Grow top-line faster than market as Single-Family returns to 1.1M starts Revenue ~9% CAGR▪ Digital ramp up and value-added products expansion ▪ Continued tuck-in M&A Adj. EBITDA
~12% CAGR ▪ Favorable value-added product mix ▪ Merger synergies ▪ Operational and commercial excellence ▪ Increased operating leverage Adj. EBITDA Margin ~30 bps Expansion Annually ▪ Organic and ongoing in-organic
growth ▪ Ongoing share buybacks Adj. EPS ~17% CAGR ▪ Leverage of 1.0x to 2.0x 1 Deployable Capital of $5.5B to $8.5B from 2024E to 2026E 1 Deployable capital includes Organic Growth, which is inclusive of capital expenditures. Target
assumes 1.0x to 2.0x Base Business leverage ratio. * Non-GAAP financial measures; see Appendix for reconciliations to the most directly comparable GAAP financial measures. I N V E S T O R D A Y 2 0 2 3 – © B U I L D E R S F I R S T S O U
R C E 86

1 Base Business Net Sales Bridge ($B) $1.2-$1.4 $21.2-$21.8 $2.0-$2.2
$1.6-$1.8 $16.4 >150 bps of Annual Above Market Growth ▪ Digital Investments ▪ Product Initiatives ▪ Additional Market Share Capture 2 ~9% Base Business Revenue CAGR Target from 2024E through 2026E 1 Estimate assumes $400/mbf
lumber & sheet good pricing. 2 2023 estimate as provided on Q3 2023 earnings call on 11/1/23. I N V E S T O R D A Y 2 0 2 3 – © B U I L D E R S F I R S T S O U R C E 87

1 Base Business Adjusted EBITDA Bridge ($M) $150-$200 $3,000-$3,200
$150-$200 $300-$350 $200-$250 $2,200 30-33% Long-term Normalized 3 Gross Margins 2 ~12% Base Business Adjusted EBITDA CAGR Target from 2024E through 2026E 1 2 3 Estimate assumes $400/mbf lumber & sheet good pricing. 2023 estimate as provided on
Q3 2023 earnings call on 11/1/23. Assumes a Normalized Environment with Expected Single-Family Housing Starts of 1.0-1.1M. * Non-GAAP financial measures; see Appendix for reconciliations to the most directly comparable GAAP financial measures. I N V
E S T O R D A Y 2 0 2 3 – © B U I L D E R S F I R S T S O U R C E 88

Allocating Capital to its Highest and Best Use Organic Growth Tuck-in
M&A Share Repurchases ~$3.0B-$6.0B Deployable 1 ~$1.5B Capital of $5.5B-$8.5B ~$1.0B (2024E-2026E) Accelerate investments in Pursue tuck-in acquisitions to Ongoing and disciplined digital and value-added augment current capabilities repurchases
at attractive products and add market share long-term cost basis 1 Deployable capital includes Organic Growth, which is inclusive of capital expenditures. Target assumes 1.0x to 2.0x Base Business leverage ratio. I N V E S T O R D A Y 2 0 2 3
– © B U I L D E R S F I R S T S O U R C E 89

1 Base Business Adjusted EPS Bridge $2.10-$2.20 $18.20-$18.60
$0.95-$1.00 $0.95-$1.00 $1.65-$1.75 $1.00-$1.10 $11.55 2 3 ~17% Base Business Adjusted EPS CAGR Target from 2024E through 2026E 1 2 3 Estimate assumes $400/mbf lumber & sheet good pricing. 2023 estimate as provided on Q3 2023 earnings call on
11/1/23. Assumes $3B cumulative share buyback over three years, subject to Board approval; 1.0x leverage. * Non-GAAP financial measures; see Appendix for reconciliations to the most directly comparable GAAP financial measures. Adjusted Net Income
per Diluted Share is defined as Adjusted Net Income divided by weighted average diluted common shares outstanding. I N V E S T O R D A Y 2 0 2 3 – © B U I L D E R S F I R S T S O U R C E 90

Continue to Drive Long-Term Shareholder Value Creation Sales CAGR Adj.
EBITDA CAGR Adj. EBITDA Margin Adj. EBITDA Margin 2023E EV / Adj. EBITDA 4 (2015 to 2023E) (2015 to 2023E) (2023E) Expansion vs. Peers (2015 to 2023E) 18.5% 16.5x 15.9% 39% 1,026 bps 26% 8.6x 7.7x 7.0% 15.7% 13.5% 10.8% 305 bps 8% 90 bps BLDR
Building BLDR Building BLDR Building BLDR Building Building Base Products Industrial Base Products Industrial Base Products Industrial Base Products Industrial Products Industrial 1 2 3 1 2 3 1 2 3 1 2 3 2 3 Business Distributors Distributors
Business Distributors Distributors Business Distributors Distributors Business Distributors Distributors BLDR Distributors Distributors 1 2 Source: FactSet. Note: 2023 estimate as provided on Q3 2023 earnings call on 11/1/23. Estimate assumes
$400/mbf lumber & sheet good pricing. Building Products Distributors represent median 3 4 values for IBP, GMS, BECN and SITE. Industrial Distributors represent median value for FAST, GWW, MSM and WSO. Source FactSet. Multiples based on
Enterprise Value as of 11/9/2023. * Non-GAAP financial measures; see Appendix for reconciliations to the most directly comparable GAAP financial measures. I N V E S T O R D A Y 2 0 2 3 – © B U I L D E R S F I R S T S O U R C E
91

Key Takeaways 1 2 3 4 Fortress balance Well-positioned for Proven track
record Continuous focus on sheet fuels clear profitable growth of execution and margin expansion capital allocation as we continue to exceptional and robust cash priorities to lead the industry financial results flow generation compound value for
all stakeholders I N V E S T O R D A Y 2 0 2 3 – © B U I L D E R S F I R S T S O U R C E 92

Closing Remarks DAVE RUSH • President & Chief Executive
Officer I N V E S T O R D A Y 2 0 2 3 – © B U I L D E R S F I R S T S O U R C E 93

Builders FirstSource Investment Thesis Creating opportunity by
addressing builder Leveraging robust FCF generation 1 3 problems and delivering value-added from resilient business model and broad products and solutions across cycles; strong product portfolio to fuel disciplined track record and experienced
management team capital deployment Investing for growth through new digital Executing our profitable growth 4 2 innovations and building science that will strategy and compounding long-term deliver greater efficiency across homebuilding shareholder
value and enhance product and service offerings Revenue CAGR ~9% 1 Deployable Capital of 2024E to 2026E Adj. EBITDA CAGR ~12% Base Business $5.5B to $8.5B Adj. EBITDA Margin Expansion Annually ~30 bps Targets from 2024E to 2026E Adj. EPS Growth CAGR
~17% 1 Deployable Capital includes Organic Growth, which is inclusive of capital expenditures. Target assumes 1.0x to 2.0x Base Business leverage ratio. * Non-GAAP financial measures; see Appendix for reconciliation to the most directly comparable
GAAP financial measures. I N V E S T O R D A Y 2 0 2 3 – © B U I L D E R S F I R S T S O U R C E 94

Q&A I N V E S T O R D A Y 2 0 2 3 – © B U I L D E R S F
I R S T S O U R C E 95

APPENDIX Non-GAAP Reconciliations I N V E S T O R D A Y 2 0 2 3 –
© B U I L D E R S F I R S T S O U R C E 96

Non-GAAP to GAAP Reconciliation Tables BUILDERS FIRSTSOURCE, INC. AND
SUBSIDIARIES Reconciliation of Adjusted Non-GAAP Financial Measures to their GAAP Equivalents (unaudited) Fiscal Year Nine Months Ended (Pro Forma) (Pro Forma) September 30, (in millions) 2019 2020 2021 2022 2023 Reconciliation to Adjusted EBITDA:
GAAP net income $ 331.7 $ 484.8 $ 1,725.4 $ 2,749.4 $ 1,189.9 Acquisition and related expense 8.3 50.0 118.0 47.8 26.9 Technology implementation expense 11.8 - 7.9 29.0 51.6 (1) Debt issuance and refinancing cost - 29.4 8.1 27.4 0.7 Amortization
expense 34.1 42.2 358.1 302.6 252.9 Tax-effect of adjustments to net income (13.0) (29.2) (118.1) (97.6) (79.7) Adjusted net income $ 372.9 $ 577.2 $ 2,099.4 $ 3,058.6 $ 1,442.3 Weighted average diluted common shares 184.4 207.0 203.5 163.5 130.7
Diluted adjusted net income per share: $ 2.02 $ 2.79 $ 10.32 $ 18.71 $ 11.03 Reconciling items: Depreciation expense $ 138.1 $ 155.4 $ 189.3 $ 194.6 $ 163.2 Interest expense, net 128.7 128.6 127.8 171.0 145.3 Income tax expense 110.6 177.5 644.2
920.1 430.4 Stock compensation expense 24.7 33.0 25.0 31.3 35.5 (2) Other management-identified adjustments 2.1 0.2 (25.4) 1.0 (2.9) Adjusted EBITDA $ 777.1 $ 1,071.9 $ 3,060.3 $ 4,376.6 $ 2,213.8 Adjusted EBITDA margin 7.1% 8.4% 15.4% 19.3% 17.1%
(1) Costs associated with issuing and extinguishing long term debt in 2021 and 2022. (2) Primarily relates to severance, gain on sale of assets, and other one-time costs. Fiscal Year Nine Months Ended (Pro Forma) (Pro Forma) September 30, (in
millions) 2019 2020 2021 2022 2023 Free Cash Flow Operating activities $ 750.0 $ 467.5 $ 1,743.5 $ 3,599.2 $ 1,695.2 Less: Capital expenditures, net of proceeds (190.8) (181.2) (214.3) (329.5) (333.0) Free cash flow $ 559.2 $ 286.3 $ 1,529.2 $
3,269.7 $ 1,362.2 I N V E S T O R D A Y 2 0 2 3 – © B U I L D E R S F I R S T S O U R C E 97

SPEAKER BIOS I N V E S T O R D A Y 2 0 2 3 – © B U I L D E R
S F I R S T S O U R C E 98

Speaker Bios DAVE RUSH • Chief Executive Officer Dave Rush is the
chief executive officer of Builders FirstSource. Prior to his appointment, Mr. Rush served as executive vice president of the Strategic Management Office (SMO). In this role, he was responsible for developing processes to prioritize, coordinate, and
manage corporate and field initiatives to help deliver the company’s long-term strategy and provide better value to our team members and other stakeholders. Mr. Rush also previously held the title of executive vice president of Builders First
Source’s Integration Management Office (IMO), where he partnered with the executive leadership team, senior management, and field leaders to build key processes to efficiently integrate BMC and Builders FirstSource and captured value
opportunities related to the merger. Mr. Rush started his career with BFS in 1999 with the acquisition of Pelican Companies, where he was vice president of finance. In 2003, he moved into operations as area vice president for South Carolina, North
Carolina, and Tennessee until 2015. Mr. Rush was instrumental in the acquisition of ProBuild as the legacy Builders FirstSource Senior Integration Leader through 2017. He also served as SVP of strategy and business development, overseeing merger and
acquisition work, business line reviews, and other special projects, and as COO of Builders FirstSource’s eastern division. Mr. Rush earned his bachelor’s in accounting from the University of North Carolina at Chapel Hill. I N V E S T O
R D A Y 2 0 2 3 – © B U I L D E R S F I R S T S O U R C E 99

Speaker Bios PETER JACKSON • Chief Financial Officer Peter
Jackson is chief financial officer of Builders FirstSource. He is responsible for accounting and controls, financial planning and analysis, investor relations, treasury, tax, mergers & acquisitions, and information technology. Prior to the
merger of Builders FirstSource and BMC, Mr. Jackson served as the Builders FirstSource Chief Financial Officer. Mr. Jackson brings over 25 years of global financial management experience. He came to Builders FirstSource from Lennox International,
Inc., where he served as the Global Refrigeration Segment CFO, the VP of finance – FP&A and M&A, and Heating & Cooling Segment CFO from 2007 – 2016. Before joining Lennox, Mr. Jackson held multiple financial leadership
positions at large scale manufacturing businesses including SPX Corporation, General Electric, and Gerber Scientific after starting his career in public accounting. He serves on the advisory board for Dedman Law’s Rowling Center for Business
Law & Leadership at Southern Methodist University. Mr. Jackson earned his bachelor’s degree in business administration from Bryant University. He holds a master’s in business administration from Rensselaer Polytechnic Institute. I N
V E S T O R D A Y 2 0 2 3 – © B U I L D E R S F I R S T S O U R C E 100

Speaker Bios STEVE HERRON • Chief Operating Officer Steve Herron
is chief operating officer of Builders FirstSource. He is responsible for overseeing the performance and day-to-day operational and administrative functions of the company. Prior to this appointment, Mr. Herron served as president of Builders
FirstSource’s eastern division. Following the merger of Builders FirstSource and BMC Stock Holdings, Mr. Herron served as SVP of operations for Builders FirstSource’s Gulf-South Region. Before joining BFS, Mr. Herron held the title of
SVP of operations for ProBuild Holdings from 2011 to 2015, where he was responsible for all locations in the southeastern United States. Prior to that, he served as SVP for HD Supply Holdings and oversaw the lumber and building materials (LBM)
division. He also assisted in the sale of the LBM Division to ProBuild in May of 2008. Mr. Herron has over 38 years of experience in the building products industry and has held senior management roles at Home Depot, Lowe’s, and Williams
Brothers Lumber. I N V E S T O R D A Y 2 0 2 3 – © B U I L D E R S F I R S T S O U R C E 101

Speaker Bios TIM JOHNSON • EVP, Legal, Safety, and ESG Tim
Johnson is executive vice president, general counsel, and corporate secretary of Builders FirstSource. He is responsible for legal, compliance, ethics, corporate governance, mergers and acquisitions, real estate, intellectual property, litigation,
and risk management for the company. Prior to the merger of Builders FirstSource and BMC, Mr. Johnson served as executive vice president, general counsel, and corporate secretary of BMC. Mr. Johnson brings over 15 years of private and corporate
legal experience to the company. He previously served as senior vice president and general counsel of Ply Gem, a leading manufacturer of building products based in Cary, North Carolina. Prior to joining Ply Gem in 2008, Mr. Johnson was vice
president and regional counsel of Arysta LifeScience, a global agriculture company specializing in crop protection and life science brands, from 2006 to 2008. Previously, Mr. Johnson was an attorney with the international law firms of Hunton Andrews
Kurth and Wilson Sonsini Goodrich & Rosati. Mr. Johnson holds a Bachelor of Arts in biology from Taylor University and a Juris Doctor from Duke University School of Law. I N V E S T O R D A Y 2 0 2 3 – © B U I L D E R S F I R S T S O
U R C E 102

Speaker Bios AMY BASS MESSERSMITH • Chief People Officer Amy
Bass Messersmith is chief people officer of Builders FirstSource. She is responsible for collaborating with the executive team, senior management, and field leadership to ensure human resources works to meet the needs of our people and our business.
Furthermore, Mrs. Messersmith is responsible for championing the Builders FirstSource core value of putting people first, building a culture that fuels strong business results and focusing on how the company attracts, develops, and retains the right
talent. Prior to joining Builders FirstSource, Mrs. Messersmith served as Chief Human Resources Officer for U.S. Anesthesia Partners. She has also held senior human resources positions at TDI Industries, Pizza Hut, Inc., PepsiCo, Inc., Frito Lay
North America, PricewaterhouseCoopers, and Accenture Consulting. She serves on the Southern Methodist University CHRO Advisory Board, the SMU Cox School of Business Graduate Program Mentorship Board, and the Dallas CHRO Advisory Board. Mrs.
Messersmith is also a member of the Dallas Executive Women’s Roundtable and National HR Masterminds Group. Mrs. Messersmith earned her Bachelor of Business Administration degree in management and human resources from Texas A&M University.
I N V E S T O R D A Y 2 0 2 3 – © B U I L D E R S F I R S T S O U R C E 103

Speaker Bios MIKE FARMER • President, Commercial Operations Mike
Farmer is president of commercial operations at Builders FirstSource. He leads the company’s commercial efforts, including sales and national accounts, marketing, customer segment strategy, and innovation. In this role, Mr. Farmer is
responsible for leading the implementation of commercial operations best practices to create sustainable growth and drive innovation through best in class manufacturing capabilities in components, millwork, and READY-FRAME®, while providing an
exceptional customer experience. Mr. Farmer previously served as executive vice president of operational excellence, people and growth at BMC. Before that, he worked as the company’s senior vice president of human resources. Mr. Farmer joined
Stock Building Supply in 2006, which merged with BMC in 2015, as a member of its human resources department. Prior to that, Mr. Farmer held a number of leadership positions at ATX-CoreComm. Mr. Farmer earned his bachelor’s degree from Hope
College and master’s degree from Michigan State University, and he has completed executive development programs at the Wharton School of the University of Pennsylvania and at Harvard University. Mr. Farmer is also a notable leader of the NC
Triangle Area Leukemia & Lymphoma Society. I N V E S T O R D A Y 2 0 2 3 – © B U I L D E R S F I R S T S O U R C E 104

Speaker Bios TIM PAGE • EVP, Digital Solutions Tim Page is
executive vice president of digital solutions at Builders FirstSource. He is responsible for accelerating the company’s digital journey and business results through developing technologies that create customer value and drive efficiency in
residential homebuilding. Mr. Page has responsibility over our recent digital acquisitions to deliver innovative technology products that streamline the interaction of construction process participants. Prior to the merger of Builders FirstSource
and BMC, Mr. Page served as senior vice president of strategy and business development and SVP of integration at Builders FirstSource. He came to the company through the ProBuild, Inc. acquisition in 2015, where he served in a variety of executive
roles, including SVP of strategy and technology and vice president of operations finance. He began his career at Honeywell, where he gained experience across multiple industries and held several executive level roles in finance, general management,
and sales and marketing Mr. Page earned his bachelor’s degree in finance from Providence College. I N V E S T O R D A Y 2 0 2 3 – © B U I L D E R S F I R S T S O U R C E 105

Speaker Bios HEATHER KOS • SVP, Investor Relations Heather Kos
is senior vice president of investor relations for Builders FirstSource. She is responsible for broadening the reach of Builders FirstSource with investors and analysts to ensure they understand the value it holds, while working to attract new
investors to the company’s story. Ms. Kos brings more than 20 years of investor relations experience, with extensive knowledge in finance and the investment community, having developed and implemented comprehensive investor relations programs
for three Fortune 500 companies. She came to Builders FirstSource from Univar Solutions, where she served as vice president of investor relations and communications. Prior to that, she led investor relations and corporate communications for
Ingredion and Navistar. Ms. Kos earned her bachelor’s from Michigan State University and MBA from DePaul University. She is a Certified Public Accountant (CPA) and an Investor Relations Charter holder. Additionally, she is an active member of
the National Investor Relations Institute’s Senior Roundtable and is chair of the Chicago National Institute of Investor Relations Chapter. I N V E S T O R D A Y 2 0 2 3 – © B U I L D E R S F I R S T S O U R C E 106
v3.23.3
| X |
- DefinitionBoolean flag that is true when the XBRL content amends previously-filed or accepted submission.
| Name: |
dei_AmendmentFlag |
| Namespace Prefix: |
dei_ |
| Data Type: |
xbrli:booleanItemType |
| Balance Type: |
na |
| Period Type: |
duration |
|
| X |
- DefinitionFor the EDGAR submission types of Form 8-K: the date of the report, the date of the earliest event reported; for the EDGAR submission types of Form N-1A: the filing date; for all other submission types: the end of the reporting or transition period. The format of the date is YYYY-MM-DD.
| Name: |
dei_DocumentPeriodEndDate |
| Namespace Prefix: |
dei_ |
| Data Type: |
xbrli:dateItemType |
| Balance Type: |
na |
| Period Type: |
duration |
|
| X |
- DefinitionThe type of document being provided (such as 10-K, 10-Q, 485BPOS, etc). The document type is limited to the same value as the supporting SEC submission type, or the word 'Other'.
| Name: |
dei_DocumentType |
| Namespace Prefix: |
dei_ |
| Data Type: |
dei:submissionTypeItemType |
| Balance Type: |
na |
| Period Type: |
duration |
|
| X |
- DefinitionAddress Line 1 such as Attn, Building Name, Street Name
| Name: |
dei_EntityAddressAddressLine1 |
| Namespace Prefix: |
dei_ |
| Data Type: |
xbrli:normalizedStringItemType |
| Balance Type: |
na |
| Period Type: |
duration |
|
| X |
- DefinitionAddress Line 2 such as Street or Suite number
| Name: |
dei_EntityAddressAddressLine2 |
| Namespace Prefix: |
dei_ |
| Data Type: |
xbrli:normalizedStringItemType |
| Balance Type: |
na |
| Period Type: |
duration |
|
| X |
- Definition
+ References
+ Details
| Name: |
dei_EntityAddressCityOrTown |
| Namespace Prefix: |
dei_ |
| Data Type: |
xbrli:normalizedStringItemType |
| Balance Type: |
na |
| Period Type: |
duration |
|
| X |
- DefinitionCode for the postal or zip code
| Name: |
dei_EntityAddressPostalZipCode |
| Namespace Prefix: |
dei_ |
| Data Type: |
xbrli:normalizedStringItemType |
| Balance Type: |
na |
| Period Type: |
duration |
|
| X |
- DefinitionName of the state or province.
| Name: |
dei_EntityAddressStateOrProvince |
| Namespace Prefix: |
dei_ |
| Data Type: |
dei:stateOrProvinceItemType |
| Balance Type: |
na |
| Period Type: |
duration |
|
| X |
- DefinitionA unique 10-digit SEC-issued value to identify entities that have filed disclosures with the SEC. It is commonly abbreviated as CIK. Reference 1: http://www.xbrl.org/2003/role/presentationRef
-Publisher SEC
-Name Exchange Act
-Number 240
-Section 12
-Subsection b-2
| Name: |
dei_EntityCentralIndexKey |
| Namespace Prefix: |
dei_ |
| Data Type: |
dei:centralIndexKeyItemType |
| Balance Type: |
na |
| Period Type: |
duration |
|
| X |
- DefinitionIndicate if registrant meets the emerging growth company criteria. Reference 1: http://www.xbrl.org/2003/role/presentationRef
-Publisher SEC
-Name Exchange Act
-Number 240
-Section 12
-Subsection b-2
| Name: |
dei_EntityEmergingGrowthCompany |
| Namespace Prefix: |
dei_ |
| Data Type: |
xbrli:booleanItemType |
| Balance Type: |
na |
| Period Type: |
duration |
|
| X |
- DefinitionCommission file number. The field allows up to 17 characters. The prefix may contain 1-3 digits, the sequence number may contain 1-8 digits, the optional suffix may contain 1-4 characters, and the fields are separated with a hyphen.
| Name: |
dei_EntityFileNumber |
| Namespace Prefix: |
dei_ |
| Data Type: |
dei:fileNumberItemType |
| Balance Type: |
na |
| Period Type: |
duration |
|
| X |
- DefinitionTwo-character EDGAR code representing the state or country of incorporation.
| Name: |
dei_EntityIncorporationStateCountryCode |
| Namespace Prefix: |
dei_ |
| Data Type: |
dei:edgarStateCountryItemType |
| Balance Type: |
na |
| Period Type: |
duration |
|
| X |
- DefinitionThe exact name of the entity filing the report as specified in its charter, which is required by forms filed with the SEC. Reference 1: http://www.xbrl.org/2003/role/presentationRef
-Publisher SEC
-Name Exchange Act
-Number 240
-Section 12
-Subsection b-2
| Name: |
dei_EntityRegistrantName |
| Namespace Prefix: |
dei_ |
| Data Type: |
xbrli:normalizedStringItemType |
| Balance Type: |
na |
| Period Type: |
duration |
|
| X |
- DefinitionThe Tax Identification Number (TIN), also known as an Employer Identification Number (EIN), is a unique 9-digit value assigned by the IRS. Reference 1: http://www.xbrl.org/2003/role/presentationRef
-Publisher SEC
-Name Exchange Act
-Number 240
-Section 12
-Subsection b-2
| Name: |
dei_EntityTaxIdentificationNumber |
| Namespace Prefix: |
dei_ |
| Data Type: |
dei:employerIdItemType |
| Balance Type: |
na |
| Period Type: |
duration |
|
| X |
- DefinitionLocal phone number for entity.
| Name: |
dei_LocalPhoneNumber |
| Namespace Prefix: |
dei_ |
| Data Type: |
xbrli:normalizedStringItemType |
| Balance Type: |
na |
| Period Type: |
duration |
|
| X |
- DefinitionBoolean flag that is true when the Form 8-K filing is intended to satisfy the filing obligation of the registrant as pre-commencement communications pursuant to Rule 13e-4(c) under the Exchange Act. Reference 1: http://www.xbrl.org/2003/role/presentationRef
-Publisher SEC
-Name Exchange Act
-Number 240
-Section 13e
-Subsection 4c
| Name: |
dei_PreCommencementIssuerTenderOffer |
| Namespace Prefix: |
dei_ |
| Data Type: |
xbrli:booleanItemType |
| Balance Type: |
na |
| Period Type: |
duration |
|
| X |
- DefinitionBoolean flag that is true when the Form 8-K filing is intended to satisfy the filing obligation of the registrant as pre-commencement communications pursuant to Rule 14d-2(b) under the Exchange Act. Reference 1: http://www.xbrl.org/2003/role/presentationRef
-Publisher SEC
-Name Exchange Act
-Number 240
-Section 14d
-Subsection 2b
| Name: |
dei_PreCommencementTenderOffer |
| Namespace Prefix: |
dei_ |
| Data Type: |
xbrli:booleanItemType |
| Balance Type: |
na |
| Period Type: |
duration |
|
| X |
- DefinitionTitle of a 12(b) registered security. Reference 1: http://www.xbrl.org/2003/role/presentationRef
-Publisher SEC
-Name Exchange Act
-Number 240
-Section 12
-Subsection b
| Name: |
dei_Security12bTitle |
| Namespace Prefix: |
dei_ |
| Data Type: |
dei:securityTitleItemType |
| Balance Type: |
na |
| Period Type: |
duration |
|
| X |
- DefinitionName of the Exchange on which a security is registered. Reference 1: http://www.xbrl.org/2003/role/presentationRef
-Publisher SEC
-Name Exchange Act
-Number 240
-Section 12
-Subsection d1-1
| Name: |
dei_SecurityExchangeName |
| Namespace Prefix: |
dei_ |
| Data Type: |
dei:edgarExchangeCodeItemType |
| Balance Type: |
na |
| Period Type: |
duration |
|
| X |
- DefinitionBoolean flag that is true when the Form 8-K filing is intended to satisfy the filing obligation of the registrant as soliciting material pursuant to Rule 14a-12 under the Exchange Act. Reference 1: http://www.xbrl.org/2003/role/presentationRef
-Publisher SEC
-Name Exchange Act
-Section 14a
-Number 240
-Subsection 12
| Name: |
dei_SolicitingMaterial |
| Namespace Prefix: |
dei_ |
| Data Type: |
xbrli:booleanItemType |
| Balance Type: |
na |
| Period Type: |
duration |
|
| X |
- DefinitionTrading symbol of an instrument as listed on an exchange.
| Name: |
dei_TradingSymbol |
| Namespace Prefix: |
dei_ |
| Data Type: |
dei:tradingSymbolItemType |
| Balance Type: |
na |
| Period Type: |
duration |
|
| X |
- DefinitionBoolean flag that is true when the Form 8-K filing is intended to satisfy the filing obligation of the registrant as written communications pursuant to Rule 425 under the Securities Act. Reference 1: http://www.xbrl.org/2003/role/presentationRef
-Publisher SEC
-Name Securities Act
-Number 230
-Section 425
| Name: |
dei_WrittenCommunications |
| Namespace Prefix: |
dei_ |
| Data Type: |
xbrli:booleanItemType |
| Balance Type: |
na |
| Period Type: |
duration |
|
Builders FirstSource (NYSE:BLDR)
Historical Stock Chart
From Apr 2024 to May 2024

Builders FirstSource (NYSE:BLDR)
Historical Stock Chart
From May 2023 to May 2024
