ALLETE, Inc. (NYSE:ALE) today reported second quarter 2013
earnings of 35 cents per share on net income of $14.0 million and
operating revenue of $235.6 million, compared to 39 cents per share
on net income of $14.4 million and operating revenue of $216.4
million in 2012.
ALLETE's Regulated Operations segment, which includes Minnesota
Power, Superior Water, Light and Power and the company's investment
in the American Transmission Company, recorded net income of $16.3
million versus $14.4 million in 2012.
Second quarter 2013 results were impacted by several factors
attributable to Minnesota Power's recent capital investments.
Higher revenue from renewable energy investments and federal
production tax credits were partially offset by increases in
depreciation and interest expense. In late 2012, Minnesota Power
completed two phases of the Bison Wind Energy Center and both have
been in service during 2013. Total electric sales also rose 2.2
percent compared to a year ago.
“Industrial demand for power remains strong,” said ALLETE
Chairman, President and CEO Al Hodnik. “Based on demand nominations
received from our largest power users this week, these customers
expect to run at full-capacity for the remainder of the year.”
ALLETE's Investments and Other segment, which includes results
from BNI Coal, ALLETE Properties, ALLETE Clean Energy, and other
miscellaneous income and expense, recorded a $2.3 million net loss
during the quarter, versus a break-even quarter a year ago. Higher
state income tax and interest expense contributed to the variance
from the second quarter in 2012. State income tax expense was
higher in 2013 as more North Dakota income tax credits attributable
to our North Dakota capital investments were recognized in
2012.
Year-to-date financial results included 2013 earnings of $1.18
per share on net income of $46.5 million and operating revenue of
$499.4 million, compared to $1.05 per share on net income of $38.8
million and operating revenue of $456.4 million in 2012. An
increase from a year ago in the average number of common stock
shares outstanding, with proceeds used to fund the company's
capital investment program, resulted in dilution of seven cents per
share.
“The year-to-date results are right where we expected them to
be,” Hodnik said. “The company's full year earnings guidance
remains unchanged, in an expected range of between $2.58 and $2.78
per share.” He said 2013 guidance assumes continued strong
industrial demand for electricity, higher cost recovery rider
revenue and federal production tax credits, higher operating and
maintenance, depreciation and interest expenses, and dilution from
equity issuances of between $0.10 and $0.15 per share.
The company will host a conference call and webcast at 10 a.m.
Eastern time today to discuss details of its quarterly performance.
Interested parties may listen live by calling (877) 303-5852, or by
accessing the webcast at www.allete.com. A replay of the call will
be available through August 4, 2013 by dialing (855) 859-2056, pass
code 99389011.
ALLETE is an energy company headquartered in Duluth, Minn. In
addition to its electric utilities, Minnesota Power and Superior
Water, Light and Power of Wisconsin, ALLETE owns BNI Coal in
Center, N.D., ALLETE Clean Energy, based in Duluth, and has an
eight percent equity interest in the American Transmission Co. More
information about ALLETE is available at www.allete.com.
The statements contained in this release and statements that
ALLETE may make orally in connection with this release that are not
historical facts, are forward-looking statements. Actual results
may differ materially from those projected in the forward-looking
statements. These forward-looking statements involve risks and
uncertainties and investors are directed to the risks discussed in
documents filed by ALLETE with the Securities and Exchange
Commission.
ALLETE's press releases and other communications may include
certain non-Generally Accepted Accounting Principles (GAAP)
financial measures. A "non-GAAP financial measure" is defined as a
numerical measure of a company's financial performance, financial
position or cash flows that excludes (or includes) amounts that are
included in (or excluded from) the most directly comparable measure
calculated and presented in accordance with GAAP in the company's
financial statements.
Non-GAAP financial measures utilized by the Company include
presentations of earnings (loss) per share. ALLETE's management
believes that these non-GAAP financial measures provide useful
information to investors by removing the effect of variances in
GAAP reported results of operations that are not indicative of
changes in the fundamental earnings power of the Company's
operations. Management believes that the presentation of the
non-GAAP financial measures is appropriate and enables investors
and analysts to more accurately compare the company's ongoing
financial performance over the periods presented.
ALLETE, Inc. Consolidated Statement of
Income
Millions Except Per Share Amounts –
Unaudited
Quarter Ended Six
Months Ended June 30, June 30,
2013 2012
2013 2012 Operating Revenue
$ 235.6 $ 216.4
$ 499.4 $ 456.4
Operating Expenses Fuel and Purchased Power
78.7 72.1 165.2 149.2 Operating and Maintenance 103.8 96.2 208.5
196.1 Depreciation 28.7
24.8 56.9
49.4 Total Operating Expenses 211.2 193.1 430.6 394.7
Operating Income 24.4
23.3 68.8
61.7
Other Income
(Expense) Interest Expense (12.8 ) (10.1 ) (25.1 ) (21.1 )
Equity Earnings in ATC 5.0 4.8 10.2 9.4 Other
1.5 1.2 4.2
1.9 Total Other Expense
(6.3 ) (4.1 )
(10.7 ) (9.8 )
Income Before
Income Taxes 18.1 19.2 58.1 51.9
Income Tax Expense
4.1 4.8
11.6 13.1
Net Income $ 14.0 $ 14.4
$ 46.5 $ 38.8
Average Shares of Common Stock Basic 39.4 37.3 39.2
37.0 Diluted 39.6
37.4 39.3
37.1
Basic Earnings Per Share of Common Stock
$ 0.36 $ 0.39 $ 1.19 $ 1.05
Diluted Earnings Per Share of Common
Stock $ 0.35 $ 0.39 $ 1.18 $ 1.05
Dividends Per Share
of Common Stock $ 0.475 $
0.46 $ 0.95 $ 0.92
Consolidated Balance Sheet Millions –
Unaudited Jun. 30, Dec.
31, Jun. 30,
Dec. 31, 2013 2012
2013
2012 Assets Liabilities and Shareholders’
Equity Cash and Cash Equivalents $ 145.0 $ 80.8 Current
Liabilities $ 193.1 $ 283.4 Other Current Assets 175.9 192.4
Long-Term Debt 1,064.7 933.6
Property, Plant and Equipment -
2,397.2 2,347.6 Deferred Income Taxes 435.5 423.8
Net
Regulatory Assets 337.5 340.3 Regulatory Liabilities 63.1 60.1
Investment in ATC 111.2 107.3 Defined Benefit Pension & Other
216.2 228.2 Postretirement Benefit Plans Other Investments 140.2
143.5 Other Non-Current Liabilities 129.3 123.3 Other Non-Current
Assets 43.9 41.5
Shareholders’ Equity 1,249.0
1,201.0
Total Assets $ 3,350.9 $
3,253.4
Total Liabilities and Shareholders’
Equity $ 3,350.9 $ 3,253.4
Quarter Ended Six Months Ended
ALLETE, Inc. June 30, June 30, Income
(Loss) 2013 2012
2013 2012 Millions
Regulated Operations $ 16.3 $ 14.4 $ 48.4 $
38.8 Investments and Other (2.3 )
— (1.9 ) —
Net Income Attributable to ALLETE $ 14.0
$ 14.4 $ 46.5 $
38.8
Diluted Earnings Per Share $ 0.35
$ 0.39 $ 1.18 $
1.05
Statistical Data
Corporate
Common Stock High $ 52.25 $ 41.99 $ 52.25 $ 42.49 Low $ 46.85 $
38.03 $ 41.39 $ 38.03 Close $ 49.85 $ 41.80 $ 49.85 $ 41.80 Book
Value $ 31.12 $ 29.24 $ 31.12 $ 29.24
Kilowatt-hours
Sold
Millions Regulated Utility Retail and
Municipals Residential 251 226 605 552 Commercial 335 326 712 690
Municipals 225 234 499 498 Industrial 1,769
1,842 3,614
3,710 Total Retail and Municipal 2,580 2,628
5,430 5,450 Other Power Suppliers 610
492 1,201
1,009 Total Regulated Utility 3,190 3,120 6,631 6,459
Non-regulated Energy Operations 33
25 64
55 Total Kilowatt-hours Sold
3,223 3,145 6,695
6,514
Regulated Utility
Revenue
Millions Regulated Utility Revenue
Retail and Municipals Residential $ 23.2 $ 20.5 $ 56.2 $ 49.9
Commercial 27.5 24.7 58.8 51.9 Municipals 15.8 13.9 32.4 31.3
Industrial 95.4
93.5 197.6 191.3
Total Retail and Municipals 161.9 152.6 345.0 324.4 Other Power
Suppliers 22.4 17.7 44.7 36.4 Other 31.5
26.7 67.5
54.8 Total Regulated Utility Revenue
$ 215.8 $ 197.0 $ 457.2
$ 415.6
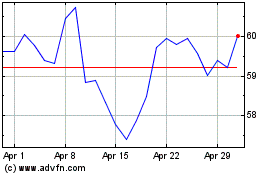
Allete (NYSE:ALE)
Historical Stock Chart
From Aug 2024 to Sep 2024

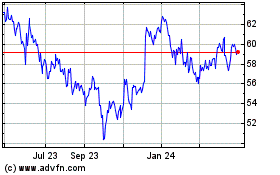
Allete (NYSE:ALE)
Historical Stock Chart
From Sep 2023 to Sep 2024
