Southern Missouri Bancorp, Inc. ("Company") (NASDAQ: SMBC), the
parent corporation of Southern Missouri Bank and Trust Co.
("Bank"), today announced net income for the first quarter of
fiscal 2006 of $695,000, or $.31 per diluted share as compared to
$.35 per diluted share earned during the same period of the prior
year. The decrease in diluted earnings per share was primarily due
to a 21.9% decrease in non-interest income, partially offset by the
20.0% decrease in provision for loan losses. In the September 2004
quarter, the Company recognized combined income of $159,000, or
$.05, per diluted share from the sale of equities and dividends
earned on equities. Dividend Declared The Company is pleased to
announce that the Board of Directors, on October 18, 2005, declared
its 46th consecutive quarterly dividend since the inception of the
Company. The $.09 cash dividend will be paid on November 30, 2005,
to shareholders of record at the close of business on November 15,
2005. The Board of Directors and management believe the
continuation of a quarterly dividend enhances shareholder value and
demonstrates our commitment to and confidence in our future
prospects. Balance Sheet Summary The Company experienced balance
sheet growth with total assets increasing $11.1 million, or 3.4%,
to $341.5 million at September 30, 2005, as compared to $330.4
million at June 30, 2005. This growth was attributed primarily to
increases in the balance of the loan portfolio and cash balances.
Asset growth has been funded primarily with deposits and FHLB
advances. Loans, net of allowance for loan losses, as of September
30, 2005, increased $9.0 million to $276.6 million, or 3.4%, as
compared to $267.6 million at June 30, 2005. The increase in the
loan portfolio reflects growth in the balances of commercial,
commercial real estate and one-to-four family loans of $4.5
million, $2.7 million and $2.2 million, respectively. Asset quality
remains relatively strong with net loan charge-offs for the first
three months of 2006 totaling .03% of average loans compared with
.01% last year. Our allowance for loan loss at September 30, 2005,
totaled $2.0 million, representing .74% of total loans and 338.8%
of non-performing loans. Total liabilities increased $10.7 million
to $316.1 million as compared to $305.4 million at June 30, 2005.
Deposits increased $6.8 million to $231.5 million at September 30,
2005, as compared to $224.7 million at June 30, 2005. The increase
in deposits was primarily due to the $13.8 million increase in
certificates of deposits (CDs) as a result of special term and rate
CDs, partially offset by the decreases in money market and saving
accounts of $7.3 million. FHLB advances increased $6.3 million to
$67.8 million as compared to $61.5 million at June 30, 2005, while
securities sold under agreements to repurchase decreased by $2.6
million to $8.1 million from $10.7 million at June 30, 2005. The
average loans to deposit ratio for the quarter was 120.1% as
compared to 121.2% for the same period of the prior year. The
Company's stockholders' equity increased $398,000, to $25.4 million
at September 30, 2005, from $25.0 million at June 30, 2005. The
increase was primarily due to net income, partially offset by cash
dividends and the decrease in market value of the investment
portfolio. Income Statement Summary The Company's net interest
income for the first quarter of fiscal 2006 increased $25,000 to
$2.3 million as compared to the same period of the prior year. The
increase was primarily due to an increase in average interest
earning assets, partially offset by a decrease in average spread.
The net interest rate spread for the three-month period ended
September 30, 2005, was 2.75% as compared to 2.78% for the fourth
quarter of fiscal year 2005, and 2.89% for the same period of the
prior year. The decrease in interest rate spread from quarter to
quarter was primarily a result of Federal Home Loan Bank of Des
Moines change in their dividend rate paid from 3.8% to 1.4%. The
Company's non-interest income for the first quarter of fiscal 2006
decreased $151,000 to $540,000, which represented a 21.9% decrease
from the $691,000 earned during the same period of the prior year.
The decrease was primarily due to the prior quarter results
including $121,000 in gains realized on sale of equity investments
and $38,000 of dividend income received on equities. Non-interest
expense for the first quarter of fiscal 2006 increased $75,000 to
$1.7 million which represented a 4.6% increase from the $1.6
million expensed during the same period of the prior year.
Non-interest expense increased due to compensation expenses,
professional fees and expenses related to technology enhancements.
The Company continues to evaluate opportunities to become more
efficient. The Company has previously announced its intention to
repurchase up to 115,000 shares of its common stock, or
approximately 5% of its outstanding common shares. To date, the
Company has repurchased 89,000 shares at an average cost of $15.17
per share. The Company at this time is not actively purchasing
shares of its common stock, but market conditions, business
opportunities and other economic conditions may alter our outlook
on repurchasing common stock. On September 30, 2005, the Company
had 2,232,816 common shares outstanding. The common stock traded
between $13.90 and $15.06 per share during the quarter ended
September 30, 2005, with the last trade of the quarter occurring at
$14.35. The Company, through its banking subsidiary, provides a
wide array of financial services to Southeastern Missouri through
its main office located in Poplar Bluff and seven other
full-service facilities located in Poplar Bluff, Dexter, Qulin,
Kennett, Doniphan, and Van Buren, Missouri. Except for the
historical information contained herein, the matters discussed in
this press release may be deemed to be forward-looking statements
that involve risks and uncertainties, including changes in economic
conditions in the Company's market area, changes in policies by
regulatory agencies, fluctuations in interest rates, demand for
loans in the Company's market area and competition. Actual
strategies and results in future periods may differ materially from
those currently expected. These forward-looking statements
represent the Company's judgment as of the date of this release.
The Company disclaims however, any intent or obligation to update
these forward-looking statements. -0- *T SOUTHERN MISSOURI BANCORP,
INC. UNAUDITED CONDENSED CONSOLIDATED FINANCIAL INFORMATION
September 30, June 30, Selected Financial Data at: 2005 2005
--------------------------- ------------- ------------- Total
assets $341,482,000 $330,360,000 Available-for-sale securities
34,939,000 34,700,000 Loans, net 276,640,000 267,568,000 Allowance
for losses on loans 2,049,000 2,017,000 Non-performing assets
722,000 658,000 Deposits 231,474,000 224,666,000 FHLB advances
67,750,000 61,500,000 Securities sold under repurchase agreements
8,118,000 10,757,000 Subordinated Debt 7,217,000 7,217,000
Stockholders' equity 25,401,000 25,003,000 Equity to assets ratio
7.44% 7.57% Allowance as a percentage of loans 0.74% 0.75%
Non-performing loans as a percentage of loans 0.22% 0.21% Per
common share: Closing Market Price 14.35 14.50 Tangible book value
10.28 10.07 *T -0- *T Three Months Ended September 30, Selected
Operating Data: 2005 2004 ------------------------ -----------
----------- Net interest income $2,348,000 $2,323,000 Provision for
loan losses 120,000 150,000 Noninterest income 540,000 691,000
Noninterest expense 1,718,000 1,643,000 Income taxes 355,000
428,000 ----------- ----------- Net income $695,000 $793,000
=========== =========== Per common share: Net earnings: Basic $.31
$.36 Diluted $.31 $.35 Cash dividends $.09 $.09 Average basic
shares outstanding 2,223,765 2,231,856 Average diluted shares
outstanding 2,276,577 2,295,654 Profitability Ratios:
--------------------- Return on average assets .83% 1.00% Return on
average common equity 11.04% 12.02% Net interest margin 2.99% 3.11%
Net interest spread 2.75% 2.89% Efficiency Ratio 59.47% 54.51% *T
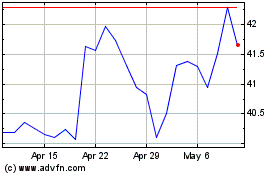
Southern Missouri Bancorp (NASDAQ:SMBC)
Historical Stock Chart
From Jun 2024 to Jul 2024

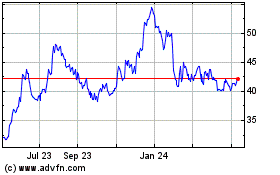
Southern Missouri Bancorp (NASDAQ:SMBC)
Historical Stock Chart
From Jul 2023 to Jul 2024
