UNITED STATES
SECURITIES AND EXCHANGE COMMISSION

Washington, D.C. 20549


FORM 6-K


REPORT OF FOREIGN ISSUER
PURSUANT TO RULE 13a-16 OR 15d-16 OF THE
SECURITIES EXCHANGE ACT OF 1934


For the month July  2023


(Commission File No. 001-35193)


Grifols, S.A.

(Translation of registrant’s name into English)


Avinguda de la Generalitat, 152-158

Parc de Negocis Can Sant Joan

Sant Cugat del Valles 08174

Barcelona, Spain

(Address of registrant’s principal executive office)


Indicate by check mark whether the registrant files or will file annual reports under cover Form 20-F or Form 40-F.


Form 20-F  x  Form 40-F  ¨


Indicate by check mark if the registrant is submitting the Form 6-K in paper as permitted by Regulation S-T Rule 101 (b) (1):


Yes  ¨  No  x


Indicate by check mark if the registrant is submitting the Form 6-K in paper as permitted by Regulation S-T Rule 101 (b) (7):


Yes  ¨  No  x


Indicate by check mark whether the registrant by furnishing the information contained in this Form is also thereby furnishing the information to the Commission pursuant to Rule 12g3-2(b) under the Securities Exchange Act of 1934.


Yes  ¨  No  x


If “Yes” is marked, indicate below the file number assigned to the registrant in connection with Rule 12g3-2(b): 82-         .                       .


Grifols, S.A.


TABLE OF CONTENTS


Item   Sequential Page Number
     
1. Press release, dated July 27, 2023   4


GRAPHIC

Page 1 of 5 Half year 2023 Results Grifols delivers 15% revenue growth, accelerates margin expansion in Q2 and raises guidance for FY23 1234 Barcelona, Spain, July 27, 2023 - Grifols (MCE:GRF, MCE:GRF.P, NASDAQ:GRFS), a global healthcare company and leading manufacturer of plasma-derived medicines, reported strong financial results in the first half of 2023. The company has accelerated progress on its strategic objectives toward achieving operational excellence, whilst deleveraging and creating value for all stakeholders. Thomas Glanzmann, Grifols’ Executive Chairman and CEO, commented: “We have delivered a strong performance in the second quarter, exceeding guidance. The revenue and profit growth reflect Grifols’ solid fundamentals as momentum continues to build from successfully executing on our commitments. The deployment of our Operational Improvement Plan is already bearing fruit, driving profitability and further margin expansion. We are making significant progress toward achieving our key priorities, enabling us to raise guidance for the second time this year as we continue to accelerate the company’s turnaround strategy. Grifols is well positioned for continued success, supported by our sound business model, strong financial discipline and commercial execution, and underpinned by our innovative pipeline and strengthened performance culture.” 1 Operating or constant currency (cc) excludes changes rate variations reported in the period 2 Compared to 2022 full year figures, before the effect of inflation 3 Jun’23 YTD vs. Jun’22 YTD (excl. Biotest) 4 Jun’23 vs. July’22 (U.S. data) 5 Leverage ratio consistently calculated based on the credit facilities agreement and including Biotest • Total revenue increases to EUR 3,225 million (+14.8%; +13.1% cc1 ) in the first six months of the year, driven by Biopharma • Adjusted EBITDA margin of 22.2% exceeds guidance, reaching EUR 655 million driven by 23.4% margin in the second quarter (excl. Biotest) • Achieved 100% deployment of EUR 450 million2 annualized cash cost savings plan • Plasma supply growth accelerates to +12%3 , while cost per liter (CPL) declines by 20%4 supporting further margin expansion • Reported net income returns to profit and reaches EUR 52 million in Q2’23 and stands at EUR (56) million in 1H’23, impacted by the EUR 140 million one-time restructuring costs (both incl. Biotest). Adjusted net income of EUR 114 million (EUR 89 million in 2Q’23). • Leverage ratio of 6.9x5 , with commitment to reduce to 4.0x by end of 2024 • Completed 7 innovation milestones set for the first half of the year and on track to achieve the remaining 5 in the second half • 2023 revenue guidance increases to 10-12% (incl. Biotest). Adjusted EBITDA margin guidance further improves to 24% for the full year (excl. Biotest), leading to an adjusted EBITDA of EUR 1,400-1,450m (incl. Biotest)

GRAPHIC

Page 2 of 5 Business performance Total revenue grew 13.1% cc (+14.8% on a reported basis) compared to the first half of 2022, reaching EUR 3,225 million. The second quarter delivered growths for Biopharma, Diagnostic and Bio Supplies triggering a total growth of 8.8% cc (+7.8%) up to EUR 1,664 million. Excluding Biotest, revenue totaled EUR 2,968 million year-to-date; +7.7% cc; +9.4%. Biopharma revenue grew by 14.9% cc (+16.7% on a reported basis) to EUR 2,698 million in the first half of the year and by 10.0% cc (+9.1%) to EUR 1,408 million in the second quarter. The main drivers were robust underlying demand for key proteins, solid plasma supply, and a favourable pricing and product mix. Sales of immunoglobulin, Grifols’ flagship product, grew by 13.6% cc, backed by subcutaneous immunoglobulin (SCIG) Xembify® ’s +25.9% cc growth. Grifols Biopharma revenue, excluding Biotest, grew by 8.4% cc (+10.2%), reaching EUR 2,441 million year-to-date. Grifols is further strengthening its immunoglobulin franchise through a strategy focused on the immunodeficiency market – which comprises the highest-growth primary (PI) and secondary (SID) indications – while maintaining leadership in neurology and acute care. The company aims to continue growing its franchise in the U.S. and prioritize other select countries, while accelerating the adoption of Xembify® .. The company initiated its commercialization in Europe in June. Diagnostic recorded revenue of EUR 341 million in the first half of 2023, a year-on-year increase of 3.0% cc (+3.7% on a reported basis), and EUR 165 million in the second quarter with a growth of 5.1% cc (+3.3%). Blood typing solutions’ positive performance (+7.0% cc YTD) was noteworthy across key regions. Excluding the commercial true-up of EUR 19 million in recombinant proteins, adjusted revenue declined by 2.4% cc (-2.1% reported) year-to-date. Bio Supplies grew by 53.9% cc (+57.2% on a reported basis) to EUR 83 million, and by 41.1% cc (+40.1%) to EUR 40 million in the second quarter, leveraging the benefits of the Access Biologicals integration. Plasma supply and Cost per liter Grifols continues to increase plasma supply while effectively reducing its cost per liter (CPL), supporting further margin expansion. Plasma supply increased by 12% and cost per liter declined by 20% in June compared to the peak in July’22, sequentially improving from the 15% reported in March. The main levers have been the reduction in donor commitment compensation, which stabilized in the second quarter, and the optimization of the plasma-center network. Going forward, the reduction of other plasma costs, streamlined operations and overhead, lean processes, and digitalization, is expected to lead to further CPL improvement. The reduction of plasma costs is the result of the successful execution of the Operational Improvement Plan, which has now been 100% deployed. Grifols is on track to deliver the EUR 450 million annualized cash cost savings, of which most are related to initiatives to enhance plasma operations.

GRAPHIC

Page 3 of 5 Financial performance and leverage Gross margin increased to 37.6% (36.4% including Biotest) year-to-date. This was driven by a 38.5% margin (37.2% including Biotest) in the second quarter of 2023, up from 36.7% in the previous quarter. The company is beginning to recognize in the P&L the benefits from the CPL decline that started in the third quarter of 2022. Based on the nine-month lag of the industry’s inventory accounting, the CPL improvement will lead to a further sequential margin expansion in the second half of 2023 and FY24. Adjusted EBITDA reached EUR 655 million (EUR 659 million including Biotest) in the first six months of the year, representing a 22.2% margin, driven by a 23.4% margin in the second quarter (20.6% and 21.7% including Biotest, respectively), reflecting a significant sequential improvement from 21.0% in the first quarter. This rebound was supported by the growth of all Business Units led by Biopharma, cash cost savings from the Operational Improvement Plan, and operational leverage. Adjusted EBITDA excludes EUR 135 million of one off charges, including mainly the EUR 140 million of one-time restructuring costs recognized in the first quarter of the year. Adjusted net income totalled EUR 114 million (EUR 89 million in second quarter), including Biotest. Reported EBITDA stood at EUR 520 million year-to-date and EUR 346 million in the second quarter (EUR 524 million and EUR 351 million including Biotest, respectively). Reported net profit totalled EUR 70 million in the second quarter and contributes to a first half of the year standing at EUR (11) million (EUR 52 million and EUR (56) million including Biotest, respectively). Grifols reiterates its commitment to deleveraging its balance sheet, with its leverage ratio standing at 6.9x in the first half of 2023 and remains on track to reach the target of 4.0x by the end of 2024. Organic EBITDA improvement is expected to be the major lever, while the company is working with the intent to close one deleveraging transaction by year-end. Excluding the impact of IFRS 1665net financial debt totalled EUR 9,421.5 million. As of June 30, 2023, Grifols had a liquidity position of EUR 1,162 million and a cash position of EUR 523 million. Innovation Grifols continued the solid progression of its innovation pipeline, with the company meeting 7 milestones in the first half of 2023, highlighting the finalization of the enrolment of both the PRECIOSA and SPARTA studies in the second quarter of the year. Moreover, Biotest trials continue to advance significantly. Noteworthy milestones achieved include the initiation of Trimodulin ESsCAPE trial study, with the first sites active, and the Yimmugo® BLA FDA submission. In parallel, all milestones expected for the second half of the year are progressing as expected. 6 As of June 2023, the impact of IFRS 16 on total debt is EUR 991.0 million

GRAPHIC

Page 4 of 5 Raised guidance for 2023 Period Previous New REVENUE (at cc) Total revenue growth (incl. Biotest) FY23 8-10% 10-12% Biopharma revenue growth (incl. Biotest) FY23 10-12% 12-14% EBITDA Adjusted Margin (excl. Biotest) H1’23 21%+ 22.2%+ H2’23 23-25% 24-25% FY23 22-24% 24% Adjusted (incl. Biotest) FY23 EUR 1.4bn+ EUR 1,400-1,450m Proforma annualizing savings (excl. Biotest) FY23 EUR 1.7bn+ 27-28% EUR c.1,750m 28-29% CONFERENCE CALL Grifols will host a conference call at 2.30pm CET / 8.30am EST on Thursday, July 27, 2023 to discuss its Q2’23 financial results, as reflected in the Company's Q2’23 Results Presentation. To listen to the webcast and view the Q2’23 Results Presentation, please click on Q2 2023 Results Participants are advised to register in advance of the conference call. The transcript and webcast replay of the call will be available on our web site at www.grifols.com/en/investors within 24 hours after the end of the live conference call. INVESTORS: Grifols Investors Relations & Sustainability inversores@grifols.com - investors@grifols.com sostenibilidad@grifols.com - sustainability@grifols.com Tel. +34 93 571 02 21 MEDIA CONTACTS: Grifols Press Office media@grifols.com / Tel. +34 93 571 00 02 Spain Duomo Comunicación Tel.: +34 91 311 92 89 – +34 91 311 92 90 Raquel Lumbreras (M. +34 659 572 185) Raquel_lumbreras@duomocomunicacion.com Borja Gómez (M. +34 650 402 225) Borja_gomez@duomocomunicacion.com International FGS Global Email: Grifols@fgsglobal.com Tel.: +44 20 7251 3801 Charles.Obrien@fgsglobal.com James.Gray@fgsglobal.com

GRAPHIC

Page 5 of 5 About Grifols Grifols is a global healthcare company founded in Barcelona in 1909 committed to improving the health and well-being of people around the world. A leader in essential plasma-derived medicines and transfusion medicine, the company develops, produces, and provides innovative healthcare services and solutions in more than 110 countries. Patient needs and Grifols’ ever-growing knowledge of many chronic, rare and prevalent conditions, at times life-threatening, drive the company’s innovation in both plasma and other biopharmaceuticals to enhance quality of life. Grifols is focused on treating conditions across a broad range of therapeutic areas: immunology, hepatology and intensive care, pulmonology, hematology, neurology, and infectious diseases. A pioneer in the plasma industry, Grifols continues to grow its network of donation centers, the world’s largest with over 390 across North America, Europe, Africa and the Middle East, and China. As a recognized leader in transfusion medicine, Grifols offers a comprehensive portfolio of solutions designed to enhance safety from donation to transfusion, in addition to clinical diagnostic technologies. It provides high-quality biological supplies for life-science research, clinical trials, and for manufacturing pharmaceutical and diagnostic products. The company also supplies tools, information and services that enable hospitals, pharmacies and healthcare professionals to efficiently deliver expert medical care. Grifols, with more than 24,000 employees in more than 30 countries and regions, is committed to a sustainable business model that sets the standard for continuous innovation, quality, safety, and ethical leadership. In 2022, Grifols’ economic impact in its core countries of operation was EUR 9.6 billion. The company also generated 193,000 jobs, including indirect and induced. The company’s class A shares are listed on the Spanish Stock Exchange, where they are part of the Ibex-35 (MCE:GRF). Grifols non-voting class B shares are listed on the Mercado Continuo (MCE:GRF.P) and on the U.S. NASDAQ through ADRs (NASDAQ:GRFS). For more information about Grifols, please visit www.grifols.com

GRAPHIC

Q2 2023 Results July 27, 2023 Successfully Executing and Delivering on Commitments

GRAPHIC

Q2 2023 Results - 2 - Important Information This presentation does not constitute an offer or invitation to purchase or subscribe shares, in accordance with the provisions of the Spanish Securities Market and Investment Services Law (Law 6/2023, of 17 March, as amended and restated from time to time), Royal Decree 1310/2005, of November 4, and its implementing regulations. In addition, this document does not constitute an offer of purchase, sale or exchange, nor a request for an offer of purchase, sale or exchange of securities, nor a request for any vote or approval in any other jurisdiction. Forward-Looking Statements This presentation contains forward-looking information and statements about GRIFOLS based on current assumptions and forecast made by GRIFOLS management, including pro forma figures, estimates and their underlying assumptions, statements regarding plans, objectives and expectations with respect to capital expenditures, synergies, products and services, and statements regarding future performance. Forward-looking statements are statements that are not historical facts and are generally identified by the words “expected”, “potential”, “estimates” and similar expressions. Although Grifols believes that the expectations reflected in such forward-looking statements are reasonable, various known and unknown risks, uncertainties and other factors could lead to material differences between the actual future results, financial situation, development or performance of the Company and the estimates given here. These factors include those discussed in our public reports filed with the Comisión Nacional del Mercado de Valores and the Securities and Exchange Commission, which are accessible to the public. The Company assumes no liability whatsoever to update these forward-looking statements or conform them to future events or developments. Forward-looking statements are not guarantees of future performance. They have not been reviewed by the auditors of Grifols. NON-GAAP Financial Measures This presentation refers to certain non-GAAP financial measures. The presentation of these financial measures is not intended to be considered in isolation, or as a substitute for, or superior to, the financial information prepared and presented in accordance with GAAP. Investors are cautioned that there are material limitations associated with the use of non-GAAP financial measures as an analytical tool. In addition, these measures may be different from non-GAAP financial measures used by other companies, limiting their usefulness for comparative purposes. We compensate for these limitations by providing specific information regarding GAAP amounts excluded from these non-GAAP financial measures. A reconciliation of these non-GAAP financial measures to the most directly comparable GAAP financial measures can be found in our Grifols Financial Statements. Legal Disclaimer

GRAPHIC

Q2 2023 Results - 3 - 1. Our Turnaround Strategy 2. Performance by Business Unit 3. Group Financial Performance Table of Contents 4. Final Remarks 5. Annex

GRAPHIC

Q2 2023 Results - 4 - Turnaround Strategy Successfully Executing and Delivering on Commitments Strong first half of 2023 backed by excellent execution, financial discipline and reinforced performance culture Operational performance • Double-digit revenues growth driven by Biopharma • Adjusted EBITDA margin of 22.2% (23.4% in Q2’23) • Operational improvement plan 100% deployed, leading to EUR 450m+ cash cost savings • Plasma supply and cost per liter continue to gain momentum Guidance • Revenues and adjusted EBITDA margin exceeded H1’23 guidance • Raised H2’23 and FY23 guidance for revenues and adjusted EBITDA Deleveraging • Leverage ratio continues to decline as EBITDA improves • Committed to 4x leverage ratio by end-2024 • Several workstreams in process Sustainable growth Margin expansion Optimized capital allocation Towards achieving our goals

GRAPHIC

Q2 2023 Results - 5 - 1. Our Turnaround Strategy 2. Performance by Business Unit 3. Group Financial Performance Table of Contents 4. Final Remarks 5. Annex

GRAPHIC

Q2 2023 Results - 6 - Performance by Business Unit Revenue Growth Driven by Biopharma 98 185 160 258 257 H1 2022 Biopharma 10 Diagnostic 28 Bio Supplies 14 Others & Intersegments 2,921 H1 2023 (cc) H1 2023 2,968 FX 46 2,810 3,179 3,225 2,712 Grifols excl. Biotest Biotest Grifols incl. Biotest Revenues 2,968 257 3,225 % growth +9.4% +161.6% +14.8% % growth at cc +7.7% +162.5% +13.1% Biopharma 2,441 257 2,698 % growth +10.2% +161.6% +16.7% % growth at cc +8.4% +162.5% +14.9% Diagnostic 341 - 341 % growth +3.7% - +3.7% % growth at cc +3.0% - +3.0% Bio Supplies 83 - 83 % growth +57.2% - +57.2% % growth at cc +53.9% - +53.9% Others 103 - 103 % growth -10.9% - -10.9% % growth at cc -11.7% - -11.7% H1 2023 (EUR in millions) +8.4% cc +3.0% cc +53.9% cc +13.1% cc (incl. Biotest) +7.7% cc (excl. Biotest) +14.8% (incl. Biotest) +9.4% (excl. Biotest) -18.1% cc

GRAPHIC

Q2 2023 Results - 7 - Performance by Business Unit | Biopharma (excl. Biotest) Key Plasma Proteins Show Significant Growth Led by Immunoglobulin Alpha-1 & Specialty proteins IG 55-60% of revenues Albumin 10-15% of revenues 25-30% of revenues +6.3% +7.3% cc Q2’23 +10.2% +8.4% cc H1’23 • Strong demand and positive pricing in the U.S. Important uptick in sales growth ex-U.S. • Higher Xembify® (SCIG) demand in the U.S. +13.6% +5.1% • Favorable pricing and higher demand in China and RoW • Partially offsetting lower demand in the U.S. +0.3% • Higher alpha-1 volume in the U.S., partially offsetting lower volume in some European countries • Strong anti-rabies’ performance driven by higher demand and favorable customer mix in the U.S. • Lower pdFVIII demand in U.S. Revenue performance by business line in H1’23 (at cc) • Initiation of Xembify® European commercialization, launched in Spain • Repeat Use Procedure (RUP) for Xembify® to extend its registration for approval in 5 additional European countries (Denmark, Iceland, Norway, Poland and Portugal) • Launch of direct-to-consumer Alpha-1 buccal swab in the U.S. • Support Albumin in Egypt launch at EXCON congress; new Albumin license in Egypt • Vistaseal™/Veraseal™ launch in Korea and Switzerland Commercial milestones

GRAPHIC

Q2 2023 Results - 8 - Performance by Business Unit | Biopharma | Immunoglobulin Strengthening Our IG Franchise to Support Future Performance Strong IG outlook 1 €14bn+ market High-single-digit long-term growth Primary and secondary immunodeficiencies gaining momentum 9-10% growth (2018-2025) 1 1 Source: MRB Report Analysis of the 2018 IVIG/SCIG Market in the United States and 2025 Forecast Our growth strategy… and short-term catalysts (12-18 months) Focus on continued growth in U.S. and key ex-U.S. countries 40-55% of IG market uses 2 Focus on large unmet medical need in immunodeficiency market and accelerate Xembify®‘s adoption 3 Maintain leadership in neurology and acute care • Gamunex® market launch in New Zealand and Italy targeting CIDP • Gamunex® EU launch for new indication (MG severe exacerbation) • Gamunex® EU launch for new indication (measles indication) • Launch of Xembify® pre-filled syringes • Launch of Xembify® bi-weekly dosing • Launch in Australia, Spain and other EU countries • Pursue new indications • IG supply levels to meet customer demand • Increased focus on improving diagnosis and treatment rates Q2 2023 Xembify Grifols' IG share Focus on accelerating adoption ~5%

GRAPHIC

Q2 2023 Results - 9 - Performance by Business Unit | Biopharma | Innovation Achieved Innovation Milestones Expected in H1 and On Track for H2 Completed On track 1 As of July 27, 2023 Moved Milestone 2023 timing Status1 Details New Product & Indication Finalize enrollment of the PRECIOSA study H1 Enrollment completed in May (410 subjects) following a successful acceleration plan (avg ~20 pt/mo in the last 12Mo) Alpha-1 AT 15% SC study advancement from single to repeat dose phase H1 Progress within Ph1/2 study. Positive PK & Safety data for single dose enabled to move to repeat dose phase First patient enrolled and treated in Xembify® SID-CLL study H1 H2 US first sites active. Accelerating Europe activation GIGA564 IND submission H2 IND preparation on track for submission GIGA2339 pre-IND submission H2 Pre-IND preparation on track to receive FDA guidance Lifecycle Management Final results of Xembify® bi-weekly dosing study H1 Positive results. FDA Submission planned for Q3’23 Final results of IVIG-PEG study H1 Positive results Finalize enrolment of the SPARTA study H1 H2 Ahead of schedule Enrolment completed in June (339 subjects) Biotest Trimodulin ESsCAPE trial study initiation H1 First sites active Yimmugo® BLA FDA submission H1 FDA submission completed in June Fibrinogen ADFIRST trial completed and top line study results H2 Enrollment close to completion Cytotect PreCyssion trial last patient expected H2 Enrollment ongoing

GRAPHIC

Q2 2023 Results - 10 - Performance by Business Unit | Diagnostic Blood Typing Solutions Driving Performance +3.3% +5.1% cc Q2’23 +3.7% +3.0% cc H1’23 Reported Adjusted -2.1% -2.4% cc • Extended agreement up to 20 years with CTS; impact on pricing • Partially offset by higher demand in Japan, Indonesia and Philippines • Important contract renewals and continued expansion in Ireland, Spain, South Africa, and Eastern Europe among other geographies -2.6% +7.0% • Strong performance across regions, remarkably in U.S. on the back of contracts with large GPOs, IDNs, and commercial labs. • Double-digit growth in Argentina, Brazil, Indonesia, and the Middle East • Sales of Gel-card ramping up in volume and price • Diagnostic company commercial true-up partially offset by lower joint business profits • Signed a 10-year supply agreement with Siemens +23.8% -11.3% adjusted Recombinant proteins NAT Donor Screening 55-60% of revenues Blood Typing Solutions (BTS) 15-20% of revenues Revenue performance by business line in H1’23 (at cc) • Launch of AlphaID™ At Home Genetic Health Risk Service, the first-ever free direct-to-consumer program in the U.S cleared by FDA, to screen for genetic risk of alpha-1 • Signed a 10-year extension contract agreement with Licon, a Mexican company specializing in clinical diagnostics and transfusion medicine • First IVDR certificates for our Diagnostic products classified in risk class D (highest level); includes al reagent red blood cells and some gel cards Commercial milestones 25-30% of revenues

GRAPHIC

Q2 2023 Results - 11 - Performance by Business Unit | Bio Supplies Integration of Access Biologicals Continues to Bear Fruit Plasma hyperimmune sales to third parties Bio Supplies Biopharma 50-55% of revenues Bio Supplies Diagnostic 25-30% of revenues 20-25% of revenues • Cell Therapy portfolio expansion through Access Biologicals acquisition and Leukopaks consolidation in EU • Grifols legacy business growth driven by new customers +38.6% +102.7% • Growth driven by broader portfolio from Access acquisition • Improved margins of Blood derived products related to operational optimization plan +45.3% • Higher sales due to phasing in existing contracts Revenue performance by business line in H1’23 (at cc) +40.1% +41.1% cc Q2’23 +57.2% +53.9% cc H1’23

GRAPHIC

Q2 2023 Results - 12 - Table of Contents 1. Our Turnaround Strategy 3. Group Financial Performance 4. Final Remarks 5. Annex 2. Performance by Business Unit

GRAPHIC

Q2 2023 Results - 13 - Group Financial Performance Exceeded Revenue and EBITDA Guidance Revenues (H1’23) incl. Biotest 6.9x Leverage ratio1 €1.2bn Liquidity +12% Plasma supply3 -20% Cost per liter (CPL)4 €3,225m +14.8%; +13.1% cc (Biopharma +16.7%; +14.9% cc) 1 Consistently calculated based on the credit facilities agreement and including Biotest; 2 Excluding EUR 84m restructuring cash out 3 Jun’23 YTD vs. Jun’22 YTD (excl. Biotest); 4 Jun’23 vs. July’22 (U.S. data) Adjusted EBITDA excl. Biotest Cash Flow Balance sheet Plasma Operational Improvement Plan +8-10% cc +10-12% cc Exceeding previous FY23 guidance 23.4% €356m 22.2% €655m 100% deployment of the EUR 450m+ annualized cash cost savings Positive Adj. Oper. Cash Flow2 21%+ Exceeding H1’23 guidance Q2’23 H1’23

GRAPHIC

Q2 2023 Results - 14 - Q2’22 Q3’22 Q4’22 Q1’23 Q2’23 Group Financial Performance Strong Second Quarter Supporting Sequential Financial Improvement • Backed by robust underlying demand, pricing and product mix led by SCIG • Mid-to-high single-digit growth driven by Biopharma, following solid plasma supply Revenue Leverage ratio1 939 1,040 1,174 1,220 1,272 21.1% 21.0% 20.3% 21.0% 23.4% 18.0% 19.0% 20.0% 21.0% 22.0% 23.0% 24.0% 25.0% 26.0% 27.0% 350.00 450.00 550.00 650.00 750.00 850.00 950.00 1050.00 1150.00 1250.00 1350.00 Adjusted EBITDA LTM (excl. Biotest) Adjusted EBITDA Margin quarterly (excl. Biotest) Q2’22 Q3’22 Q4’22 Q1’23 Q2’23 • Sequential Adj. EBITDA expansion supported by: – Strong business performance – Operational improvement plan driving cash cost savings – Operational leverage • Continuous commitment to debt reduction, targeting 4x leverage ratio by end of 2024 Operating performance (EUR in millions) Q2’22 Q3’22 Q4’22 Q1’23 Q2’23 1 Consistently calculated based on credit facilities agreement and incl. Biotest investment 5,108 5,417 5,703 5,880 5,960 4,044 4,355 4,644 4,795 4,871 3000.0 3500.0 4000.0 4500.0 5000.0 5500.0 6000.0 6500.0 Total revenue LTM (excl. Biotest) Biopharma revenue LTM (excl. Biotest) 9.0x 8.6x 7.1x 7.0x 6.9x LR (EUR in millions) +17% +35% -2.1x

GRAPHIC

Q2 2023 Results - 15 - Adjusted EBITDA Continues to Expand Driven by Biopharma Group Financial Performance | Adjusted EBITDA excl. Biotest H1’23 vs. H1’22 (EUR in millions) Note: the variations of Biopharma, Diagnostic and Bio Supplies refer only to Gross margin 78 135 Biopharma 11 Diagnostic 19 Bio Supplies 9 Opex 2 Reported EBITDA H1’23 Adjusted One offs EBITDA H1’23 Others 562 655 520 Adjusted EBITDA H1’22 20.7% Includes the EUR 140m restructuring charge, EUR (19)m one-off in Diagnostic revenues commercial true-up and EUR 14m transaction costs 22.2% +93m +17%

GRAPHIC

Q2 2023 Results - 16 - Group Financial Performance | Operational Improvement Plan Excellent Execution: 100% Deployment of the EUR 450m+ Annualized Cash Cost Savings Initiatives 75% of initiatives are plasma-related, triggering cash savings first and subsequently booked in the P&L, following the 9-months inventory accounting of the plasma industry Cash Flow (Cash cost savings) P&L (Cost savings) Total EUR 450m+1 EUR 160m EUR 75m EUR 290m+ EUR 55m+ H1’23 end-2023 end-2024 EUR 85m Acceleration of the initiatives’ deployment Plasma cost and operations EUR 340m Non-plasma costs EUR 110m 1 Compared to 2022 full year figures, before the effect of inflation Q4’22 EUR 235m EUR 395m EUR 160m

GRAPHIC

Q2 2023 Results - 17 - 84 89 94 99 104 Q1'22 Q2'22 Q3'22 Q4'22 Q1'23 Q2'23 -10% -15% -20% Base 100 Operational Improvement Plan Underpins Further Cost Per Liter Decline Group Financial Performance | Operational Improvement Plan Cost per liter (CPL) Note: all figures compared with July’22 peak; 20% taking Jun’23, 15% taking March’23 and 10% taking avg. Q4’22 (U.S. data) CPL decline driven by initiatives framed in the Operational Improvement Plan ✓ Reduction of donor commitment compensation ✓ Plasma-center network rationalization ✓ Staffing optimization Plasma supply growth +12% Jun’23 YTD vs. Jun’22 YTD Q2’23 105 90 100 95 85 ✓ Reduction of other plasma costs resulting from process optimization, streamlined operations and overheads, lean processes and digitalization Main drivers as of H1’23 Main drivers going forward

GRAPHIC

Q2 2023 Results - 18 - 84 89 94 99 104 Q1'22 Q2'22 Q3'22 Q4'22 Q1'23 Q2'23 Base 100 Lower Cost per Liter Drives Incremental Margin Expansion Group Financial Performance | Operational Improvement Plan Cost per liter (CPL) Adjusted Gross Margin Biopharma (excl. Biotest) Graph for illustrative purposes from Q2’23 onwards 9-month lag to gross margin impact mostly coming into the P&L in 2024 105 90 100 95 85 Q2’23 Q3’23 Q4’23 250bps+ in H2’23 vs. H1’23 CPL Gross margin

GRAPHIC

Q2 2023 Results - 19 - EBITDA Improvement and Transactions Support Deleveraging Path Group Financial Performance | Leverage Ratio FY22 LTM H1’23 FY24E 0.2x Deleverage path H1’23 5.0x 7.1x 6.9x 1.9x 1.0x 4.0x Roadmap to deleveraging1 (Leverage ratio) Cash and cash equivalents €0.5bn 1 Leverage ratio calculated based on the credit facilities agreement and including Biotest and assuming a debt of ~EUR 9.5bn Levers 1 Operational Improvement Plan EUR 450m+ annualized cash cost savings 2 Revenue growth, pricing, product and geo mix and operational leverage 3 Progress on deleveraging transactions On June 14, Grifols announced a potential deal in China involving Shanghai RAAS with expected proceeds of USD 1.5 billion, while remaining a significant shareholder in the company Liquidity €1.2bn Operational Improvement Plan/ EBITDA organic improvement Deleveraging transactions ~70% ~30% of the deleveraging path of the deleveraging path

GRAPHIC

Q2 2023 Results - 20 - Raising H2’23 and Full Year 2023 Guidance Guidance Revenue (at cc) EBITDA Total revenue growth (incl. Biotest) EBITDA Adjusted Margin (excl. Biotest) EBITDA Adjusted (incl. Biotest) Biopharma revenue growth (incl. Biotest) 23-25% 22-24% EUR 1.4bn+ 10-12% 12-14% 24-25% 24% EUR 1,400-1,450m 8-10% 10-12% Previous New H2’23 FY23 FY23 FY23 FY23 Proforma EBITDA annualizing savings (excl. Biotest) EUR 1.7bn+ FY23 EUR 1,700-1,750m 27-28% 28-29% Previous New

GRAPHIC

Q2 2023 Results - 21 - Table of Contents 1. Our Turnaround Strategy 4. Final Remarks 5. Annex 2. Performance by Business Unit 3. Group Financial Performance

GRAPHIC

• Deliver strong sales growth driven by solid demand on key proteins, product and country mix • Accelerate financial improvement backed by the Operational Improvement Plan • Maintain strong growth on plasma supply; cost per liter (CPL) continues to decline • Excel commercial and innovation execution strengthening IG franchise and alpha-1 • Focus on reducing leverage to 4x by end of 2024 Final Remarks Executing on Key Levers in H2’23 to Meet Guidance 22.2% H1 2023 24-25% H2 2023 Exceeding 21%+ guidance 20.7% H1 2022 20.4% H2 2022 Adj. EBITDA guidance (excl. Biotest) Focused on accelerating the execution of the company’s strategy; operational excellence; cash flow improvement and debt reduction Key levers

GRAPHIC

Q2 2023 Results - 23 - Table of Contents 1. Our Turnaround Strategy 2. Performance by Business Unit 3. Group Financial Performance 4. Final Remarks 5. Annex 5.1. Sustainability 5.2. Financials

GRAPHIC

Sustainability | Our Sustainability Plan Ambition Setting our Sustainability Roadmap and Commitment with SDGs Placing human rights at the core of our practices by integrating the highest ethical standards throughout the supply chain Healthier and wealthier society by advancing social progress, supporting organizations and actively engaging with local communities Ongoing efforts to drive diversity, continuous development, equal opportunities, gender equality and overall employee well-being across our global talent pool Solid community where all donors understand their impact and feel valued for their commitment beyond compensation, and where all patients receive the treatment, they need Promoting the common good by fostering healthy environments where people can live, work and play, and by raising awareness on the need to protect the planet Scientific progress that, guided by our pioneering spirit, addresses the needs of patients and protects the rights, safety and well-being of clinical-trial participants Our people Commitment to donors and patients Environment responsibility Impact on society Ethical Commitment Innovation

GRAPHIC

Q2 2023 Results - 25 - Sustainability | Progress in H1 2023 Donors, Patients and Our People Are at the Core of Our Sustainability * As of June 27, 2023 ~60% women Gender equality 23,600+ people 90+ nationalities Mental Health Policy Designed to prevent, protect and promote employee mental health and well-being, as well as support workers dealing with mental health issues 2023-2025 Action Plan 137+ average training hours per employee Diversity & inclusion 940,000+ donors 800,000+ patients treated 80+ patient organizations supported Awareness and educational campaigns on inclusion of minorities and people with disabilities 4 strategic lines of action: Education & empowerment Awareness & visibility Patient experience Advocacy & access Our donors: a cross-section of society 41% women 59% men 35 years old average age Improving patients’ lives Our people Environment responsibility Impact on society Ethical Commitment Innovation Commitment to donors and patients 390+ plasma centers

GRAPHIC

Q2 2023 Results - 26 - Sustainability | Progress in H1 2023 Making Steady Progress on Positive Impact on Environment and Society 2023-2026 Environmental Plan Outlines the objectives for this four-year period, with concrete targets assigned to Grifols’ global facilities Main objectives: Emissions Energy efficiency We contribute through our foundations Bioethics as a principle 15 activities 1,300 participants 3 publications Improving the health of vulnerable people 5 programs International and local programs on neglected tropical diseases 46,000+ beneficiaries on mental health of youth and adolescents Supporting donors’ communities Plasma Donor Emergency Relief Program 29 * applications approved $590 average grant International Local * As of June 27, 2023 60 total activities 60,000+ tCO2e per year Reduction of emissions (Scope 1+2) €26M+ Total investment 8,000M+ kWh Reduction of energy consumption 170M kWh/year New PPA Agreement in Spain and the U.S. Climate Action Policy Establishes a framework to articulate Grifols’ strategy and business model regarding our commitment to fight climate change We support earthquake victims in Syria and Turkey €50k+ total donations Our people Environment responsibility Impact on society Ethical Commitment Innovation Commitment to donors and patients 1 program

GRAPHIC

Q2 2023 Results - 27 - Sustainability | Progress in H1 2023 Ethical Leadership is in Our DNA Grifols has been awarded a Gold Medal by EcoVadis ESG Ratings Integration of ESG factors into purchasing decisions Supplier selection and onboarding qualification includes on ESG performance Supply Chain: Mitigating Supplier Key Risks and Impacts Incentive plans including ESG criteria New short-term incentive plan for the entire workforce New long-term incentive plan Global Procurement Policy Our people Environment responsibility Impact on society Ethical Commitment Innovation Commitment to donors and patients

GRAPHIC

Q2 2023 Results - 28 - Table of Contents 1. Our Turnaround Strategy 2. Performance by Business Unit 3. Group Financial Performance 4. Final Remarks 5. Annex 5.1. Sustainability 5.2. Financials

GRAPHIC

Q2 2023 Results - 29 - Revenue | Q2 2023 Annex In thousands of euros Reported At cc* Reported At cc* Revenue by Business Unit 1,523,577 139,881 1,663,458 1,444,613 98,287 1,542,900 5.5% 6.5% 7.8% 8.8% Biopharma 1,267,643 139,881 1,407,524 1,192,095 98,287 1,290,382 6.3% 7.3% 9.1% 10.0% Diagnostic 165,013 - 165,013 159,687 - 159,687 3.3% 5.1% 3.3% 5.1% Bio Supplies 40,349 - 40,349 28,806 - 28,806 40.1% 41.1% 40.1% 41.1% Others & intersegments 50,572 - 50,572 64,025 - 64,025 (21.0%) (20.6%) (21.0%) (20.6%) Revenue by Country 1,523,577 139,881 1,663,458 1,444,613 98,287 1,542,900 5.5% 6.5% 7.8% 8.8% US + CANADA 979,313 - 979,313 967,557 1,165 968,722 1.2% 2.0% 1.1% 1.8% E U 248,529 73,342 321,871 214,521 50,334 264,855 15.9% 15.8% 21.5% 21.5% ROW 295,735 66,539 362,274 262,535 46,788 309,323 12.6% 15.6% 17.1% 19.8% * Constant currency (cc) excludes exchange rate fluctuations over the period. Note: Bio Supplies figures for Q2 2022 differ from Note 5 of the June 2023 Interim Financial Statements as the Directors' Reports discloses management information Grifols incl. Biotest Q2 2023 % vs PY Grifols Biotest Grifols incl. Biotest Q2 2022 Grifols Biotest Grifols excl. Biotest Grifols incl. Biotest

GRAPHIC

Q2 2023 Results - 30 - Revenue | H1 2023 Annex In thousands of euros Reported At cc* Reported At cc* Revenue by Business Unit 2,967,827 257,119 3,224,946 2,711,805 98,287 2,810,092 9.4% 7.7% 14.8% 13.1% Biopharma 2,441,096 257,119 2,698,215 2,214,603 98,287 2,312,890 10.2% 8.4% 16.7% 14.9% Diagnostic 341,488 - 341,488 329,436 - 329,436 3.7% 3.0% 3.7% 3.0% Bio Supplies 82,615 - 82,615 52,553 - 52,553 57.2% 53.9% 57.2% 53.9% Others & intersegments 102,628 - 102,628 115,213 - 115,213 (10.9%) (11.7%) (10.9%) (11.7%) Revenue by Country 2,967,827 257,119 3,224,946 2,711,805 98,287 2,810,092 9.4% 7.7% 14.8% 13.1% US + CANADA 1,921,960 904 1,922,864 1,815,818 1,165 1,816,983 5.8% 3.4% 5.8% 3.4% E U 489,123 138,408 627,531 423,289 50,334 473,623 15.6% 15.4% 32.5% 32.4% ROW 556,744 117,807 674,551 472,698 46,788 519,486 17.8% 17.6% 29.8% 29.8% * Constant currency (cc) excludes exchange rate fluctuations over the period. H1 2022 % vs PY Grifols incl. Biotest Grifols excl. Biotest Grifols incl. Biotest Grifols Biotest Grifols incl. Biotest Grifols Biotest H1 2023

GRAPHIC

Q2 2023 Results - 31 - P&L | Q2 2023 Annex In thousands of euros Reported One-offs Reported excl. One-offs Reported One-offs Reported excl. One-offs Grifols Biotest Combined Reported Reported excl. One-offs Reported Reported excl. One-offs Net Revenue 1,523,577 - 1,523,577 139,881 1,663,458 - 1,663,458 1,444,613 98,287 1,542,899 5.5% 5.5% 7.8% 7.8% Cost of Sales (936,596) 1,597 (934,998) (108,395) (1,044,991) 1,597 (1,043,394) (890,293) (74,656) (964,949) 5.2% 5.0% 8.3% 8.1% Gross Margin 586,981 1,597 588,579 31,486 618,467 1,597 620,064 554,320 23,631 577,950 5.9% 6.2% 7.0% 7.3% % Net revenue 38.5% 38.6% 22.5% 37.2% 37.3% 38.4% 24.0% 37.5% R&D (72,479) 1,271 (71,208) (16,114) (88,593) 1,271 (87,322) (75,372) (9,755) (85,127) (3.8%) (5.5%) 4.1% 2.6% SG&A (276,281) 7,381 (268,900) (23,219) (299,500) 7,381 (292,119) (293,916) (14,557) (308,473) (6.0%) (8.5%) (2.9%) (5.3%) Operating Expenses (348,760) 8,652 (340,108) (39,333) (388,093) 8,652 (379,441) (369,288) (24,312) (393,600) (5.6%) (7.9%) (1.4%) (3.6%) Other Income - - - - - - - 925 - 925 - - (100%) 0.0% 13,022 - 13,022 - 13,022 - 13,022 80,096 - 80,096 (83.7%) (83.7%) (83.7%) (83.7%) OPERATING RESULT (EBIT) 251,243 10,250 261,493 (7,847) 243,396 10,250 253,646 266,054 (682) 265,371 (5.6%) (1.7%) (8.3%) (4.4%) % Net revenue 16.5% - 17.2% (5.6%) 14.6% - 15.2% 18.4% (0.7%) 17.2% Financial Result (128,267) - (128,267) (11,109) (139,376) - (139,376) (116,099) (3,281) (119,380) 10.5% 10.5% 16.8% 16.8% (801) - (801) - (801) - (801) (271) - (271) 195.8% 195.8% 195.8% 195.8% PROFIT BEFORE TAX 122,175 10,250 132,425 (18,956) 103,219 10,250 113,469 149,684 (3,961) 145,722 (18.4%) (11.5%) (29.2%) (22.1%) % Net revenue 8.0% - 8.7% (13.6%) 6.2% - 6.8% 10.4% (4.0%) 9.4% Income Tax Expense (19,212) (2,521) (21,733) 5,864 (13,348) (2,521) (15,869) (29,558) (1,246) (30,804) (35.0%) (26.5%) (56.7%) (48.5%) % of pre-tax income 15.7% - 16.4% 30.9% 12.9% - 14.0% 19.7% (31.5%) 21.1% CONSOLIDATED PROFIT 102,963 7,729 110,692 (13,092) 89,871 7,729 97,600 120,126 (5,207) 114,918 (14.3%) (7.9%) (21.8%) (15.1%) Results Attributable to Non-Controlling Interests (33,392) 262 (33,130) (4,434) (37,826) 262 (37,564) (25,907) 1,328 (24,578) 28.9% 27.9% 53.9% 52.8% GROUP PROFIT 69,571 7,991 77,562 (17,527) 52,044 7,991 60,035 94,219 (3,879) 90,339 (26.2%) (17.7%) (42.4%) (33.5%) % Net revenue 4.6% 5.1% (12.5%) 3.1% 0.0% 3.6% 6.5% (3.9%) 5.9% Share of Results of Equity Accounted Investees Share of Results of Equity Accounted Investees - Core Activities Grifols excl. Biotest Grifols excl. Biotest Grifols incl. Biotest % vs PY Grifols incl. Biotest Q2 2023 Biotest Grifols incl. Biotest Q2 2022

GRAPHIC

Q2 2023 Results - 32 - P&L | H1 2023 Annex In thousands of euros Reported One-offs Reported excl. One-offs Reported One-offs Reported excl. One-offs Grifols Biotest Combined Reported Reported excl. One-offs Reported Reported excl. One-offs Net Revenue 2,967,827 (18,830) 2,948,997 257,119 3,224,946 (18,830) 3,206,116 2,711,805 98,287 2,810,092 9.4% 8.7% 14.8% 14.1% Cost of Sales (1,851,156) 26,999 (1,824,157) (200,883) (2,052,039) 26,999 (2,025,040) (1,662,885) (74,656) (1,737,541) 11.3% 9.7% 18.1% 16.5% Gross Margin 1,116,671 8,169 1,124,840 56,236 1,172,907 8,169 1,181,076 1,048,920 23,631 1,072,551 6.5% 7.2% 9.4% 10.1% % Net revenue 37.6% - 38.1% 21.9% 36.4% - 36.8% 38.7% 24.0% 38.2% R&D (151,378) 5,041 (146,337) (41,871) (193,249) 5,041 (188,208) (151,527) (9,755) (161,282) (0.1%) (3.4%) 19.8% 16.7% SG&A (666,229) 122,150 (544,079) (46,931) (713,160) 122,150 (591,010) (553,333) (14,557) (567,890) 20.4% (1.7%) 25.6% 4.1% Operating Expenses (817,607) 127,191 (690,415) (88,802) (906,409) 127,191 (779,218) (704,860) (24,312) (729,172) 16.0% (2.0%) 24.3% 6.9% Other Income - - - - - - - 4,508 - 4,508 - - (100%) (100.0%) 27,528 - 27,528 - 27,528 - 27,528 79,459 - 79,459 (65.4%) (65.4%) (65.4%) (65.4%) OPERATING RESULT (EBIT) 326,592 135,361 461,953 (32,566) 294,026 135,361 429,387 428,027 (681) 427,346 (23.7%) 7.9% (31.2%) 0.5% % Net revenue 11.0% - 15.7% (12.7%) 9.1% - 13.4% 15.8% (0.7%) 15.2% Financial Result (251,992) - (251,992) (22,126) (274,118) - (274,118) (195,472) (3,281) (198,753) 28.9% 28.9% 37.9% 37.9% (862) - (862) - (862) - (862) (706) - (706) 22.1% 22.1% 22.1% 22.1% PROFIT BEFORE TAX 73,737 135,361 209,098 (54,691) 19,046 135,361 154,407 231,849 (3,962) 227,887 (68.2%) (9.8%) (91.6%) (32.2%) % Net revenue 2.5% - 7.1% (21.3%) 0.6% - 4.8% 8.5% - 8.1% Income Tax Expense (18,434) (33,866) (52,300) 8,315 (10,119) (33,866) (43,985) (50,029) (1,246) (51,275) (63.2%) 4.5% (80.3%) (14.2%) % of pre-tax income 25.0% - 25.0% 15.2% 53.1% - 28.5% 21.6% 0.5% 22.5% CONSOLIDATED PROFIT 55,303 101,495 156,798 (46,376) 8,927 101,495 110,422 181,820 (5,208) 176,612 (69.6%) (13.8%) (94.9%) (37.5%) Results Attributable to Non-Controlling Interests (66,801) 4,164 (62,637) 1,653 (65,148) 4,164 (60,983) (34,292) 1,328 (32,963) 94.8% 82.7% 97.6% 85.0% GROUP PROFIT (11,498) 105,660 94,162 (44,723) (56,221) 105,660 49,439 147,529 (3,880) 143,649 (107.8%) (36.2%) (139.1%) (65.6%) % Net revenue (0.4%) - 3.2% (17.4%) (1.7%) - 1.5% 5.4% - 5.1% Share of Results of Equity Accounted Investees - Core Activities Share of Results of Equity Accounted Investees Grifols incl. Biotest H1 2023 H1 2022 % vs PY Grifols excl. Biotest Biotest Grifols incl. Biotest Grifols excl. Biotest Grifols incl. Biotest

GRAPHIC

Q2 2023 Results - 33 - Cash Flow | Q2 2023 Annex Q2 2022 Grifols incl. Biotest In thousands of euros Reported Restructuring costs Transaction costs Diagnostic true-up commercial Total one-offs Reported excl. One-offs Reported Total one-offs Reported excl. One-offs Reported Reported Reported excl. One-offs Reported Group Profit 69,571 429 7,562 - 7,991 77,562 (17,527) 52,044 7,991 60,036 90,339 -42% -34% Depreciation and Amortization 93,971 - - - - 93,971 12,645 106,615 - 106,615 98,842 8% 8% Net Provisions 8,592 4,867 - - 4,867 13,459 (3,166) 5,425 4,867 10,292 1,975 175% 421% Other Adjustments and Other Changes in Working Capital (73,015) (262) 2,520 - 2,258 (70,757) (55) (73,070) 2,258 (70,812) (63,075) 16% 12% Change in Operating Working Capital (107,796) 3,946 - - 3,946 (103,850) (25,491) (133,287) 3,946 (129,341) (131,505) 1% -2% Changes in Inventories (28,138) - - - - (28,138) (26,837) (54,976) - (54,976) (109,342) -50% -50% Change in Trade Receivables (1,830) - - - - (1,830) (21,800) (23,630) - (23,630) (80,445) -71% -71% Change in Trade Payables (77,827) 3,946 - - 3,946 (73,881) 23,146 (54,681) 3,946 (50,735) 58,282 - - Net Cash Flow From Operating Activities (8,677) 8,980 10,083 - 19,062 10,386 (33,595) (42,272) 19,062 (23,210) (3,424) - - Business Combinations and Investments in Group Companies - - - - - - - - - - (1,500,825) - - CAPEX (34,375) - - - - (34,375) (8,295) (42,670) - (42,670) (71,709) -40% -40% R&D/Other Intangible Assets (16,166) - - - - (16,166) (3,712) (19,878) - (19,878) (9,760) 104% 104% Other Cash Inflow / (Outflow) (34,455) - - - - (34,455) 47,169 12,714 - 12,714 (33,515) -138% -138% Net Cash Flow From Investing Activities (84,996) - - - - (84,996) 35,162 (49,834) - (49,834) (1,615,809) -97% -97% Free Cash Flow (93,673) 8,980 10,083 - 19,062 (74,611) 1,567 (92,106) 19,062 (73,044) (1,619,233) -94% -95% Issue / /Repayment) of Debt 194,918 - - - - 194,918 (1,328) 193,591 - 193,591 (5,867) - - Capital Grants 42 - - - - 42 - 42 - 42 (447,431) - - Dividends (Paid) / Received - - - - - - - - - - 1,764 - - Other Cash Flows From / (Used in) Financing Activities (3,826) - - - - (3,826) 133 (3,692) - (3,692) 10,616 -135% -135% Net Cash Flow From Financing Activities 191,134 - - - - 191,134 (1,195) 189,940 - 189,940 (440,918) - - Total Cash Flow 97,460 8,980 10,083 - 19,062 116,523 372 97,834 19,062 116,896 (2,060,151) -105% -106% Cash and Cash Equivalents at the Beginning of the Year 0 - - - - 0 (0) - - - - - - Effect of Exchange Rate Changes in Cash and Cash Equivalents (111) - - - - (111) (24) (137) - (137) 32,888 -100% -100% Cash and Cash Equivalents at the End of the Period 97,350 8,980 10,083 - 19,062 116,413 347 97,697 19,062 116,759 (2,027,263) -105% -106% Q2 2023 % vs PY Grifols excl. Biotest Biotest Grifols incl. Biotest Grifols incl. Biotest

GRAPHIC

Q2 2023 Results - 34
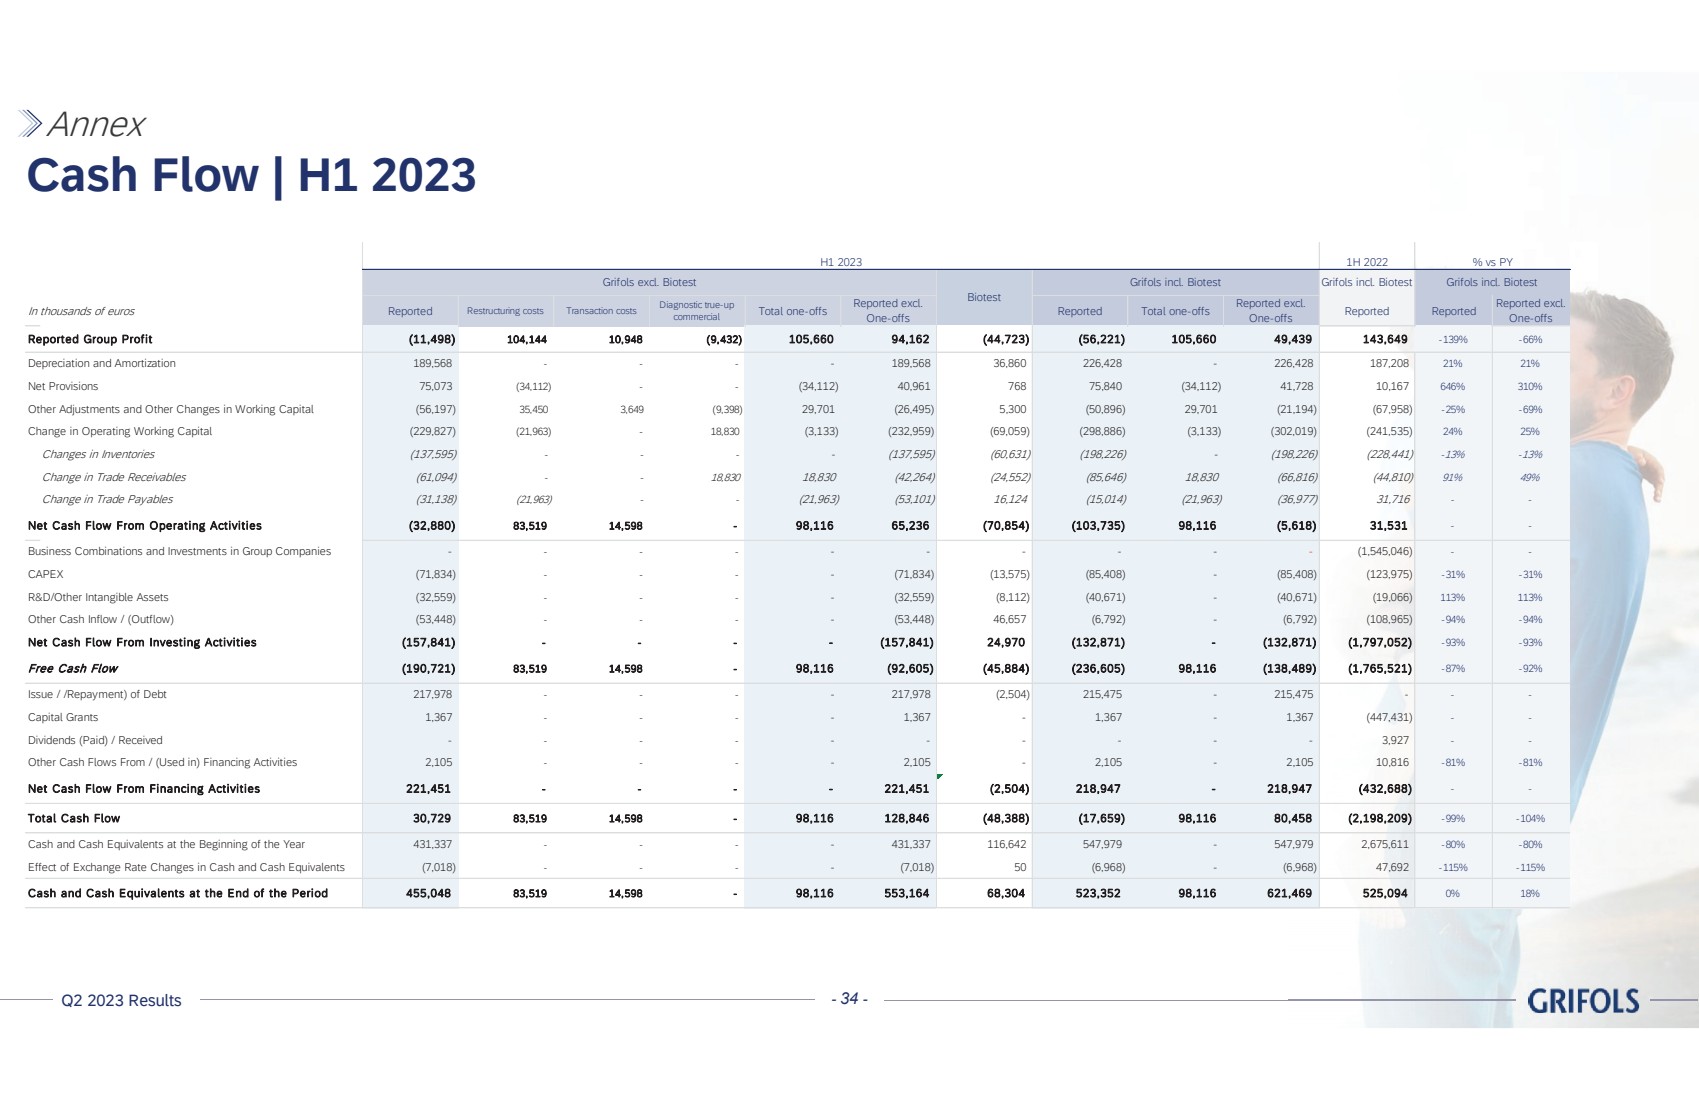
 - Cash Flow | H1 2023 Annex 1H 2022 Grifols incl. Biotest In thousands of euros Reported Restructuring costs Transaction costs Diagnostic true-up commercial Total one-offs Reported excl. One-offs Reported Total one-offs Reported excl. One-offs Reported Reported Reported excl. One-offs Reported Group Profit (11,498) 104,144 10,948 (9,432) 105,660 94,162 (44,723) (56,221) 105,660 49,439 143,649 -139% -66% Depreciation and Amortization 189,568 - - - - 189,568 36,860 226,428 - 226,428 187,208 21% 21% Net Provisions 75,073 (34,112) - - (34,112) 40,961 768 75,840 (34,112) 41,728 10,167 646% 310% Other Adjustments and Other Changes in Working Capital (56,197) 35,450 3,649 (9,398) 29,701 (26,495) 5,300 (50,896) 29,701 (21,194) (67,958) -25% -69% Change in Operating Working Capital (229,827) (21,963) - 18,830 (3,133) (232,959) (69,059) (298,886) (3,133) (302,019) (241,535) 24% 25% Changes in Inventories (137,595) - - - - (137,595) (60,631) (198,226) - (198,226) (228,441) -13% -13% Change in Trade Receivables (61,094) - - 18,830 18,830 (42,264) (24,552) (85,646) 18,830 (66,816) (44,810) 91% 49% Change in Trade Payables (31,138) (21,963) - - (21,963) (53,101) 16,124 (15,014) (21,963) (36,977) 31,716 - - Net Cash Flow From Operating Activities (32,880) 83,519 14,598 - 98,116 65,236 (70,854) (103,735) 98,116 (5,618) 31,531 - - Business Combinations and Investments in Group Companies - - - - - - - - - - (1,545,046) - - CAPEX (71,834) - - - - (71,834) (13,575) (85,408) - (85,408) (123,975) -31% -31% R&D/Other Intangible Assets (32,559) - - - - (32,559) (8,112) (40,671) - (40,671) (19,066) 113% 113% Other Cash Inflow / (Outflow) (53,448) - - - - (53,448) 46,657 (6,792) - (6,792) (108,965) -94% -94% Net Cash Flow From Investing Activities (157,841) - - - - (157,841) 24,970 (132,871) - (132,871) (1,797,052) -93% -93% Free Cash Flow (190,721) 83,519 14,598 - 98,116 (92,605) (45,884) (236,605) 98,116 (138,489) (1,765,521) -87% -92% Issue / /Repayment) of Debt 217,978 - - - - 217,978 (2,504) 215,475 - 215,475 - - - Capital Grants 1,367 - - - - 1,367 - 1,367 - 1,367 (447,431) - - Dividends (Paid) / Received - - - - - - - - - - 3,927 - - Other Cash Flows From / (Used in) Financing Activities 2,105 - - - - 2,105 - 2,105 - 2,105 10,816 -81% -81% Net Cash Flow From Financing Activities 221,451 - - - - 221,451 (2,504) 218,947 - 218,947 (432,688) - - Total Cash Flow 30,729 83,519 14,598 - 98,116 128,846 (48,388) (17,659) 98,116 80,458 (2,198,209) -99% -104% Cash and Cash Equivalents at the Beginning of the Year 431,337 - - - - 431,337 116,642 547,979 - 547,979 2,675,611 -80% -80% Effect of Exchange Rate Changes in Cash and Cash Equivalents (7,018) - - - - (7,018) 50 (6,968) - (6,968) 47,692 -115% -115% Cash and Cash Equivalents at the End of the Period 455,048 83,519 14,598 - 98,116 553,164 68,304 523,352 98,116 621,469 525,094 0% 18% H1 2023 Grifols excl. Biotest Biotest Grifols incl. Biotest % vs PY Grifols incl. Biotest

GRAPHIC

Q2 2023 Results - 35 - Balance Sheet | H1 2023 Annex In thousands of euros June 2023 December 2022 16,627,972 16,880,390 10,646,776 10,858,608 3,225,684 3,270,937 1,905,591 1,955,177 630,453 620,745 219,468 174,923 4,804,772 4,653,587 - 4,969 3,317,448 3,201,357 44,146 35,154 821,562 738,651 33,883 43,663 64,381 81,814 523,352 547,979 21,432,744 21,533,977 Cash and Cash Equivalents Goodwill and Other Intangible Assets Property Plant & Equipment Assets Non-Current Assets Total Assets Current Assets Inventories Current Contract Assets Other Current Financial Assets Non-Current Contract Assets Held for Sale Trade and Other Receivables Investments in Equity Accounted Investees Non-Current Financial Assets Other Non-Current Assets Other Current Assets June 2023 December 2022 8,223,565 8,457,544 119,604 119,604 910,728 910,728 4,529,237 4,326,436 Treasury StocL (158,692) (162,220) (56,221) 208,279 517,162 727,111 2,361,747 2,327,606 11,332,195 11,120,586 10,202,587 9,960,562 1,129,608 1,160,024 1,876,984 1,955,847 733,269 795,686 1,143,715 1,160,161 21,432,744 21,533,977 Other Current Liabilities Total Equity and Liabilities Other Comprehensive Income Non-Controllling Interests No-Current Liabilities Non-Current Financial Liabilities Other Non-Current Liabilities Share Premium Reserves Current Year Earnings Current Liabilities Current Financial Liabilities Capital Equity Liabilities

GRAPHIC

Q2 2023 Results - 36 - EBIT to Adjusted EBITDA LTM Excl. Biotest | Q2 2023 Annex In thousand of euros 251,243 75,348 173,747 211,271 711,609 266,054 (94,936) (98,296) (102,226) (98,047) (393,505) (93,950) Reported EBITDA 346,180 173,644 275,973 309,318 1,105,115 360,004 % Net revenue 22.7% 12.0% 17.7% 21.6% 18.9% 24.9% Restructuring costs - 139,427 26,231 5,655 171,313 2,268 Transaction costs 9,735 4,515 696 505 15,451 15,310 Diagnostic commercial true-up - (18,830) - - (18,830) - Access Biologicals gain - - - - - (72,984) Divestment gain - - - (14,678) (14,678) - Impairments - - 2,700 - 2,700 - Other non-recurring items - - 10,487 - 10,487 - Total adjustments 9,735 125,112 40,114 (8,518) 166,443 (55,406) Adjusted EBITDA 355,915 298,756 316,087 300,800 1,271,558 304,598 % Net revenue 23.4% 21.0% 20.3% 21.0% 21.8% 21.1% Depreciation & Amortization Q2 2023 Q2 2022 OPERATING RESULT (EBIT) Q1 2023 Q4 2022 Q3 2022 Q2 2023 LTM

GRAPHIC

Q2 2023 Results - 37 - EBIT to Adjusted EBITDA LTM Incl. Biotest | Q2 2023 Annex In thousand of euros 243,396 50,629 176,947 201,387 672,359 265,372 (107,581) (122,511) (117,406) (106,973) (454,472) (100,380) Reported EBITDA 350,977 173,140 294,353 308,360 1,126,831 365,752 % Net revenue 21.1% 11.1% 17.2% 20.0% 17.4% 23.7% Restructuring costs - 139,427 26,231 5,655 171,313 2,268 Transaction costs 9,735 4,515 696 505 15,451 15,310 Diagnostic commercial true-up - (18,830) - - (18,830) - Access Biologicals gain - - - - - (72,984) Divestment gain - - - (14,678) (14,678) - Impairments - - 2,700 - 2,700 - Biotest Next Level project - - 13,482 22,341 35,823 14,194 Other non-recurring items - - 10,487 - 10,487 - Total adjustments 9,735 125,112 53,596 13,823 202,266 (41,212) Adjusted EBITDA 360,712 298,252 347,949 322,183 1,329,097 324,540 % Net revenue 21.7% 19.3% 20.3% 20.9% 20.6% 21.0% Q2 2023 Q2 2023 Q1 2023 Q4 2022 Q3 2022 LTM Q2 2022 Depreciation & Amortization OPERATING RESULT (EBIT)

GRAPHIC

Q2 2023 Results - 38 - Reconciliation Group Profit Reported to Adjusted | Q2 2023 Annex In thousand of euros Excl. Biotest Incl. Biotest Restructuring costs Transaction costs Diagnostic commercial true-up Amortization of deferred financial expenses Amortization of intangible assets acquired in business combinations IFRS 16 Excl. Biotest Incl. Biotest 1,523,577 1,663,458 - - - - - - 1,523,577 1,663,458 (936,596) (1,044,991) 1,597 - - - - (1,525) (936,524) (1,044,919) 586,981 618,467 1,597 - - - - (1,525) 587,053 618,539 (72,479) (88,593) 1,272 - - - 3,455 (96) (67,849) (83,962) (276,281) (299,500) (2,702) 10,083 - - 12,020 (1,372) (258,252) (281,471) (348,760) (388,093) (1,431) 10,083 - - 15,475 (1,468) (326,101) (365,434) - - - - - - - - - - 13,022 13,022 - - - - - - 13,022 13,022 251,243 243,396 167 10,083 - - 15,475 (2,993) 273,975 266,128 (128,267) (139,376) - - - 14,326 - 10,680 (103,261) (114,370) (801) (801) - - - - - - (801) (801) 122,175 103,219 167 10,083 - 14,326 15,475 7,687 169,913 150,957 (19,212) (13,348) - (2,520) - (3,127) (3,817) (1,921) (30,598) (24,735) 102,963 89,871 167 7,562 - 11,199 11,658 5,765 139,315 126,222 (33,392) (37,826) 262 - - - - - (33,130) (37,564) GROUP PROFIT 69,571 52,044 429 7,562 - 11,199 11,658 5,765 106,185 88,659 Financial Result Share of Results of Equity Accounted Investees PROFIT BEFORE TAX Income Tax Expense CONSOLIDATED PROFIT Results Attributable to Non-Controlling Interests OPERATING RESULT (EBIT) Reported Adjustments Adjusted Net Revenue Cost of Sales Gross Margin R&D SG&A Operating Expenses Other Income Share of Results of Equity Accounted Investees - Core Activities

GRAPHIC

Q2 2023 Results - 39 - Reconciliation Group Profit Reported to Adjusted | Q2 2022 Annex In thousand of euros Excl. Biotest Incl. Biotest Restructuring costs Transaction costs Divestment gain Amortization of deferred financial expenses Amortization of intangible assets acquired in business combinations IFRS 16 Excl. Biotest Incl. Biotest 1,444,613 1,542,899 - - - - - - 1,444,613 1,542,899 (890,293) (964,949) 484 - - - 861 (3,421) (892,369) (967,025) 554,320 577,950 484 - - - 861 (3,421) 552,244 575,873 (75,372) (85,127) 813 - - - 811 (731) (74,478) (84,234) (293,916) (308,473) 971 18,075 - - 10,087 (362) (265,144) (279,701) (369,288) (393,600) 1,785 18,075 - - 10,898 (1,092) (339,622) (363,935) 925 925 - - (4,508) - - - (3,583) (3,583) 80,096 80,096 - (72,984) - - - - 7,112 7,112 266,054 265,371 2,269 (54,909) (4,508) - 11,759 (4,514) 216,151 215,469 (116,099) (119,380) - - - 16,306 - 11,118 (88,675) (91,956) (271) (271) - - - - - - (271) (271) 149,684 145,722 2,269 (54,909) (4,508) 16,306 11,759 6,605 127,205 123,243 (29,558) (30,804) (567) (4,405) (0) (3,223) (2,472) (1,319) (41,545) (42,791) 120,126 114,918 1,701 (59,314) (4,508) 13,082 9,287 5,286 85,660 80,452 (25,907) (24,578) - - - - (781) - (26,688) (25,359) GROUP PROFIT 94,219 90,339 1,701 (59,314) (4,508) 13,082 8,506 5,286 58,973 55,093 Results Attributable to Non-Controlling Interests R&D SG&A Operating Expenses Other Income Share of Results of Equity Accounted Investees - Core Activities OPERATING RESULT (EBIT) Financial Result Share of Results of Equity Accounted Investees PROFIT BEFORE TAX Income Tax Expense CONSOLIDATED PROFIT Reported Adjustments Adjusted Net Revenue Cost of Sales Gross Margin

GRAPHIC

Q2 2023 Results - 40 - Reconciliation Group Profit Reported to Adjusted | H1 2023 Annex In thousand of euros Excl. Biotest Incl. Biotest Restructuring costs Transaction costs Diagnostic commercial true-up Amortization of deferred financial expenses Amortization of intangible assets acquired in business combinations IFRS 16 Excl. Biotest Incl. Biotest 2,967,827 3,224,946 - - (18,830) - - - 2,948,997 3,206,116 (1,851,156) (2,052,039) 26,999 - - - - (5,189) (1,829,346) (2,030,229) 1,116,671 1,172,907 26,999 - (18,830) - - (5,189) 1,119,651 1,175,887 (151,378) (193,249) 5,042 - - 18,987 (386) (127,736) (169,607) (666,229) (713,160) 107,553 14,598 - - 26,446 (2,744) (520,376) (567,307) (817,607) (906,409) 112,594 14,598 - - 45,433 (3,130) (648,112) (736,914) - - - - - - - - - - 27,528 27,528 - - - - - - 27,528 27,528 326,592 294,026 139,594 14,598 (18,830) - 45,433 (8,319) 499,067 466,502 (251,992) (274,118) - - - 28,226 - 21,377 (202,389) (224,515) (862) (862) - - - - - - (862) (862) 73,737 19,046 139,594 14,598 (18,830) 28,226 45,433 13,058 295,816 241,124 (18,434) (10,119) (34,924) (3,649) 4,708 (6,179) (11,577) (3,264) (73,321) (65,006) 55,303 8,927 104,670 10,948 (14,123) 22,047 33,856 9,793 222,495 176,119 (66,801) (65,148) (526) - 4,690 - (790) - (63,426) (61,773) GROUP PROFIT (11,498) (56,221) 104,144 10,948 (9,432) 22,047 33,066 9,793 159,068 114,346 Reported Adjustments Adjusted CONSOLIDATED PROFIT Results Attributable to Non-Controlling Interests Share of Results of Equity Accounted Investees - Core Activities Net Revenue Cost of Sales Gross Margin R&D SG&A Operating Expenses Other Income OPERATING RESULT (EBIT) Financial Result Share of Results of Equity Accounted Investees PROFIT BEFORE TAX Income Tax Expense

GRAPHIC

Q2 2023 Results - 41 - Reconciliation Group Profit Reported to Adjusted | H1 2022 Annex In thousand of euros Excl. Biotest Incl. Biotest Restructuring costs Transaction costs Divestment gain Amortization of deferred financial expenses Amortization of intangible assets acquired in business combinations IFRS 16 Excl. Biotest Incl. Biotest 2,711,805 2,810,092 - - - - - - 2,711,805 2,810,092 (1,662,885) (1,737,541) 494 - - - 1,683 (6,693) (1,667,401) (1,742,057) 1,048,920 1,072,551 494 - - - 1,683 (6,693) 1,044,404 1,068,035 (151,527) (161,282) 1,994 - - - 1,619 (1,017) (148,930) (158,685) (553,333) (567,890) 1,700 19,396 - - 20,837 (688) (512,087) (526,644) (704,860) (729,172) 3,695 19,396 - - 22,456 (1,704) (661,018) (685,329) 4,508 4,508 - - (8,091) - - - (3,583) (3,583) 79,459 79,459 - (72,984) - - - - 6,475 6,475 428,027 427,346 4,189 (53,588) (8,091) - 24,139 (8,398) 386,279 385,597 (195,472) (198,753) - - - 29,098 - 21,673 (144,702) (147,982) (706) (706) - - - - - - (706) (706) 231,849 227,887 4,189 (53,588) (8,091) 29,098 24,139 13,276 240,871 236,909 (50,029) (51,275) (1,047) (4,735) 896 (6,446) (5,388) (2,987) (69,737) (70,983) 181,820 176,612 3,141 (58,323) (7,195) 22,651 18,751 10,289 171,135 165,927 (34,292) (32,963) - - - - (1,528) - (35,820) (34,491) GROUP PROFIT 147,529 143,649 3,141 (58,323) (7,195) 22,651 17,223 10,289 135,315 131,436 Other Income Share of Results of Equity Accounted Investees - Core Activities OPERATING RESULT (EBIT) Financial Result PROFIT BEFORE TAX Income Tax Expense CONSOLIDATED PROFIT Results Attributable to Non-Controlling Interests Share of Results of Equity Accounted Investees Reported Adjustments Adjusted Net Revenue Cost of Sales Gross Margin R&D SG&A Operating Expenses

GRAPHIC

Q2 2023 Results - 42 - Leverage Ratio and Adj. EBITDA LTM as per Credit Agreement | H1 2023 Annex In millions of euros except ratio H1 2023 FY 2022 % Var Net Financial Debt* 9,422 9,191 2.5% Adjusted EBITDA LTM as per Credit Agreement 1,361 1,287 5.7% Leverage Ratio as per Credit Agreeement 6.92x 7.14x *Excludes the impact of IFRS 16 In million of euros H1 2023 LTM FY 2022 % Var OPERATING RESULT (EBIT) 672 806 (16.6%) Depreciation & Amortization (454) (415) 9.5% Reported EBITDA 1,127 1,221 (7.7%) IFRS 16 (101) (100) 1.4% Transaction costs 19 26 (26.4%) Restructuring costs 171 36 374.5% Cost savings, operating improvements and synergies on a "run rate" 121 100 21.0% Other one-offs 24 4 595.5% Total adjustments 234 6 6 253.4% Adjusted EBITDA LTM as per Credit Agreement 1,361 1,287 5.7%

GRAPHIC

Q2 2023 Results - 43 - Net Revenue Reconciliation Constant Currency Excl. Biotest | Q2 2023 Annex In thousands of euros Q2 2023 Q2 2022 % Var Reported Net Revenues 1,523,577 1,444,613 5.5% Variation due to Exchange Rate Effects 14,879 Net Revenues at Constant Currency 1,538,456 1,444,613 6.5% In thousands of euros Q2 2023 Q2 2022 % Var Reported Biopharma Revenues 1,267,643 1,192,095 6.3% Variation due to Exchange Rate Effects 11,455 Reported Biopharma Net Revenues at Constant Currency 1,279,098 1,192,095 7.3% In thousands of euros Q2 2023 Q2 2022 % Var Reported U.S. + Canada Net Revenues 979,313 967,557 1.2% Variation due to Exchange Rate Effects 7,145 Reported U.S. + Canada Net Revenues at Constant Currency 986,458 967,557 2.0% In thousands of euros Q2 2023 Q2 2022 % Var Reported EU Net Revenues 248,529 214,521 15.9% Variation due to Exchange Rate Effects (58) Reported EU Net Revenues at Constant Currency 248,471 214,521 15.8% In thousands of euros Q2 2023 Q2 2022 % Var Reported ROW Net Revenues 295,735 262,535 12.6% Variation due to Exchange Rate Effects 7,792 Reported ROW Net Revenues at Constant Currency 303,527 262,535 15.6%

GRAPHIC

Q2 2023 Results - 44 - Net Revenue Reconciliation Constant Currency Incl. Biotest | Q2 2023 Annex Q2 2023 - NET REVENUE RECONCILIATION CONSTANT CURRENCY In thousands of euros Q2 2023 Q2 2022 % Var Reported Net Revenues 1,663,458 1,542,900 7.8% Variation due to Exchange Rate Effects 15,204 Net Revenues at Constant Currency 1,678,662 1,542,900 8.8% In thousands of euros Q2 2023 Q2 2022 % Var Reported Biopharma Net Revenues 1,407,524 1,290,382 9.1% Variation due to Exchange Rate Effects 11,779 Reported Biopharma Net Revenues at Constant Currency 1,419,303 1,290,382 10.0% In thousands of euros Q2 2023 Q2 2022 % Var Reported Diagnostic Net Revenues 165,013 159,687 3.3% Variation due to Exchange Rate Effects 2,855 Reported Diagnostic Net Revenues at Constant Currency 167,868 159,687 5.1% In thousands of euros Q2 2023 Q2 2022 % Var Reported Bio Supplies Net Revenues 40,349 28,806 40.1% Variation due to Exchange Rate Effects 288 Reported Bio Supplies Net Revenues at Constant Currency 40,637 28,806 41.1% In thousands of euros Q2 2023 Q2 2022 % Var Reported Others & Intersegments Net Revenues 50,572 64,025 (21.0%) Variation due to Exchange Rate Effects 283 Reported Other & Intersegments Net Revenues at Constant Currency 50,855 64,025 (20.6%) In thousands of euros Q2 2023 Q2 2022 % Var Reported U.S. + Canada Net Revenues 979,313 968,722 1.1% Variation due to Exchange Rate Effects 7,145 Reported U.S. + Canada Net Revenues at Constant Currency 986,458 968,722 1.8% In thousands of euros Q2 2023 Q2 2022 % Var Reported EU Net Revenues 321,871 264,855 21.5% Variation due to Exchange Rate Effects (87) Reported EU Net Revenues at Constant Currency 321,784 264,855 21.5% In thousands of euros Q2 2023 Q2 2022 % Var Reported ROW Net Revenues 362,274 309,323 17.1% Variation due to Exchange Rate Effects 8,146 Reported ROW Net Revenues at Constant Currency 370,420 309,323 19.8% Q2 2023 - NET REVENUE RECONCILIATION CONSTANT CURRENCY In thousands of euros Q2 2023 Q2 2022 % Var Reported Net Revenues 1,663,458 1,542,900 7.8% Variation due to Exchange Rate Effects 15,204 Net Revenues at Constant Currency 1,678,662 1,542,900 8.8% In thousands of euros Q2 2023 Q2 2022 % Var Reported Biopharma Net Revenues 1,407,524 1,290,382 9.1% Variation due to Exchange Rate Effects 11,779 Reported Biopharma Net Revenues at Constant Currency 1,419,303 1,290,382 10.0% In thousands of euros Q2 2023 Q2 2022 % Var Reported Diagnostic Net Revenues 165,013 159,687 3.3% Variation due to Exchange Rate Effects 2,855 Reported Diagnostic Net Revenues at Constant Currency 167,868 159,687 5.1% In thousands of euros Q2 2023 Q2 2022 % Var Reported Bio Supplies Net Revenues 40,349 28,806 40.1% Variation due to Exchange Rate Effects 288 Reported Bio Supplies Net Revenues at Constant Currency 40,637 28,806 41.1% In thousands of euros Q2 2023 Q2 2022 % Var Reported Others & Intersegments Net Revenues 50,572 64,025 (21.0%) Variation due to Exchange Rate Effects 283 Reported Other & Intersegments Net Revenues at Constant Currency 50,855 64,025 (20.6%) In thousands of euros Q2 2023 Q2 2022 % Var Reported U.S. + Canada Net Revenues 979,313 968,722 1.1% Variation due to Exchange Rate Effects 7,145 Reported U.S. + Canada Net Revenues at Constant Currency 986,458 968,722 1.8% In thousands of euros Q2 2023 Q2 2022 % Var Reported EU Net Revenues 321,871 264,855 21.5% Variation due to Exchange Rate Effects (87) Reported EU Net Revenues at Constant Currency 321,784 264,855 21.5% In thousands of euros Q2 2023 Q2 2022 % Var Reported ROW Net Revenues 362,274 309,323 17.1% Variation due to Exchange Rate Effects 8,146 Reported ROW Net Revenues at Constant Currency 370,420 309,323 19.8%

GRAPHIC

Q2 2023 Results - 45 - Net Revenue Reconciliation Constant Currency Excl. Biotest | H1 2023 Annex In thousands of euros H1 2023 H1 2022 % Var Reported Net Revenues 2,967,827 2,711,805 9.4% Variation due to Exchange Rate Effects (46,496) Net Revenues at Constant Currency 2,921,331 2,711,805 7.7% In thousands of euros H1 2023 H1 2022 % Var Reported Biopharma Revenues 2,441,096 2,214,603 10.2% Variation due to Exchange Rate Effects (41,561) Reported Biopharma Net Revenues at Constant Currency 2,399,535 2,214,603 8.4% In thousands of euros H1 2023 H1 2022 % Var Reported U.S. + Canada Net Revenues 1,921,960 1,815,818 5.8% Variation due to Exchange Rate Effects (44,993) Reported U.S. + Canada Net Revenues at Constant Currency 1,876,967 1,815,818 3.4% In thousands of euros H1 2023 H1 2022 % Var Reported EU Net Revenues 489,123 423,289 15.6% Variation due to Exchange Rate Effects (701) Reported EU Net Revenues at Constant Currency 488,422 423,289 15.4% In thousands of euros H1 2023 H1 2022 % Var Reported ROW Net Revenues 556,744 472,698 17.8% Variation due to Exchange Rate Effects (802) Reported ROW Net Revenues at Constant Currency 555,942 472,698 17.6%

GRAPHIC

Q2 2023 Results - 46 - Net Revenue Reconciliation Constant Currency Incl. Biotest | H1 2023 Annex In thousands of euros H1 2023 H1 2022 % Var Reported Net Revenues 3,224,946 2,810,092 14.8% Variation due to Exchange Rate Effects (45,575) Net Revenues at Constant Currency 3,179,371 2,810,092 13.1% In thousands of euros H1 2023 H1 2022 % Var Reported Biopharma Net Revenues 2,698,215 2,312,890 16.7% Variation due to Exchange Rate Effects (40,640) Reported Biopharma Net Revenues at Constant Currency 2,657,575 2,312,890 14.9% In thousands of euros H1 2023 H1 2022 % Var Reported Diagnostic Net Revenues 341,488 329,436 3.7% Variation due to Exchange Rate Effects (2,275) Reported Diagnostic Net Revenues at Constant Currency 339,213 329,436 3.0% In thousands of euros H1 2023 H1 2022 % Var Reported Bio Supplies Net Revenues 82,615 52,553 57.2% Variation due to Exchange Rate Effects (1,753) Reported Bio Supplies Net Revenues at Constant Currency 80,862 52,553 53.9% In thousands of euros H1 2023 H1 2022 % Var Reported Others & Intersegments Net Revenues 102,628 115,213 (10.9%) Variation due to Exchange Rate Effects (906) Reported Other & Intersegments Net Revenues at Constant Currency 101,722 115,213 (11.7%) In thousands of euros H1 2023 H1 2022 % Var Reported U.S. + Canada Net Revenues 1,922,864 1,816,983 5.8% Variation due to Exchange Rate Effects (44,993) Reported U.S. + Canada Net Revenues at Constant Currency 1,877,871 1,816,983 3.4% In thousands of euros H1 2023 H1 2022 % Var Reported EU Net Revenues 627,531 473,623 32.5% Variation due to Exchange Rate Effects (462) Reported EU Net Revenues at Constant Currency 627,069 473,623 32.4% In thousands of euros H1 2023 H1 2022 % Var Reported ROW Net Revenues 674,551 519,486 29.8% Variation due to Exchange Rate Effects (121) Reported ROW Net Revenues at Constant Currency 674,430 519,486 29.8% In thousands of euros H1 2023 H1 2022 % Var Reported Net Revenues 3,224,946 2,810,092 14.8% Variation due to Exchange Rate Effects (45,575) Net Revenues at Constant Currency 3,179,371 2,810,092 13.1% In thousands of euros H1 2023 H1 2022 % Var Reported Biopharma Net Revenues 2,698,215 2,312,890 16.7% Variation due to Exchange Rate Effects (40,640) Reported Biopharma Net Revenues at Constant Currency 2,657,575 2,312,890 14.9% In thousands of euros H1 2023 H1 2022 % Var Reported Diagnostic Net Revenues 341,488 329,436 3.7% Variation due to Exchange Rate Effects (2,275) Reported Diagnostic Net Revenues at Constant Currency 339,213 329,436 3.0% In thousands of euros H1 2023 H1 2022 % Var Reported Bio Supplies Net Revenues 82,615 52,553 57.2% Variation due to Exchange Rate Effects (1,753) Reported Bio Supplies Net Revenues at Constant Currency 80,862 52,553 53.9% In thousands of euros H1 2023 H1 2022 % Var Reported Others & Intersegments Net Revenues 102,628 115,213 (10.9%) Variation due to Exchange Rate Effects (906) Reported Other & Intersegments Net Revenues at Constant Currency 101,722 115,213 (11.7%) In thousands of euros H1 2023 H1 2022 % Var Reported U.S. + Canada Net Revenues 1,922,864 1,816,983 5.8% Variation due to Exchange Rate Effects (44,993) Reported U.S. + Canada Net Revenues at Constant Currency 1,877,871 1,816,983 3.4% In thousands of euros H1 2023 H1 2022 % Var Reported EU Net Revenues 627,531 473,623 32.5% Variation due to Exchange Rate Effects (462) Reported EU Net Revenues at Constant Currency 627,069 473,623 32.4% In thousands of euros H1 2023 H1 2022 % Var Reported ROW Net Revenues 674,551 519,486 29.8% Variation due to Exchange Rate Effects (121) Reported ROW Net Revenues at Constant Currency 674,430 519,486 29.8%

GRAPHIC

Q2 2023 Results - 47 - Definition of Non-GAAP Measures and Constant Currency Annex • EBITDA is defined as operating result (EBIT), excluding depreciation of property, plant and equipment, depreciation of right-of-use assets, amortization of intangible assets, and impairments of property, plant and equipment, right-of-use assets and of intangible assets. It is used to evaluate the company's results over time, allowing it to be compared with other companies in the sector. • Adjusted EBITDA is defined as EBITDA, excluding one-offs and items not indicative of our ongoing operating performance, including restructuring and transaction costs. It provides a useful measure for period-to-period comparisons of our business, as it removes the effect of non-recurring items. • EBITDA LTM is defined as EBITDA related to the last 12 months. • Adjusted EBITDA LTM is defined as Adjusted EBITDA related to the last 12 months. • Adjusted EBITDA LTM as per Credit Agreement is defined as net income on a consolidated basis for the Group, plus (i) all financial results, (ii) any losses on ordinary course hedging obligations, (iii) any foreign currency translation, transaction or exchange losses, (iv) any loss of any equity-accounted investee, (v) tax expense, (vi) depreciation, (vii) amortization, write-offs, write-downs, and other non-cash charges, losses and expenses, (viii) impairment of intangibles, (ix) non-recurring losses, (x) transactions costs, (xi) extraordinary, unusual, or non-recurring charges and expenses including transition, restructuring and “carveout” expenses, (xii) any costs and expenses relating to the Issuer’s potential or actual issuance of Equity Interests and (xiii) the amount of cost savings, adjustments, operating expense reductions, operating improvements and synergies, in each case on a “run rate” basis and in connection with acquisitions, investments, restructurings, business optimization projects and other operational changes and initiatives; less (i) interest income, (ii) non-recurring gains, (iii) any income or gains on ordinary course hedging obligations (iv) foreign currency translation, transaction or exchange gains and (v) any income of any equity-accounted investee, in each case, for the last 12 months. • Adjusted Group Profit is defined as group profit, excluding the effect of non-cash expenses and non-recurring items not indicative of our ongoing operating performance, including restructuring and transaction costs. • Constant currency (cc) excludes exchange rate fluctuations over the period.

GRAPHIC

Investor Relations & Sustainability +34 93 571 02 21 investors@grifols.com sustainability@grifols.com inversores@grifols.com sostenibilidad@grifols.com

SIGNATURES


Pursuant to the requirements of the Securities Exchange Act of 1934, the registrant has duly caused this report to be signed on its behalf by the undersigned, thereto duly authorized.


  Grifols, S.A.
     
  By: /s/ David I. Bell
    Name: David I. Bell
    Title: Authorized Signatory


Date:  July 27, 2023


Grifols (NASDAQ:GRFS)
Historical Stock Chart
From Apr 2024 to May 2024 Click Here for more Grifols Charts.
Grifols (NASDAQ:GRFS)
Historical Stock Chart
From May 2023 to May 2024 Click Here for more Grifols Charts.