0000714562false00007145622023-09-012023-09-01

UNITED STATES

SECURITIES AND EXCHANGE COMMISSION

Washington, DC 20549

FORM 8-K

CURRENT REPORT

Pursuant to Section 13 OR 15(d) of the Securities Exchange Act of 1934

Date of Report (Date of earliest event reported) September 1, 2023

FIRST FINANCIAL CORPORATION

(Exact name of registrant as specified in its charter)

Commission File Number: 0-16759

Indiana

35-1546989

(State or other jurisdiction

(I.R.S. Employer

incorporation or organization)

Identification No.)

One First Financial Plaza, Terre Haute, IN

47807

(Address of principal executive office)

(Zip Code)

(812)  238-6000

(Registrant's telephone number, including area code)

Check the appropriate box below if the Form 8-K filing is intended to simultaneously satisfy the filing obligation of the registrant under any of the following provisions:

Written communication pursuant to Rule 425 under the Securities Act (17 CFR 230.425)

Soliciting material pursuant to Rule 14a-12 under the Exchange Act (17 CFR 240.14a-12)

Pre-commencement communication pursuant to Rule 14d-2(b) under the Exchange Act (17 CFR 240.14d-2(b))

Pre-commencement communication pursuant to Rule 13e-4(c) under the Exchange Act (17 CFR 240.13e-4(c))

Securities registered pursuant to Section 12(b) of the Act:

Title of each class

Trading Symbol

Name of each exchange on which registered

Common Stock, par value $0.125 per share

THFF

The NASDAQ Stock Market LLC

Indicate by check mark whether the registrant is an emerging growth company as defined in Rule 405 of the Securities Act of 1933 (17 CFR §230.405) or Rule 12b-2 of the Securities Exchange Act of 1934 (17 CFR §240.12b-2).

Emerging growth company

If an emerging growth company, indicate by check mark if the registrant has elected not to use the extended transition period for complying with any new or revised financial accounting standards provided pursuant to Section 13(a) of the Exchange Act.

Item 7.01. Regulation FD Disclosure.

Norman L. Lowery, Chairman and Chief Executive Officer, Norman D. Lowery, Senior Vice President and Chief Operating Officer, Rodger A. McHargue, Senior Vice President and Chief Financial Officer, and Steve Holliday, Senior Vice President and Chief Credit Officer, of First Financial Corporation, Inc. will participate in the Raymond James U.S. Bank Conference being held September 6 - 7, 2023, by hosting a series of meetings with investors on September 6, 2023.

Attached as Exhibit 99.1 is the information that will be provided to meeting participants. Such information is incorporated herein by reference.

The foregoing information is being furnished pursuant to this Item 7.01 and shall not be deemed to be “filed” for purposes of section 18 of the Securities Exchange Act of 1934, as amended, or otherwise subject to the liabilities of that Section or Sections 11 and 12(a)(2) of the Securities Act of 1933, as amended. In addition, this information shall not be deemed to be incorporated by reference into any of the Registrant’s filings with the Securities and Exchange Commission, except as shall be expressly set forth by specific reference in any such filing.

Item 9.01. Financial Statements and Exhibits

The exhibit to this report is as follows:

Exhibit Number


99.1

First Financial Corporation, Inc. Presentation dated September 6, 2023.

104

Cover Page Interactive Data File (formatted in Inline XBRL and contained in Exhibit 101)

SIGNATURES

Pursuant to the requirements of the Securities Exchange Act of 1934, as amended, the Registrant has duly caused this report to be signed on its behalf by the undersigned hereunto duly authorized.

First Financial Corporation

Dated September 1, 2023

/s/ Rodger A. McHargue

Rodger A. McHargue

Secretary/Treasurer and Chief Financial Officer

Exhibit 99.1

GRAPHIC

Thirty-five consecutive years of increased shareholder dividends. : THFF 1

GRAPHIC

Forward-looking Information This presentation contains future oral and written statements of the Company and its management, forward-looking statements within the meaning of the Private Securities Litigation Reform Act of 1995 with respect to the financial condition, results of operations, plans, objectives, future performance and business of the Company. Forward-looking statements are generally identifiable by the use of words such as “believe”, “expect”, “anticipate”, “estimate”, “could”, and other similar expressions. All statements in this presentation, including forward-looking statements, speak only as of today’s date, and the Company undertakes no obligation to update any statement in light of new information or future events. A number of factors, many of which are beyond the ability of the Company to control or predict, could cause actual results to differ materially from those in its forward-looking statements. Additional information is included in the Company’s filings with the Securities and Exchange Commission. Factors that could have a material adverse effect on the Company’s financial condition, results of operations and future prospects can be found in the “Risk Factors” section in the Company’s Annual Report on Form 10-K for the year ended December 31, 2022 and elsewhere in the Company’s periodic and current reports filed with the Securities and Exchange Commission. These factors include, but are not limited to, the effects of future economic, business and market conditions and changes, domestic and foreign, including competition, governmental policies and seasonality; legislative and regulatory changes, including changes in banking, securities and tax laws and regulations and their application by Company regulators, and changes in the scope and cost of FDIC insurance and other coverages; the risks of changes in interest rates on the levels, composition and costs of deposits, loan demand and other interest sensitive assets and liabilities; the failure of assumptions and estimates underlying the establishment of reserves for possible loan losses, analysis of capital needs and other estimates; changes in borrowers’ credit risks and payment behaviors; and changes in the availability and cost of credit and capital. 2

GRAPHIC

Norman L. Lowery Chairman, Chief Executive Officer, President Norman D. Lowery Chief Operating Officer, SVP Rodger A. McHargue Chief Financial Officer, SVP Steven H. Holliday Chief Credit Officer, SVP 3

GRAPHIC

First Financial Corporation Indiana’s first multi-bank holding company Established 1984 77 Locations 71 full service banking centers 6 loan production offices $4.9 Billion in Assets June 30, 2023 $1.7 Billion Trust and Assets Under Management First Financial Bank Primary subsidiary founded in 1834 Oldest national bank in Indiana 5th oldest national bank in the U.S. Terre Haute, Indiana Headquarters Illinois 26 Banking Centers Indiana 22 Banking Centers 4 Loan Offices Kentucky 17 Banking Centers Tennessee 6 Banking Centers 2 Loan Offices 4

GRAPHIC

5 Our Vision To enhance our clients’ abilities to spend, save, borrow and invest. Our Mission To deliver financial solutions that are simple, fast and easy. Our Values We build strong relationships and treat each other with dignity and respect. We embrace the diversity of our customers and co-workers. We apply the highest standards of excellence to everything we do. We work as a team to deliver world-class customer service. We get involved in our communities. We recognize profitability is essential to our future success. Best Bank Tribune-Star Readers’ Choice and Cheatham County Main Street Awards 5-Star Rating BauerFinancial One of America’s Best Banks Top 100 Publicly Traded U.S. Bank Bank Director Magazine Sm-All Star 2022 Top 35 Banks and Thrifts PIPER | SANDLER

GRAPHIC

Capital to Support Strategic Growth Value Proposition Increasing Shareholder Value Experienced Management Team Proven Earnings 180+ year Operating Track Record Strong Risk Management Well-positioned Balance Sheet & Strong Asset Quality 6

GRAPHIC

TBV $0.00 $10.00 $20.00 $30.00 $40.00 2001 2003 2005 2007 2009 2011 2013 2015 2017 2019 2021 2Q23 CAGR 6.3% Strong Capital Key Capital Ratios and Per Share Data As of June 30, 2023 0.00% 3.50% 7.00% 10.50% 14.00% 2001 2003 2005 2007 2009 2011 2013 2015 2017 2019 2021 2Q23 TCE Total Risk Based 15.50% Tier 1 Risk Based 14.44% Tier 1 Leverage 11.53% Book Value $41.47 Tangible Book Value $33.70 7

GRAPHIC

History of Earnings and Dividend Growth Earnings and Dividends Per Share '- 1.50 3.00 4.50 6.00 2000 2001 2002 2003 2004 2005 2006 2007 2008 2009 2010 2011 2012 2013 2014 2015 2016 2017 2018 2019 2020 2021 2022 1.17 1.02 1.02 1.04 1.06 2.50 0.93 0.94 0.96 0.97 0.98 0.99 0.86 0.88 0.90 0.91 0.80 0.84 0.75 0.60 0.65 0.51 0.56 5.82 4.02 3.93 3.80 3.80 2.38 3.12 2.35 2.55 2.37 2.48 2.83 2.14 1.73 1.94 1.89 1.72 1.77 2.07 1.95 2.10 1.78 1.72 EPS Dividends Paid 10 YR CAGR 2000 - 2021 EPS 14.56% Dividends 2.19% 8

GRAPHIC

History of Shares Repurchases Announced Repurchase Amount Shares Amount Completed April 21, 2022 10% 1,243,531 In Progress ** July 21, 2021 5% 652,411 $28,335,713 3/4/22 October 29, 2020 5% 685,726 $29,300,476 6/25/21 February 3, 2016 5% 637,500 $21,677,750 11/30/20 August 25, 2014 5% 667,700 $21,627,262 8/19/15 **As of 08/25/2023 purchased 610,111 for $23,927,044. 633,420 shares remain. 9

GRAPHIC

FFIEC BHC UBPR Data Centralized committee structure We are an in-market lender to clients Disciplined underwriting Net Charge-offs 0.00% 0.04% 0.08% 0.11% 0.15% '(1,000) '- 1,000 2,000 3,000 4,000 2Q22 3Q22 4Q22 1Q23 2Q23 Dollar ($000) % Total Loans 0.05% 0.06% 0.08% 0.10% 0.01% 0.05% 0.06% 0.08% 0.10% 0.01% 0.00% 0.40% 0.80% 1.20% 1.60% 44,000 45,000 46,000 47,000 48,000 2Q22 3Q22 4Q22 1Q23 2Q23 Amount ($000) % Total Loans 1.29% 1.29% 1.51% 1.46% 1.59% 1.29% 1.29% 1.51% 1.46% 1.59% Reserves / Loans Non-Performing Assets Strong Asset Quality NPA ($000) Total NPAS / Loans 2Q22 12,620 0.44% 3Q22 17,604 0.59% 4Q22 12,923 0.42% 1Q23 15,327 0.50% 2Q23 16,302 0.52% 10

GRAPHIC

Better than Peer Performance Non-interest Income % Avg Assets '- 0.43 0.85 1.28 1.70 2016 2017 2018 2019 2020 2021 2022 1Q23 FFC Peer 0.71 0.79 0.91 0.93 0.9 0.9 0.98 0.94 0.77 0.93 0.88 1.00 1.12 1.32 1.22 1.61 0.71 0.79 0.91 0.93 0.9 0.9 0.98 0.94 Return on Assets '- 0.40 0.80 1.20 1.60 2016 2017 2018 2019 2020 2021 2022 2Q23 FFC Peer 1.09 1.17 1.25 0.97 1.19 1.22 0.95 0.92 1.32 1.41 1.10 1.25 1.42 1.56 0.98 1.30 1.09 1.17 1.25 0.97 1.19 1.22 0.95 0.92 FFIEC BHC UBPR Data FFIEC BHC UBPR Data 11

GRAPHIC

Net Interest Income Loan Growth Driving Growth in Income 2.00 3.00 4.00 5.00 6.00 '- 42,500 85,000 127,500 170,000 2017 2018 2019 2020 2021 2022 YTD 06/30/23 NII NIM 3.88 3.55 3.2 4.05 4.25 4.32 4.11 86,522 165,042 143,401 146,346 131,652 116,579 107,857 3.88 3.55 3.2 4.05 4.25 4.32 4.11 11.09% CAGR $’s in (000’s) 12

GRAPHIC

Diversified Loan Portfolio Loan Portfolio Balance ($000) Commercial Loans By State Total $3,127,796 Loan Portfolio ($000) Balance Percent Commercial $2,117,518 67.7% Consumer $750,234 24.0% Residential $260,044 8.3% Total $3,127,796 100% Other 25% TN 14% KY 7% IL 11% IN 43% Residential 8.3% Consumer 24.0% Commercial 67.7% Residential $260,044 Consumer $750,234 Commercial $2,117,518 Other 26% TN 14% KY 7% IL 9% IN 44% 13

GRAPHIC

Consumer Loan Portfolio Total Loans $750,234,000 98.7% Secured Consumer Loans 57.0% ≥ 701 FICO 23.0% 651 to 700 15.0% 600 to 650 5.0% < 600 (Includes No Score) 67.89% Indirect Auto ($509,317,000) 13.4% New ($68,238,868) 86.6% Used ($441,078,132) Asset Quality 30 – 89 day YTD Average Past Due 1.88% Credit Card 0.6% Other 4.6% Indirect Auto 67.9% Direct Auto 10.9% HELOC 16.0% 14

GRAPHIC

Mortgage Loan Portfolio Total Loans $260,044,000 49.7% YTD Production Sold • Average New Production LTV 82.98% • Average New Production FICO 723 • Primarily in-market lender Portfolio • Underwritten to FHLMC Guidelines • 85.0% with credit scores > 650 • Average Amortized LTV 64.6% Asset Quality • YTD average past due 1.41% 15

GRAPHIC

Commercial Real Estate Loan Mix As a % of CRE Residential/Multi-family $440,616,147 Commercial Income Property $309,578,799 Owner Occupied CRE $69,749,180 NOO Retail $89,588,555 Hotel/Motel $69,834,650 Residential & Non-Residential Property Management $51,231,759 Lessors of Other Real Estate Property $44,804,418 Mini-warehouse/Self-Storage $14,225,671 Single Family Housing $8,154,179 Land Development $5,142,680 Other NOO CRE $1,925,440 Total $1,104,851,475 Total Commercial Real Estate Loans Other NOO CRE 0.17% Land Development 0.47% Single Family Housing/Subdivisions 0.74% Mini-warehouses/Self Storage 1.29% Lessors of Other Real Estate Property 4.06% Residential & Non-Residential Property Managers 4.64% Owner Occupied CRE 6.31% Hotels and Motels 6.32% NOO Retail/Restaurants 8.11% Commercial Income Property 28.02% Residential/Multi-Family 39.88% 16

GRAPHIC

Commercial & Industrial Loan Mix as a % of Total C & I Loans Agriculture 23.48% $237,791,149 Construction 7.62% $77,112,755 Health Services 7.07% $71,630,653 Banking & Financial Services 4.77% $48,308,509 Floor Plans & Auto Industry 3.87% $39,140,229 Retail Eating Establishments 1.37% $13,380,150 Other Retail + Convenience 4.81% $48,749,718 Transportation 5.00% $50,653,188 Manufacturing 2.49% $25,260,858 Personal Services 9.54% $96,568,437 Government Entities 8.27% $83,725,255 Schools 2.09% $21,189,555 Forestry, Oil, Gas & Energy 2.33% $23,577,235 Religious Organizations 1.25% $12,663,039 Amusement & Recreation 1.85% $18,751,576 Wholesale Distribution 2.30% $23,269,728 All Other 11.89% $120,445,076 Total 100.00% $1,012,667,000 Other 11.89% Wholesale Distribution 2.30% Amusement & Recreation 1.85% Religious Organizations 1.25% Forestry, Oil/Gas & Energy 2.33% Schools 2.09% Government Entities 8.27% Personal Services 9.54% Manufacturing 2.49% Transportation 5.00% Other Retail+Convenience 4.81% Retail Eating Establishments 1.37% Floor Plan & Auto Industry 3.87% Banking & Financial Services 4.77% Health Services 7.07% Construction 7.62% Agriculture 23.48% 17

GRAPHIC

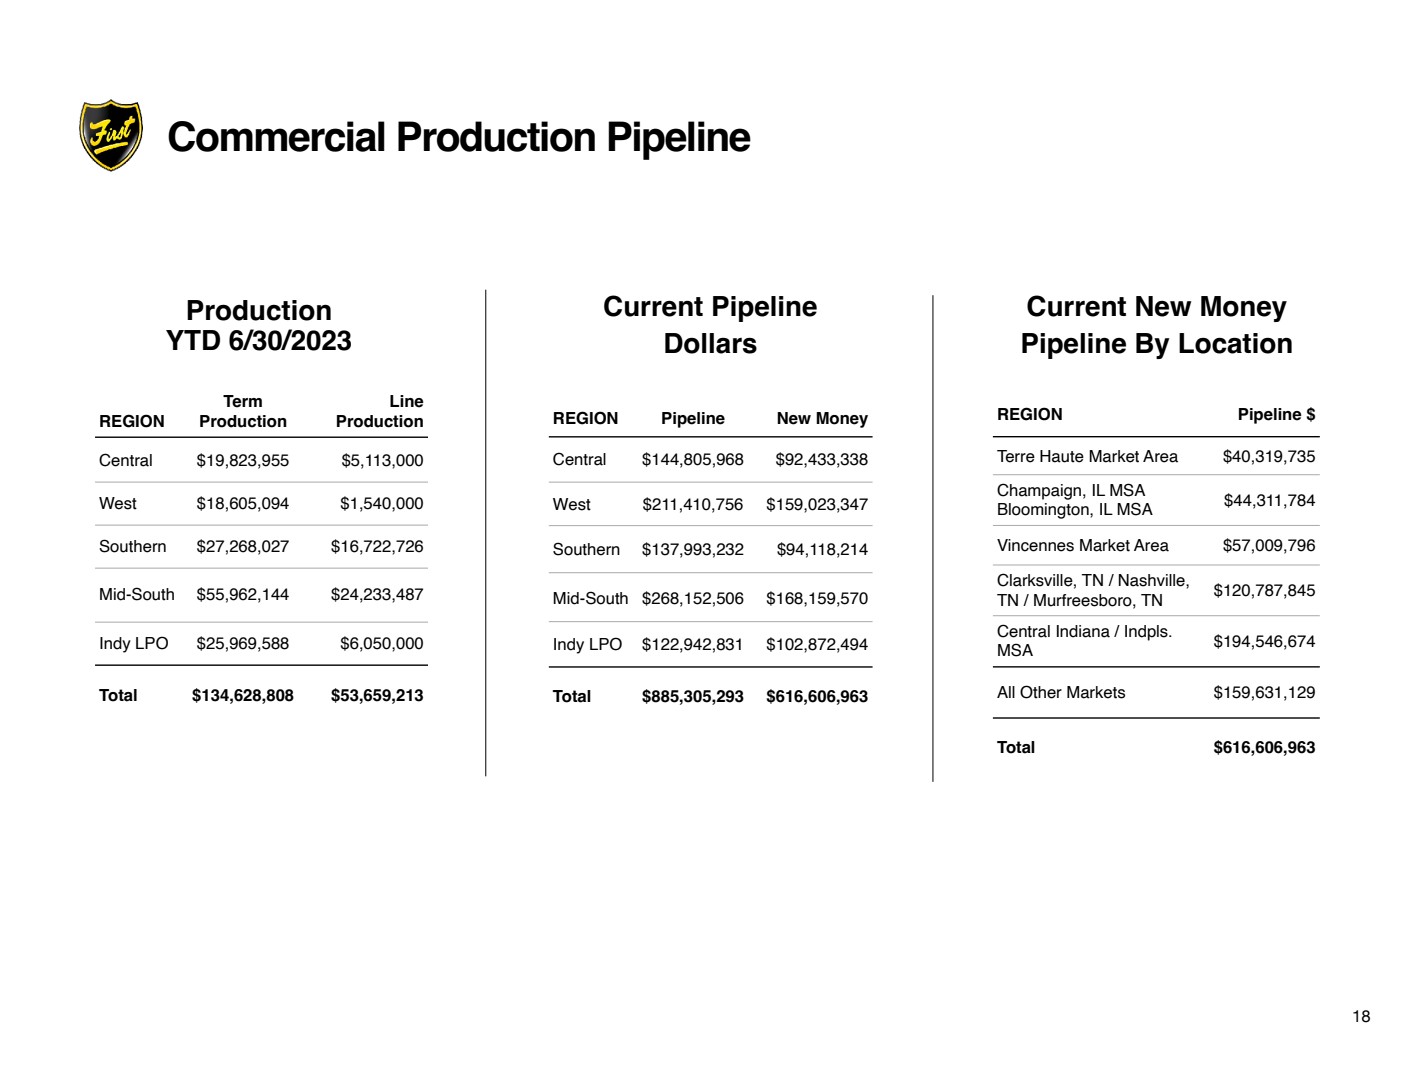
Commercial Production Pipeline Production YTD 6/30/2023 REGION Pipeline New Money Central $144,805,968 $92,433,338 West $211,410,756 $159,023,347 Southern $137,993,232 $94,118,214 Mid-South $268,152,506 $168,159,570 Indy LPO $122,942,831 $102,872,494 Total $885,305,293 $616,606,963 Current Pipeline Dollars REGION Term Production Line Production Central $19,823,955 $5,113,000 West $18,605,094 $1,540,000 Southern $27,268,027 $16,722,726 Mid-South $55,962,144 $24,233,487 Indy LPO $25,969,588 $6,050,000 Total $134,628,808 $53,659,213 REGION Pipeline $ Terre Haute Market Area $40,319,735 Champaign, IL MSA Bloomington, IL MSA $44,311,784 Vincennes Market Area $57,009,796 Clarksville, TN / Nashville, TN / Murfreesboro, TN $120,787,845 Central Indiana / Indpls. MSA $194,546,674 All Other Markets $159,631,129 Total $616,606,963 Current New Money Pipeline By Location 18

GRAPHIC

Deposit Mix Strong Core Deposit Franchise 0.00% 0.27% 0.55% 0.83% 1.10% 2011 2013 2015 2017 2019 2021 2023 YTD 1.03% 0.38% 0.20% 0.36% 0.56% 0.37% 0.25% 0.19%0.16%0.17% 0.25% 0.38% 0.63% Cost of Deposits BHC UBPR Interest Expense '- 0.35 0.70 1.05 1.40 2016 2017 2018 2019 2020 2021 2022 Q123 YTD FFC Peer 1.24 0.44 0.20 0.54 0.95 0.75 0.54 0.45 0.85 0.36 0.18 0.32 0.50 0.32 0.23 0.16 1.24 0.44 0.20 0.54 0.95 0.75 0.54 0.45 FFIEC BHC UBPR Data Brokered CDs Time Demand & Savings Non-interest bearing 69.7% 20.1% 10.1% ..1% Core deposits 98.4% Average account tenure 13.3 years Estimated uninsured deposits as 38.4% of total deposits Estimated uninsured less collateralized as 19.6% total deposits Cycle to date deposit beta 21.6% 19

GRAPHIC

Disciplined Expense Management 0 32500 65000 97500 130000 2016 2017 2018 2019 2020 2021 2022 2Q23 YTD $63,667 $126,023 $117,406 $112,758 $104,348 $91,289 $90,308 $88,747 45.0 51.0 57.0 63.0 69.0 2016 2017 2018 2019 2020 2021 2022 1Q23 FFC Peer 61.95 59.84 60.88 61.22 61.65 61.22 62.21 68.42 60.18 59.51 63.33 59.87 61.23 58.43 61.62 59.4 61.95 59.84 60.88 61.22 61.65 61.22 62.21 68.42 FFIEC BHC UBPR Data Non-interest Expense Efficiency Acquired HopFed Bancorp on 7/27/2019 Acquired Hancock Bancorp on 11/5/2021 20

GRAPHIC

Trust and Asset Management $1.7 Billion Trust Assets Under Management Trust Services include: • Professional Farm Management • Trust Administration • Estate Administration • Retirement Services • Corporate Trust Services Trust & Asset Mgmt 2022 YTD 2023 Revenue ($000) 5,155 2.502 Income before Tax 1,817 684 21

GRAPHIC

Well-positioned for sustainable and profitable growth • Diversified business model with strong risk management • High-caliber team members focused on customer service and technology optimization • Expanding presence in larger growth markets • Commercial banking focus with quality core deposits • Demonstrated ability to successfully complete mergers and acquisitions • Unblemished track record of delivering shareholder value • Thirty-five consecutive years of increased shareholder dividends Key Investment Points 22

GRAPHIC

2020 2021 2022 2Q23 YTD Net Interest Income 146,346 143,401 165,042 86,522 Provision 10,528 2,466 <2,025> 3,600 Non-interest Income 42,476 42,084 46,716 19,828 Non-interest Expense 112,758 117,406 126,023 63,667 Net Income 53,844 52,987 71,109 31,967 Earnings Per Share (diluted) 3.93 4.02 5.82 2.66 Total Assets 4,557,544 5,175,099 4,989,281 4,877,231 Net Interest Margin 4.05 3.20 3.54 3.88 Return on Average Assets 1.25 1.10 1.41 1.33 Return on Average Equity 9.07 8.87 14.37 12.92 3-Year Financial Highlights Dollars in millions except per share data 23

GRAPHIC

Norman L. Lowery Chairman, Chief Executive Officer, President lowerynl@first-online.com 812.238.6487 Thank You! Rodger A. McHargue Chief Financial Officer, SVP rmchargue@first-online.com 812.238.6334 Norman D. Lowery Chief Operating Officer, SVP lowerynd@first-online.com 812.238.6185 Steve Holliday Chief Credit Officer, SVP sholliday@first-online.com 812.238.6264 : THFF 24

v3.23.2
Document and Entity Information
Sep. 01, 2023
Cover [Abstract]  
Document Type 8-K
Document Period End Date Sep. 01, 2023
Securities Act File Number 0-16759
Entity Registrant Name FIRST FINANCIAL CORPORATION
Entity Incorporation, State or Country Code IN
Entity Tax Identification Number 35-1546989
Entity Address, State or Province IN
Entity Address, Address Line One One First Financial Plaza
Entity Address, City or Town Terre Haute
Entity Address, Postal Zip Code 47807
City Area Code 812
Local Phone Number 238-6000
Title of 12(b) Security Common Stock, par value $0.125 per share
Trading Symbol THFF
Security Exchange Name NASDAQ
Entity Emerging Growth Company false
Entity Central Index Key 0000714562
Amendment Flag false
Written Communications false
Soliciting Material false
Pre-commencement Tender Offer false
Pre-commencement Issuer Tender Offer false
v3.23.2
N-2
Sep. 01, 2023
Cover [Abstract]  
Entity Central Index Key 0000714562
Amendment Flag false
Securities Act File Number 0-16759
Document Type 8-K
Entity Registrant Name FIRST FINANCIAL CORPORATION
Entity Address, Address Line One One First Financial Plaza
Entity Address, City or Town Terre Haute
Entity Address, State or Province IN
Entity Address, Postal Zip Code 47807
City Area Code 812
Local Phone Number 238-6000
Entity Emerging Growth Company false

First Financial (NASDAQ:THFF)
Historical Stock Chart
From Apr 2024 to May 2024 Click Here for more First Financial Charts.
First Financial (NASDAQ:THFF)
Historical Stock Chart
From May 2023 to May 2024 Click Here for more First Financial Charts.