Sales Down 12 Percent Year-Over-Year, Gross Margin Higher By 5
Percent as Operational Improvement Continues FORT COLLINS, Colo.,
Oct. 19 /PRNewswire-FirstCall/ -- Advanced Energy Industries, Inc.
(NASDAQ:AEIS) today reported financial results for the third
quarter ended September 30, 2005. (Logo:
http://www.newscom.com/cgi-bin/prnh/20030825/AEISLOGO ) For the
2005 third quarter, sales were $82.0 million, down 6.2 percent
compared to second quarter 2005 sales of $87.4 million, and down
12.4 percent from third quarter 2004 sales of $93.6 million. Third
quarter 2005 gross margin improved to 37.0 percent of sales
compared to 36.7 percent of sales in the second quarter of 2005,
and 31.8 percent of sales in the third quarter of 2004. Operating
income was $2.5 million for the third quarter of 2005, compared to
$5.5 million in the second quarter of 2005, and $1.9 million in the
third quarter of 2004. Third quarter 2005 operating income includes
a $3.0 million litigation settlement charge. The net loss for the
2005 third quarter was $3.9 million, or $0.10 per share. Third
quarter net loss includes the previously mentioned $3.0 million
litigation settlement, $2.1 million related to the early retirement
of the convertible debt, and a non-cash charge of $1.1 million
related to the write-off of deferred debt issuance costs. The third
quarter of 2005 net loss includes a tax provision of $1.6 million
on pretax income earned outside of the United States. The company
is unable to provide a tax benefit from its U.S. tax-loss
carryforwards until it has demonstrated sustained profitability in
the United States. Pretax losses were incurred in the third quarter
of 2005 in the United States primarily due to the litigation
settlement and debt costs detailed above. Second quarter 2005 net
income was $5.9 million, or $0.18 per diluted share. Second quarter
2005 income from continuing operations was $3.3 million, or $0.10
per diluted share. Included in the second quarter 2005 income from
continuing operations was an after-tax gain from the sale of
certain marketable securities of $1.1 million. The third quarter
2004 net loss was $1.1 million, or $0.03 per share. Revenue for the
nine months ended September 30, 2005 was $255.5 million compared to
$306.9 million for the first nine months of 2004. Net income from
continuing operations for the 2005 nine-month period was $147,000,
or $0.00 per diluted share, compared to net income for the 2004
nine-month period of $10.3 million, or $0.31 per diluted share.
During the third quarter of 2005, the Company completed a public
offering of 11.5 million shares. The net proceeds to the Company
totaled $105.7 million, which were used toward the redemption of
the Company's convertible subordinated notes. The redemption was
completed during third quarter of 2005. Dr. Hans Betz, president
and chief executive officer, said, "We were pleased that our
operating performance improved despite the lower revenue caused
principally by soft demand from the semiconductor equipment
customer base. These operational improvements, combined with the
recently completed financing and redemption of the convertible
debt, have improved our balance sheet as we generated $5.4 million
of cash from operations. Our factory in Shenzhen, China is fully
operational and we are well positioned for further improvements in
capability and capacity. "Our innovative product portfolio
continues to be validated across existing and emerging end markets
through additional design wins on an array of technology platforms.
We continue to focus on profitable growth opportunities that best
leverage our differentiated technology and global infrastructure in
the markets we currently serve, and beyond," said Dr. Betz. "We
expect the soft demand environment for semiconductor equipment to
continue in the near term. We anticipate fourth quarter 2005
revenue in the $75 million to $80 million range, and earnings per
share in the range of $0.05 to $0.07," said Dr. Betz. Third Quarter
Conference Call Management will host a conference call today,
Wednesday, October 19, 2005 at 5:00 pm Eastern time to discuss
Advanced Energy's financial results. You may access this conference
call by dialing 888-713-4717. International callers may access the
call by dialing 706-679-7720. For a replay of this teleconference,
please call 706-645-9291, and enter the pass code 9139998. The
replay will be available through Wednesday, October 26, 2005. There
will also be a webcast available at
http://www.advanced-energy.com/. About Advanced Energy Advanced
Energy is a global leader in the development and support of
technologies critical to high-technology manufacturing processes
used in the production of semiconductors, flat panel displays, data
storage products, solar cells, architectural glass, and other
advanced product applications. Leveraging a diverse product
portfolio and technology leadership, Advanced Energy creates
solutions that maximize process impact, improve productivity and
lower the cost of ownership for its customers. This portfolio
includes a comprehensive line of technology solutions in power,
flow, thermal management, and plasma and ion beam sources for
original equipment manufacturers (OEMs) and end-users around the
world. Advanced Energy operates in regional centers in North
America, Asia and Europe and offers global sales and support
through direct offices, representatives and distributors. Founded
in 1981, Advanced Energy is a publicly held company traded on the
Nasdaq National Market under the symbol AEIS. For more information,
please visit our corporate website:
http://www.advanced-energy.com/. Safe Harbor Statement This press
release contains certain forward-looking statements, including the
company's expectations with respect to Advanced Energy's financial
results for the fourth quarter of 2005. Forward-looking statements
are subject to known and unknown risks and uncertainties that could
cause actual results to differ materially from those expressed or
implied by such statements. Such risks and uncertainties include,
but are not limited to: the volatility and cyclicality of the
semiconductor, semiconductor capital equipment and flat panel
display industries, Advanced Energy's ongoing ability to develop
new products in a highly competitive industry characterized by
increasingly rapid technological changes, and other risks described
in Advanced Energy's Form 10- K, Forms 10-Q and other reports and
statements, as filed with the Securities and Exchange Commission.
These reports and statements are available on the SEC's website at
http://www.sec.gov/ . Copies may also be obtained from Advanced
Energy's website at http://www.advanced-energy.com/ or by
contacting Advanced Energy's investor relations at 970-221-4670.
The company assumes no obligation to update the information in this
press release. CONDENSED CONSOLIDATED STATEMENTS OF OPERATIONS
(UNAUDITED) (in thousands, except per share data) Three Months
Ended Nine Months Ended September 30, June 30, September 30, 2005
2004 2005 2005 2004 Sales $81,975 $93,550 $87,386 $255,501 $306,906
Cost of sales 51,635 63,810 55,338 164,038 201,790 Gross profit
30,340 29,740 32,048 91,463 105,116 Operating expenses: Research
and development 10,537 12,576 11,016 32,568 38,795 Selling, general
and administrative 13,600 14,382 13,993 40,494 42,273 Amortization
of intangible assets 504 1,092 518 1,569 3,387 Restructuring
charges 210 (165) 1,068 2,540 242 Litigation settlement 3,000 -- --
3,000 -- Total operating expenses 27,851 27,885 26,595 80,171
84,697 Income from operations 2,489 1,855 5,453 11,292 20,419 Other
expense, net (4,796) (1,994) (719) (7,602) (5,566) (Loss) income
from continuing operations before income taxes (2,307) (139) 4,734
3,690 14,853 Provision for income taxes (1,584) (997) (1,430)
(3,543) (4,595) (Loss) income from continuing operations (3,891)
(1,136) 3,304 147 10,258 Gain on sale of discontinued assets -- --
2,645 2,645 -- Provision for income taxes -- -- -- -- -- Income
from discontinued operations -- -- 2,645 2,645 -- Net (loss) income
$(3,891) $(1,136) $5,949 $2,792 $10,258 Net (loss) income per basic
share (Loss) income from continuing operations $(0.10) $(0.03)
$0.10 $0.00 $0.31 Income from discontinued operations -- -- 0.08
0.08 -- Basic (loss) earnings per share $(0.10) $(0.03) $0.18 $0.08
$0.31 Net (loss) income per diluted share (Loss) income from
continuing operations $(0.10) $(0.03) $0.10 $0.00 $0.31 Income from
discontinued operations -- -- 0.08 0.08 -- Diluted (loss) earnings
per share $(0.10) $(0.03) $0.18 $0.08 $0.31 Basic weighted-average
common shares outstanding 38,366 32,674 32,797 34,639 32,633
Diluted weighted-average common shares outstanding 38,366 32,674
33,094 34,932 33,233 CONDENSED CONSOLIDATED BALANCE SHEETS
(UNAUDITED) (in thousands) September 30, December 31, 2005 2004
ASSETS Current assets: Cash and cash equivalents $51,824 $38,404
Marketable securities 4,032 69,578 Accounts receivable, net 72,094
72,053 Inventories, net 55,849 73,224 Other current assets 2,221
6,140 Total current assets 186,020 259,399 Property and equipment,
net 41,347 44,746 Deposits and other 4,559 6,468 Goodwill and
intangibles, net 71,832 80,308 Customer service equipment, net
2,754 2,968 Deferred debt issuance costs, net -- 2,086 Deferred
income tax assets, net 1,748 -- Total assets $308,260 $395,975
LIABILITIES AND STOCKHOLDERS' EQUITY Current liabilities: Trade
accounts payable $25,470 $17,683 Other accrued expenses 27,889
28,615 Current portion of capital leases and senior borrowings
2,440 3,726 Accrued interest payable on convertible subordinated
notes -- 2,460 Total current liabilities 55,799 52,484 Long-term
liabilities: Capital leases and senior borrowings 2,788 4,679
Deferred income tax liabilities, net -- 3,709 Convertible
subordinated notes payable -- 187,718 Other long-term liabilities
2,173 2,407 Total long-term liabilities 4,961 198,513 Total
liabilities 60,760 250,997 Stockholders' equity 247,500 144,978
Total liabilities and stockholders' equity $308,260 $395,975
CONDENSED CONSOLIDATED STATEMENTS OF CASH FLOWS (UNAUDITED) (in
thousands) Nine Months Ended September 30, 2005 2004 NET CASH
PROVIDED BY (USED IN) OPERATING ACTIVITIES $37,865 $(7,053) NET
CASH PROVIDED BY INVESTING ACTIVITIES 63,558 8,712 NET CASH USED IN
FINANCING ACTIVITIES (86,028) (4,515) EFFECT OF CURRENCY
TRANSLATION ON CASH (1,975) (82) INCREASE (DECREASE) IN CASH AND
CASH EQUIVALENTS 13,420 (2,938) CASH AND EQUIVALENTS, beginning of
period 38,404 41,522 CASH AND EQUIVALENTS, end of period $51,824
$38,584 http://www.newscom.com/cgi-bin/prnh/20030825/AEISLOGO
http://photoarchive.ap.org/ DATASOURCE: Advanced Energy Industries,
Inc. CONTACT: Mike El-Hillow, Executive Vice President, Chief
Financial Officer, +1-970-407-6570, or Cathy Kawakami, Director,
Corporate and Investor Relations, +1-970-407-6732, , both of
Advanced Energy Industries, Inc. Web site:
http://www.advanced-energy.com/
Copyright
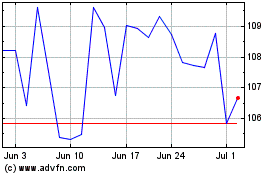
Advanced Energy Industries (NASDAQ:AEIS)
Historical Stock Chart
From Jun 2024 to Jul 2024

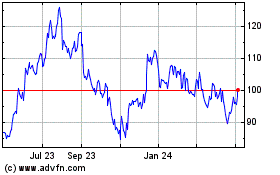
Advanced Energy Industries (NASDAQ:AEIS)
Historical Stock Chart
From Jul 2023 to Jul 2024
