UNITED STATES
SECURITIES AND EXCHANGE COMMISSION
Washington, D.C. 20549
FORM 6-K
Report of Foreign Private Issuer
Pursuant to Rule 13a-16 or 15d-16
of the Securities Exchange Act of 1934
For the Month of March 2024
Commission File Number 001-35948
Kamada Ltd.
(Translation of registrant’s name into English)
2 Holzman Street
Science Park, P.O. Box 4081
Rehovot 7670402
Israel
(Address of principal executive offices)
Indicate by check mark whether the registrant
files or will file annual reports under cover Form 20-F or Form 40-F.
Form 20-F ☒ Form
40-F ☐
This Form 6-K is being incorporated by reference
into the Registrant’s Form S-8 Registration Statements, File Nos. 333-192720, 333-207933, 333-215983, 333-222891, 333-233267 and
333-265866.
The following exhibits are attached:
SIGNATURE
Pursuant to the requirements of the Securities
Exchange Act of 1934, the registrant has duly caused this report to be signed on its behalf by the undersigned hereunto duly authorized.
| Date: March 6, 2024 |
KAMADA LTD. |
| |
|
| |
By: |
/s/ Nir Livneh |
| |
|
Nir Livneh |
| |
|
Vice President General Counsel and
Corporate Secretary |
EXHIBIT INDEX
3
Exhibit 99.1
Kamada Reports Strong Fiscal Year and Fourth
Quarter 2023 Financial Results, and Provides Full-Year 2024 Guidance Representing Double-Digit Growth in Revenue and Profitability
| ● | Total Revenues for Fiscal Year 2023 of $142.5 Million, Representing All-Time Record Annual Revenues
and Up 10% Compared to Fiscal Year 2022 |
| ● | Fiscal Year 2023 Adjusted EBITDA of $24.1 Million, Up 35% Year-over-Year |
| ● | Strong Momentum Supports Expected Double-Digit Growth with Anticipated Fiscal Year 2024 Revenues in
Range of $156 to $160 Million and Expected Adjusted EBITDA in Range of $27 to $30 Million |
| ● | Kamada Maintains Financial Strength to Accelerate Growth and Pursue Compelling New Business Development
Opportunities |
| ● | Recently Amended and Extended U.S. Distribution
Agreement with Kedrion for KEDRAB® Includes $180 Million of Revenues to Kamada Over the First
Four Years of the Agreement Term |
| ● | Positive Feedback from Recent Meeting with the FDA Regarding Ongoing Pivotal Phase 3 Inhaled AAT Clinical
Trial for AAT Deficiency |
| ● | Conference Call and Live Webcast Today at 8:30 AM ET |
Rehovot, Israel, and Hoboken, NJ – March
6, 2024 -- Kamada Ltd. (NASDAQ: KMDA; TASE: KMDA.TA), a commercial stage global biopharmaceutical company with a portfolio of marketed
products indicated for rare and serious conditions and a leader in the specialty plasma-derived field, today announced financial results
for the three months and year ended December 31, 2023.
“We are extremely pleased with the strong
financial and operational momentum we experienced through 2023, which allowed us to achieve our full-year guidance,” said Amir London,
Kamada’s Chief Executive Officer. “Total revenues for 2023 were $142.5 million, representing record annual revenues and 10%
year-over-year growth, and adjusted EBITDA was $24.1 million, up 35% year-over-year. We continue to effectively leverage our growth drivers,
including a significant increase in sales of our anti-rabies immunoglobulin product, KEDRAB® and the promotion of CYTOGAM®.”
“The growing increase in KEDRAB sales is
expected to continue through 2024 and beyond. We recently signed an amendment and extension of our distribution agreement with Kedrion.
This strategic agreement represents our largest commercial pact since Kamada’s inception, and within the first four years of the eight-year
term, which commenced in January 2024, Kedrion is required to purchase minimum quantities of KEDRAB with total revenues to Kamada of approximately
$180 million,” continued Mr. London.
“Looking ahead, we anticipate continued
momentum through 2024, with double-digit top- and bottom-line growth. Specifically, we are introducing full-year 2024 revenue guidance
of $156 million to $160 million and adjusted EBITDA guidance of $27 million to $30 million. We maintain the financial strength and flexibility
to accelerate the growth and profitability of our existing business beyond 2024 at double-digit rates and pursue compelling new business
development opportunities, a process we are actively engaged in and that would further enhance our future growth,” added Mr. London.
“We continue patient enrollment in our ongoing
pivotal Phase 3 InnovAATe clinical trial for the inhaled Alpha-1 Antitrypsin therapy for the treatment of AAT Deficiency. Importantly,
the U.S. Food and Drug Administration (FDA) recently reconfirmed the overall design of the study, endorsed the independent Data and Safety
Monitoring Board’s (DSMB) unblinded positive safety assessment, and accepted our plan to conduct an open-label extension study,
expected to be initiated in mid-2024. The Agency also expressed willingness to potentially accept a P<0.1 alpha level in evaluating
InnovAATe for meeting the efficacy primary endpoint for registration, which may allow for the acceleration of the program. As a result,
we plan to present a revised statistical analysis plan (SAP) and study protocol for the InnovAATe study and to seek the FDA’s feedback
by mid-2024,” concluded Mr. London.
Financial Highlights for the Year Ended December
31, 2023
| ● | Total revenues for 2023 were $142.5 million,
a 10% increase from the $129.3 million generated in 2022. The increase in revenues was primarily attributable to increased sales of KEDRAB
to Kedrion due to increased market share and demand for the product in the U.S. |
| ● | Gross profit and gross margins were $55.5 million
and 39%, respectively, in the year ended December 31, 2023, compared to $46.7 million and 36%, respectively, in 2022. Cost of goods sold
in the Company’s Proprietary segment for the years ended December 31, 2023, and 2022, included $5.4 million of amortization expenses
associated with intangible assets generated through the IgG products acquisition. |
| ● | Operating expenses, including Research and Development
(“R&D”), Sales & Marketing (“S&M”), General and Administrative Expenses (“G&A”) and
other expenses, totaled $45.4 million in the year ended December 31, 2023, as compared to $42.2 million in the prior year. S&M costs
for the years ended December 31, 2023, and 2022, included $1.7 million of amortization expenses of intangible assets generated through
the IgG products acquisition. The increase in operating expenses was attributable to an increase in S&M costs associated with the
acquired portfolio commercial operation, as well as increased R&D costs, primarily due to advancing the pivotal Phase 3 InnovAATe
trial for Inhaled AAT. |
| ● | Net income for the year ended December 31, 2023,
was $8.3 million, or $0.15 per diluted share, as compared to a net loss of $2.3 million, or $(0.05) per share, in the prior year. |
| ● | Adjusted EBITDA, as detailed in the tables below,
was $24.1 million in the year ended December 31, 2023, a 35% increase as compared to $17.8 million in the prior year. |
| ● | Cash provided by operating activities was $4.3
million in the year ended December 31, 2023, as compared to $28.6 million in the prior year. The change correlates to changes in the Company’s
working capital in support of expected growth. |
Financial Highlights for the Three Months Ended
December 31, 2023
| ● | Total revenues were $36.4 million in the fourth
quarter of 2023, compared to $45.4 million in the fourth quarter of 2022. The reduction in sales year-over-year was as a result of a significantly
more balanced quarterly sales spread during 2023 compared to 2022. |
| ● | Gross profit and gross margins were $14.4 million
and 40%, respectively, in the fourth quarter of 2023, compared to $15.3 million and 34%, respectively, in the fourth quarter of 2022.
Cost of goods sold in the Company’s Proprietary Products segment for the fourth quarter of 2023 and 2022, included $1.3 million
of amortization expenses associated with intangible assets generated through the IgG products acquisition. |
| ● | Operating expenses, including R&D, S&M,
G&A and other expenses, totaled $11.6 million in the fourth quarter of 2023, as compared to $11.3 million in the fourth quarter of
2022. S&M costs for the fourth quarter of 2023 and 2022 included $0.4 million of amortization expenses of intangible assets generated
through the IgG products acquisition. |
| ● | Net income was $5.1 million, or $0.09 per share,
in the fourth quarter of 2023, as compared to $2.9 million, or $0.07 per share, in the fourth quarter of 2022. |
| ● | Adjusted EBITDA, as detailed in the tables below,
was $6.4 million in the fourth quarter of 2023, compared to $7.2 million in the fourth quarter of 2022. |
| ● | Cash provided by operating activities was $6.1
million in the fourth quarter of 2023, as compared to cash provided by operating activities of $6.7 million in the fourth quarter of 2022.
The change correlates to the changes in the Company’s working capital in support of expected growth. |
Balance Sheet Highlights
As of December 31, 2023, the Company had cash
and cash equivalents of $55.6 million, as compared to $34.3 million as of December 31, 2022.
Recent
Corporate Highlights
| ● | Announced the amendment
and extension of the KEDRAB U.S. distribution agreement with Kedrion, which represents
the largest commercial agreement in Kamada’s history and includes $180 million of total revenues
to Kamada over the first four years of the eight-year term, which term began this past January. |
| ● | Received feedback from the FDA related to the
progress of the Inhaled AAT study. The FDA reconfirmed the overall design of the study and
endorsed the independent DSMB’s unblinded positive safety assessment. The FDA expressed willingness to potentially accept a P<0.1
alpha level in evaluating InnovAATe for meeting the efficacy primary endpoint for registration. As a result, the Company plans to present
a revised SAP and study protocol for the InnovAATe study and to seek the FDA’s feedback by mid-2024. |
Fiscal Year 2024 Guidance
Kamada expects to generate fiscal year 2024 total
revenues in the range of $156 million to $160 million, and adjusted EBITDA in the range of $27 million to $30 million, representing double
digit top- and bottom-line growth.
Conference Call
Kamada management will host an investment community
conference call on Wednesday, March 6, at 8:30am Eastern Time to discuss these results and answer questions. Shareholders and other interested
parties may participate in the conference call by dialing 1-877-407-0792 (from within the U.S.), 1 809-406-247 (from Israel), or 1 201-689-8263
(International) and entering the conference identification number: 13744277. The call will also be webcast live on the Internet at:
https://viavid.webcasts.com/starthere.jsp?ei=1655132&tp_key=6e560eef4a.
Non-IFRS financial measures
We present EBITDA and adjusted EBITDA because
we use these non-IFRS financial measures to assess our operational performance, for financial and operational decision-making, and as
a means to evaluate period-to-period comparisons on a consistent basis. Management believes these non-IFRS financial measures are useful
to investors because: (1) they allow for greater transparency with respect to key metrics used by management in its financial and operational
decision-making and provide investors with a meaningful perspective on the current underlying performance of the Company’s core
ongoing operations; and (2) they exclude the impact of certain items that are not directly attributable to our core operating performance
and that may obscure trends in the core operating performance of the business. Non-IFRS financial measures have limitations as an analytical
tool and should not be considered in isolation from, or as a substitute for, our IFRS results. We expect to continue reporting non-IFRS
financial measures, adjusting for the items described below, and we expect to continue to incur expenses similar to certain of the non-cash,
non-IFRS adjustments described below. Accordingly, unless otherwise stated, the exclusion of these and other similar items in the presentation
of non-IFRS financial measures should not be construed as an inference that these items are unusual, infrequent or non-recurring. EBITDA
and adjusted EBITDA are not recognized terms under IFRS and do not purport to be an alternative to IFRS terms as an indicator of operating
performance or any other IFRS measure. Moreover, because not all companies use identical measures and calculations, the presentation of
EBITDA and adjusted EBITDA may not be comparable to other similarly titled measures of other companies. EBITDA and adjusted EBITDA are
defined as net income (loss), plus income tax expense, plus or minus financial income or expenses, net, plus or minus income or expense
in respect of securities measured at fair value, net, plus or minus income or expenses in respect of currency exchange differences and
derivatives instruments, net, plus depreciation and amortization expense, plus non-cash share-based compensation expenses and certain
other costs.
For the projected 2024 adjusted EBITDA information
presented herein, the Company is unable to provide a reconciliation of this forward measure to the most comparable IFRS financial measure
because the information for these measures is dependent on future events, many of which are outside of the Company’s control.
Additionally, estimating such forward-looking measures and providing a meaningful reconciliation consistent with the Company’s accounting
policies for future periods is meaningfully difficult and requires a level of precision that is unavailable for these future periods and
cannot be accomplished without unreasonable effort. Forward-looking non-IFRS measures are estimated in a manner consistent with
the relevant definitions and assumptions noted in the Company’s adjusted EBITDA for historical periods.
About Kamada
Kamada Ltd. (the “Company”) is a commercial
stage global biopharmaceutical company with a portfolio of marketed products indicated for rare and serious conditions and a leader in
the specialty plasma-derived field, focused on diseases of limited treatment alternatives. The Company is also advancing an innovative
development pipeline targeting areas of significant unmet medical need. The Company’s strategy is focused on driving profitable
growth from its significant commercial catalysts as well as its manufacturing and development expertise in the plasma-derived and biopharmaceutical
fields. The Company’s commercial products portfolio includes six FDA approved plasma-derived biopharmaceutical products: KEDRAB®,
CYTOGAM®, VARIZIG®, WINRHO SDF®, HEPAGAM B® and GLASSIA®, as well as KAMRAB®, KAMRHO (D)® and two types of
equine-based anti-snake venom (ASV) products. The Company distributes its commercial products portfolio directly, and through strategic
partners or third-party distributors in more than 30 countries, including the U.S., Canada, Israel, Russia, Argentina, Brazil, India Australia
and other countries in Latin America, Europe, the Middle East, and Asia. The Company leverages its expertise and presence in the Israeli
market to distribute, for use in Israel, more than 25 pharmaceutical products that are supplied by international manufacturers and in
addition have eleven biosimilar products in its Israeli distribution portfolio, which, subject to European Medicines Agency (EMA) and
Israeli Ministry of Health approvals, are expected to be launched in Israel through 2028. The Company owns an FDA licensed plasma collection
center in Beaumont, Texas, which currently specializes in the collection of hyper-immune plasma used in the manufacture of KAMRHO (D),
KAMRAB and KEDRAB. In addition to the Company’s commercial operation, it invests in research and development of new product candidates.
The Company’s leading investigational product is an inhaled AAT for the treatment of AAT deficiency, for which it is continuing
to progress the InnovAATe clinical trial, a randomized, double-blind, placebo-controlled, pivotal Phase 3 trial. FIMI Opportunity Funds,
the leading private equity firm in Israel, is the Company’s controlling shareholder, beneficially owning approximately 38% of the
outstanding ordinary shares.
Cautionary Note Regarding Forward-Looking Statements
This
release includes forward-looking statements within the meaning of Section 21E of the U.S. Securities Exchange Act of 1934, as amended,
and the safe harbor provisions of the U.S. Private Securities Litigation Reform Act of 1995. Forward-looking statements are statements
that are not historical facts, including statements regarding: 1) anticipation of continued momentum through 2024, with double-digit
top- and bottom-line growth, 2) full-year 2024 revenue guidance of $156 million to $160 million and adjusted EBITDA guidance of $27 million
to $30 million, 3) maintaining financial strength and flexibility to accelerate the growth and profitability of our existing business
beyond 2024 at double-digit rates and pursue compelling new business development opportunities, a process actively engaged in and that
would further enhance future growth, 4) continue to effectively leverage growth drivers, including a significant increase in sales of
KEDRAB and the promotion of CYTOGAM, 5) increase in KEDRAB sales expected to continue through 2024 and beyond, 6) projected $180 million
revenues from sale of KEDRAB to Kedrion during the first four years of the amended and extended distribution agreement, 7) plans
to initiate an open-label extension study by mid-2024, 8) plans to present a
revised SAP and study protocol for the InnovAATe study and seek the FDA’s feedback, by mid-2024, which may allow for the acceleration
of the program, 9) plans to distribute a portfolio of eleven biosimilar products, expected to be launched subject to EMA and Israeli
Ministry of Health approvals, through 2028. Forward-looking statements are based on Kamada’s current knowledge and its present
beliefs and expectations regarding possible future events and are subject to risks, uncertainties and assumptions. Actual results and
the timing of events could differ materially from those anticipated in these forward-looking statements as a result of several factors
including, but not limited to the evolving nature of the conflicts in the Middle East and the impact of such conflicts in Israel, the
Middle East and the rest of the world, the impact of conflicts on market conditions and the general economic, industry and political
conditions in Israel, the U.S. and globally, continuation of inbound and outbound international delivery routes, continued demand for
Kamada’s products, financial conditions of the Company’s customers, suppliers and services providers, Kamada’s ability
to integrate the new product portfolio into its current product portfolio, Kamada’s ability to grow the revenues of its new product
portfolio, and leverage and expand its international distribution network, ability to reap the benefits of the acquisition of the plasma
collection center, including the ability to open additional U.S. plasma centers, and acquisition of the FDA-approved plasma-derived hyperimmune
commercial products, the ability to continue enrollment of the pivotal Phase 3 InnovAATe clinical trial, unexpected results of clinical
studies, Kamada’s ability to manage operating expenses, additional competition in the markets that Kamada competes, regulatory
delays, prevailing market conditions and the impact of general economic, industry or political conditions in the U.S., Israel or otherwise,
and other risks detailed in Kamada’s filings with the U.S. Securities and Exchange Commission (the “SEC”) including
those discussed in its most recent Annual Report on Form 20-F and in any subsequent reports on Form 6-K, each of which is on file or
furnished with the SEC and available at the SEC’s website at www.sec.gov. The forward-looking statements made herein speak only
as of the date of this announcement and Kamada undertakes no obligation to update publicly such forward-looking statements to reflect
subsequent events or circumstances, except as otherwise required by law.
CONTACTS:
Chaime Orlev
Chief Financial Officer
IR@kamada.com
Brian Ritchie
LifeSci Advisors, LLC
212-915-2578
Britchie@LifeSciAdvisors.com
CONSOLIDATED
STATEMENTS OF FINANCIAL POSITION
| | |
As of December 31, | |
| | |
2023 | | |
2022 | |
| | |
U.S. Dollars in thousands | |
| Assets | |
| |
| Current Assets | |
| | |
| |
| Cash and cash equivalents | |
$ | 55,641 | | |
$ | 34,258 | |
| Trade receivables, net | |
| 19,877 | | |
| 27,252 | |
| Other accounts receivables | |
| 5,965 | | |
| 8,710 | |
| Inventories | |
| 88,479 | | |
| 68,785 | |
| Total Current Assets | |
| 169,962 | | |
| 139,005 | |
| | |
| | | |
| | |
| Non-Current Assets | |
| | | |
| | |
| Property, plant and equipment, net | |
| 28,224 | | |
| 26,157 | |
| Right-of-use assets | |
| 7,761 | | |
| 2,568 | |
| Intangible assets, Goodwill and other long-term assets | |
| 140,465 | | |
| 147,072 | |
| Contract asset | |
| 8,495 | | |
| 7,577 | |
| Total Non-Current Assets | |
| 184,945 | | |
| 183,374 | |
| Total Assets | |
$ | 354,907 | | |
$ | 322,379 | |
| | |
| | | |
| | |
| Liabilities | |
| | | |
| | |
| Current Liabilities | |
| | | |
| | |
| Current maturities of bank loans | |
$ | - | | |
$ | 4,444 | |
| Current maturities of lease liabilities | |
| 1,384 | | |
| 1,016 | |
| Current maturities of other long term liabilities | |
| 14,996 | | |
| 29,708 | |
| Trade payables | |
| 24,804 | | |
| 32,917 | |
| Other accounts payables | |
| 8,261 | | |
| 7,585 | |
| Deferred revenues | |
| 148 | | |
| 35 | |
| Total Current Liabilities | |
| 49,593 | | |
| 75,705 | |
| | |
| | | |
| | |
| Non-Current Liabilities | |
| | | |
| | |
| Bank loans | |
| - | | |
| 12,963 | |
| Lease liabilities | |
| 7,438 | | |
| 2,177 | |
| Contingent consideration | |
| 18,855 | | |
| 17,534 | |
| Other long-term liabilities | |
| 34,379 | | |
| 37,308 | |
| Deferred revenues | |
| - | | |
| - | |
| Employee benefit liabilities, net | |
| 621 | | |
| 672 | |
| Total Non-Current Liabilities | |
| 61,293 | | |
| 70,654 | |
| | |
| | | |
| | |
| Shareholder’s Equity | |
| | | |
| | |
| Ordinary shares | |
| 15,021 | | |
| 11,734 | |
| Additional paid in capital net | |
| 265,848 | | |
| 210,495 | |
| Capital reserve due to translation to presentation currency | |
| (3,490 | ) | |
| (3,490 | ) |
| Capital reserve from hedges | |
| 140 | | |
| (88 | ) |
| Capital reserve from share-based payments | |
| 6,427 | | |
| 5,505 | |
| Capital reserve from employee benefits | |
| 275 | | |
| 348 | |
| Accumulated deficit | |
| (40,200 | ) | |
| (48,484 | ) |
| Total Shareholder’s Equity | |
| 244,021 | | |
| 176,020 | |
| Total Liabilities and Shareholder’s Equity | |
$ | 354,907 | | |
$ | 322,379 | |
CONSOLIDATED
STATEMENTS OF PROFIT OR LOSS AND OTHER COMPREHENSIVE INCOME
| | |
For the year ended | | |
Three months period ended | |
| | |
December 31, | | |
December 31, | |
| | |
2023 | | |
2022 | | |
2023 | | |
2022 | |
| | |
U.S. Dollars in thousands, other than per share information | |
| | |
| | |
| | |
| | |
| |
| Revenues from proprietary products | |
$ | 115,458 | | |
$ | 102,598 | | |
$ | 29,021 | | |
$ | 35,400 | |
| Revenues from distribution | |
| 27,061 | | |
| 26,741 | | |
| 7,411 | | |
| 10,039 | |
| | |
| | | |
| | | |
| | | |
| | |
| Total revenues | |
| 142,519 | | |
| 129,339 | | |
| 36,432 | | |
| 45,439 | |
| | |
| | | |
| | | |
| | | |
| | |
| Cost of revenues from proprietary products | |
| 63,342 | | |
| 58,229 | | |
| 15,479 | | |
| 20,373 | |
| Cost of revenues from distribution | |
| 23,687 | | |
| 24,407 | | |
| 6,541 | | |
| 9,775 | |
| | |
| | | |
| | | |
| | | |
| | |
| Total cost of revenues | |
| 87,029 | | |
| 82,636 | | |
| 22,020 | | |
| 30,148 | |
| | |
| | | |
| | | |
| | | |
| | |
| Gross profit | |
| 55,490 | | |
| 46,703 | | |
| 14,412 | | |
| 15,291 | |
| | |
| | | |
| | | |
| | | |
| | |
| Research and development expenses | |
| 13,933 | | |
| 13,172 | | |
| 3,239 | | |
| 2,991 | |
| Selling and marketing expenses | |
| 16,193 | | |
| 15,284 | | |
| 4,620 | | |
| 4,849 | |
| General and administrative expenses | |
| 14,381 | | |
| 12,803 | | |
| 3,777 | | |
| 3,322 | |
| Other expenses | |
| 919 | | |
| 912 | | |
| - | | |
| 111 | |
| Operating income (loss) | |
| 10,064 | | |
| 4,532 | | |
| 2,776 | | |
| 4,018 | |
| | |
| | | |
| | | |
| | | |
| | |
| Financial income | |
| 588 | | |
| 91 | | |
| 496 | | |
| 59 | |
| Income (expenses) in respect of currency exchange differences and derivatives instruments, net | |
| 55 | | |
| 298 | | |
| (671 | ) | |
| (458 | ) |
| Financial Income (expense) in respect of contingent consideration and other long- term liabilities. | |
| (980 | ) | |
| (6,266 | ) | |
| 2,378 | | |
| (342 | ) |
| Financial expenses | |
| (1,298 | ) | |
| (914 | ) | |
| (45 | ) | |
| (331 | ) |
| Income before tax on income | |
| 8,429 | | |
| (2,259 | ) | |
| 5,024 | | |
| 2,946 | |
| Taxes on income | |
| 145 | | |
| 62 | | |
| (34 | ) | |
| 2 | |
| | |
| | | |
| | | |
| | | |
| | |
| Net Income (loss) | |
$ | 8,284 | | |
$ | (2,321 | ) | |
$ | 5,058 | | |
$ | 2,944 | |
| | |
| | | |
| | | |
| | | |
| | |
| Other Comprehensive Income (loss): | |
| | | |
| | | |
| | | |
| | |
| Amounts that will be or that have been reclassified to profit or loss when specific conditions are met | |
| | | |
| | | |
| | | |
| | |
| Gain (loss) on cash flow hedges | |
| (186 | ) | |
| (776 | ) | |
| 148 | | |
| 54 | |
| Net amounts transferred to the statement of profit or loss for cash flow hedges | |
| 414 | | |
| 634 | | |
| 90 | | |
| 115 | |
| Items that will not be reclassified to profit or loss in subsequent periods: | |
| | | |
| | | |
| | | |
| | |
| Remeasurement gain (loss) from defined benefit plan | |
| (73 | ) | |
| 497 | | |
| (43 | ) | |
| 136 | |
| Total comprehensive income (loss) | |
$ | 8,439 | | |
$ | (1,966 | ) | |
$ | 5,253 | | |
$ | 3,249 | |
| | |
| | | |
| | | |
| | | |
| | |
| Earnings per share attributable to equity holders of the Company: | |
| | | |
| | | |
| | | |
| | |
| Basic net earnings per share | |
$ | 0.17 | | |
$ | (0.05 | ) | |
$ | 0.09 | | |
$ | 0.07 | |
| Diluted net earnings per share | |
$ | 0.15 | | |
$ | (0.05 | ) | |
$ | 0.09 | | |
$ | 0.07 | |
CONSOLIDATED
STATEMENTS OF CASH FLOWS
| | |
For the year ended | | |
Three months period ended | |
| | |
December 31, | | |
December 31, | |
| | |
2023 | | |
2022 | | |
2023 | | |
2022 | |
| | |
| |
| Cash Flows from Operating Activities | |
| | |
| | |
| | |
| |
| Net income (loss) | |
$ | 8,284 | | |
$ | (2,321 | ) | |
$ | 5,058 | | |
$ | 2,944 | |
| | |
| | | |
| | | |
| | | |
| | |
| Adjustments to reconcile net income to net cash provided by (used in) operating activities: | |
| | | |
| | | |
| | | |
| | |
| | |
| | | |
| | | |
| | | |
| | |
| Adjustments to the profit or loss items: | |
| | | |
| | | |
| | | |
| | |
| | |
| | | |
| | | |
| | | |
| | |
| Depreciation and impairment | |
| 12,714 | | |
| 12,155 | | |
| 3,208 | | |
| 3,012 | |
| Financial expenses (income), net | |
| 1,635 | | |
| 6,791 | | |
| (2,248 | ) | |
| 1,072 | |
| Cost of share-based payment | |
| 1,314 | | |
| 1,153 | | |
| 373 | | |
| 218 | |
| Taxes on income | |
| 145 | | |
| 62 | | |
| (34 | ) | |
| 2 | |
| Gain from sale of property and equipment | |
| (5 | ) | |
| - | | |
| - | | |
| - | |
| Change in employee benefit liabilities, net | |
| (125 | ) | |
| (111 | ) | |
| 19 | | |
| (5 | ) |
| | |
| 15,678 | | |
| 20,050 | | |
| 1,318 | | |
| 4,299 | |
| Changes in asset and liability items: | |
| | | |
| | | |
| | | |
| | |
| | |
| | | |
| | | |
| | | |
| | |
| Decrease (increase) in trade receivables, net | |
| 7,835 | | |
| 7,603 | | |
| 5,757 | | |
| (3,141 | ) |
| Decrease (increase) in other accounts receivables | |
| (1,150 | ) | |
| (578 | ) | |
| (3,866 | ) | |
| (3,495 | ) |
| Decrease (increase) in inventories | |
| (19,694 | ) | |
| (1,361 | ) | |
| (14,683 | ) | |
| 4,245 | |
| Decrease (increase) in deferred expenses | |
| 2,814 | | |
| (1,340 | ) | |
| 51 | | |
| 1,256 | ) |
| Increase (decrease) in trade payables | |
| (8,885 | ) | |
| 7,055 | | |
| 11,432 | | |
| 1,160 | |
| Increase (decrease) in other accounts payables | |
| 765 | | |
| 290 | | |
| 1,124 | | |
| (276 | ) |
| Decrease in deferred revenues | |
| 113 | | |
| (20 | ) | |
| 133 | | |
| (20 | ) |
| | |
| (18,202 | ) | |
| 11,649 | | |
| (52 | ) | |
| (271 | ) |
| Cash (paid) during the period for: | |
| | | |
| | | |
| | | |
| | |
| | |
| | | |
| | | |
| | | |
| | |
| Interest paid | |
| (1,228 | ) | |
| (853 | ) | |
| (79 | ) | |
| (303 | ) |
| Interest received | |
| - | | |
| 97 | | |
| (92 | ) | |
| 82 | |
| Taxes paid | |
| (217 | ) | |
| (36 | ) | |
| (43 | ) | |
| (9 | ) |
| | |
| (1,445 | ) | |
| (792 | ) | |
| (214 | ) | |
| (230 | ) |
| | |
| | | |
| | | |
| | | |
| | |
| Net cash provided by (used in) operating activities | |
$ | 4,315 | | |
$ | 28,586 | | |
$ | 6,110 | | |
$ | 6,742 | |
CONSOLIDATED
STATEMENTS OF CASH FLOWS
| | |
For the year ended | | |
Three months period ended | |
| | |
December 31, | | |
December 31, | |
| | |
2023 | | |
2022 | | |
2023 | | |
2022 | |
| | |
U.S Dollars In thousands | |
| Cash Flows from Investing Activities | |
| | |
| | |
| | |
| |
| | |
| | |
| | |
| | |
| |
| Purchase of property and equipment and intangible assets | |
| (5,850 | ) | |
| (3,784 | ) | |
| (1,974 | ) | |
| (977 | ) |
| Proceeds from sale of property and equipment | |
| 7 | | |
| - | | |
| 1 | | |
| - | |
| Net cash provided by (used in) investing activities | |
| (5,843 | ) | |
| (3,784 | ) | |
| (1,973 | ) | |
| (977 | ) |
| | |
| | | |
| | | |
| | | |
| | |
| Cash Flows from Financing Activities | |
| | | |
| | | |
| | | |
| | |
| | |
| | | |
| | | |
| | | |
| | |
| Proceeds from exercise of share base payments | |
| 4 | | |
| 9 | | |
| 1 | | |
| 2 | |
| Proceeds from issuance of ordinary shares, net | |
| 58,231 | | |
| - | | |
| - | | |
| - | |
| Repayment of lease liabilities | |
| (850 | ) | |
| (1,098 | ) | |
| (82 | ) | |
| (256 | ) |
| Repayment of long-term loans | |
| (17,407 | ) | |
| (2,628 | ) | |
| - | | |
| (1,111 | |
| Repayment of other long-term liabilities | |
| (17,300 | ) | |
| (5,626 | ) | |
| (1,500 | ) | |
| (1,506 | |
| Net cash provided by (used in) financing activities | |
| 22,678 | | |
| (9,343 | ) | |
| (1,581 | ) | |
| (2,871 | ) |
| | |
| | | |
| | | |
| | | |
| | |
| Exchange differences on balances of cash and cash equivalent | |
| 233 | | |
| 212 | | |
| 482 | | |
| 112 | |
| | |
| | | |
| | | |
| | | |
| | |
| Increase (decrease) in cash and cash equivalents | |
| 21,383 | | |
| 15,671 | | |
| 3,038 | | |
| 3006 | |
| | |
| | | |
| | | |
| | | |
| | |
| Cash and cash equivalents at the beginning of the period | |
| 34,258 | | |
| 18,587 | | |
| 52,603 | | |
| 31,252 | |
| | |
| | | |
| | | |
| | | |
| | |
| Cash and cash equivalents at the end of the period | |
$ | 55,641 | | |
$ | 34,258 | | |
$ | 55,641 | | |
$ | 34,258 | |
| | |
| | | |
| | | |
| | | |
| | |
| Significant non-cash transactions | |
| | | |
| | | |
| | | |
| | |
| Right-of-use asset recognized with corresponding lease liability | |
$ | 6,546 | | |
$ | 551 | | |
$ | 2,666 | | |
$ | 25 | |
| Purchase of property and equipment and Intangible assets | |
$ | 646 | | |
$ | 618 | | |
$ | 646 | | |
$ | 618 | |
NON-IFRS MEASURES – ADJUSTED
EBITDA
| | |
For the year ended | | |
Three months period ended | |
| | |
December 31, | | |
December 31, | |
| | |
2023 | | |
2022 | | |
2023 | | |
2022 | |
| | |
In thousands | |
| Net income | |
$ | 8,284 | | |
$ | (2,321 | ) | |
$ | 5,058 | | |
$ | 2,944 | |
| Taxes on income | |
| 145 | | |
| 62 | | |
| (34 | ) | |
| 2 | |
| Financial expense (income), net | |
| 1,635 | | |
| 6,791 | | |
| (2,248 | ) | |
| 1,072 | |
| Depreciation and amortization expense | |
| 12,714 | | |
| 12,155 | | |
| 3,208 | | |
| 3,012 | |
| Non-cash share-based compensation expenses | |
| 1,314 | | |
| 1,153 | | |
| 373 | | |
| 218 | |
| Adjusted EBITDA | |
$ | 24,092 | | |
$ | 17,840 | | |
$ | 6,357 | | |
$ | 7,248 | |
9
Exhibit 99.2

INVESTORS MEETING NASDAQ & TASE: KMDA March 2024 March 6, 2024

March 6, 2024 Forward - Looking Statement This presentation is not intended to provide investment or medical advice. It should be noted that some products under develo pme nt described herein have not been found safe or effective by any regulatory agency and are not approved for any use outside of clinical trials. This presentation contains forward - looking statements, which express the current beliefs and expectations of Kamada’s management . Such statements include the 2024 financial guidance, success of the inhaled AAT clinical study, its benefits and potential market size, success of the U.S. plasma collection expa nsi on and revenue potential, and success in launching new products in the Israeli distribution business segment. These statements involve a number of known and unknown risks and unce rta inties that could cause Kamada's future results, performance or achievements to differ significantly from the prospected results, performances or achievements expressed or im pli ed by such forward - looking statements. Important factors that could cause or contribute to such differences include, but are not limited to, risks relating to Kamada's ability to suc ces sfully develop and commercialize its products and product candidates, the progress and results of any clinical trials, the introduction of competing products, the continued market acc ept ance of Kamada’s commercial products portfolio, the impact of any changes in regulation and legislation that could affect the pharmaceutical industry, the difficulty of predicting, obt ain ing or maintaining U.S. Food and Drug Administration, European Medicines Agency and other regulatory authority approvals, the regulatory environment, restrains related to third parties’ IP ri ghts and changes in the health policies and structures of various countries, success of M&A strategies, environmental risks, changes in the worldwide pharmaceutical industry and other fa ctors that are discussed under the heading “Risk Factors” of Kamada’s 2023 Annual Report on Form 20 - F (filed on March 6, 2024), as well as in Kamada’s recent Forms 6 - K filed with the U.S. S ecurities and Exchange Commission. This presentation includes certain non - IFRS financial information, which is not intended to be considered in isolation or as a s ubstitute for, or superior to, the financial information prepared and presented in accordance with IFRS. The non - IFRS financial measures may be calculated differently from, and therefore may not be comparable to, similarly titled measures used by other companies. In accordance with the requirement of the SEC regulations a reconciliation of these non - IFRS financial measures to th e comparable IFRS measures is included in an appendix to this presentation. Management uses these non - IFRS financial measures for financial and operational decision - making and as a mean s to evaluate period - to - period comparisons. Management believes that these non - IFRS financial measures provide meaningful supplemental information regarding Kamada’s perfor mance and liquidity. Forward - looking statements speak only as of the date they are made, and Kamada undertakes no obligation to update any forward - lo oking statement to reflect the impact of circumstances or events that arise after the date the forward - looking statement was made, except as required by applicable securities laws. Yo u should not place undue reliance on any forward - looking statement and should consider the uncertainties and risks noted above, as well as the risks and uncertainties more fully disc uss ed under the heading “Risk Factors” of Kamada’s 2023 Annual Report on Form 20 - F (filed on March 6, 2024) as well as in Kamada’s recent Forms 6 - K filed with the U.S. Securities and Exchange Commission.

March 6, 2024 Kamada Highlights • 6 FDA - approved products with global commercial network selling in over 30 countries • Multiple growth drivers, with significant upside potential and limited downside risk. • Financially strong to accelerate growth and pursue new business development opportunities • Leading innovative product for AATD in late - stage development; targeting a market of over $ 1 B Kamada is a growing commercial - stage global biopharmaceutical company with a portfolio of marketed products indicated for rare and serious conditions. The company is a leader in the specialty plasma - derived field, focused on diseases with limited treatment alternatives. Projected double - digit growth of revenues and profitability in 2024 and beyond Achieved 2023 top - and bottom - line guidance: Revenues of $142.5M and adjusted EBITDA of $24.2M

March 6 , 2024 Financial Growth Trajectory Strong 2023 Results and Expected Continued Momentum Supports Expected Double Digit Growth with 2024 Revenues Guidance of $ 156 - 160 Million and Adjusted EBITDA of $ 27 - 30 Million 104 129 143 156 - 160 2021 2022 2023 2024 Revenues US$M 6 18 24 27 - 30 2021 2022 2023 2024 Adjusted EBITDA US$M 2024 represents annual guidance 2024 represents annual guidance Adjusted EBITDA is defined as net income, plus (i) tax expense, (ii) financial income (expense), net, (iii) depreciation and amortization ; and (v) non - cash share - based compensation expenses

March 6 , 2024 6 FDA - Approved Specialty Plasma Products Key Focus On Transplantation & Rare Conditions

March 6 , 2024 Significant Catalysts Driving Double Digit Growth KEDRAB® ~$33M FY23; significant growth in the U.S. 2024 - 2027 sales guaranteed at $180M ( ave. annual sales of $45M) @ over 50% GM GLASSIA® Glassia royalties $ 10 M - $ 20 M/year through 2040 (~$ 16 M FY 23 ) & Growing Ex - U.S. sales (~ 7 M FY 23 ) @ 40 % GM CYTOGAM® ~$ 17 M FY 23 ; significant growth potential in the U.S. @ over 50 % GM Israel Distribution ~$ 27 M FY 23 ; growing GM due to launch of new innovative products and Biosimilars IgG Portfolio ~$ 42 M FY 23 (including KAMRAB, HEPAGAM, VARIZIG & WINRHO) marketed in over 30 countries, including WHO Kamada Plasma Working to open additional centers; average annual revenues of a mature collection center ranges between $ 8 M - $ 10 M

March 6 , 2024 Strategic Entry Into The U.S. Plasma Collection Market Kamada Plasma was established in Q 1 2021 through the acquisition of an FDA - licensed plasma collection center in Texas, focusing on collecting hyper - immune plasma for specialty IgG ’ s • Strategic transaction, which advances Kamada ’ s objective to evolve into a fully integrated specialty plasma company, enhancing self - supply for our hyperimmune products • Working to open additional centers in the US, collecting hyper - immune plasma as well as normal source plasma (NSP); first center to be opened in Houston, Texas in H 2 - 24 • Average annual revenues of a mature collection center ranges between $ 8 M - $ 10 M

March 6 , 2024 Inhaled AAT Phase 3 Pivotal Study Global, double - blind, randomized, placebo - controlled pivotal Phase 3 clinical trial testing the safety and efficacy of inhaled AAT in patients with AATD. Study design meets FDA and EMA ’ s requirements • FDA recently reconfirmed overall study design, endorsed positive safety data to date, and expressed willingness to potentially accept a P< 0.1 alpha level in evaluating the trial ’ s efficacy primary endpoint for registration • Non - Invasive, at - home treatment. Expected better ease of use and quality of life for AATD patients than current IV Standard - of - Care • A leading new innovative AATD treatment in advanced clinical stage (Ph - 3 ) • Most effective mode of treatment for delivering therapeutic amounts of AAT directly into the airways. Only 1 / 8 th of the IV AAT dosing, more cost - effective ; Favorable market access landscape • Studied in more than 200 individuals to date, with an established safety profile • Substantial opportunity in over a $ 1 billion market • Positive scientific advice from EMA : reconfirms overall study design and acknowledges the statistically and clinically meaningful FEV 1 results demonstrated in previous study • To date recruited over 35 % of the overall required enrollment to the study

March 6, 2024 FY & Q 4 Summary Financial Data Details Q4/ 20 22 Q4/2023 20 22 2023 US $ M 35.4 29.0 102.6 115.5 PROPRIETARY 10.0 7.4 26.7 27.1 DISTRIBUTION Record annual revenues, representing 10% YoY increase 45.4 36.4 129.3 142.5 TOTAL REVENUES 15.3 14.4 46.7 55.5 GROSS PROFIT 34% 40% 36% 39% GROSS MARGIN (11.3) (11.6) (42.2) (45.4) OPEX 2.9 5.1 (2.3) 8.3 NET PROFIT 35% YoY annual increase 7.2 6.4 17.8 24.1 Adjusted EBITDA 34.3 55.6 CASH Including acquisition related intangible assets ($136M @ December 23) 322.4 354.9 TOTAL ASSETS 5 - year term loan paid down in full during Q3 - 23 17.4 0.0 BANK LOAN Acquisition related contingent consideration 84.6 68.2 CONTINGENT LIABILITIES Increase mainly due to a $60M private placement with FIMI 176.0 244.0 EQUITY Contingent liabilities net of available cash 50.3 12.6 NET DEBT Adjusted EBITDA is defined as net income, plus (i) tax expense, (ii) financial income (expense), net, (iii) depreciation and amortization ; and (v) non - cash share - based compensation expenses

March 6, 2024 Kamada Highlights • 6 FDA - approved products with global commercial network selling in over 30 countries • Multiple growth drivers, with significant upside potential and limited downside risk. • Financially strong to accelerate growth and pursue new business development opportunities • Leading innovative product for AATD in late - stage development; targeting a market of over $ 1 B Kamada is a growing commercial - stage global biopharmaceutical company with a portfolio of marketed products indicated for rare and serious conditions. The company is a leader in the specialty plasma - derived field, focused on diseases with limited treatment alternatives. Projected double - digit growth of revenues and profitability in 2024 and beyond Achieved 2023 top - and bottom - line guidance: Revenues of $142.5M and adjusted EBITDA of $24.2M

THANK YOU www.kamada.com
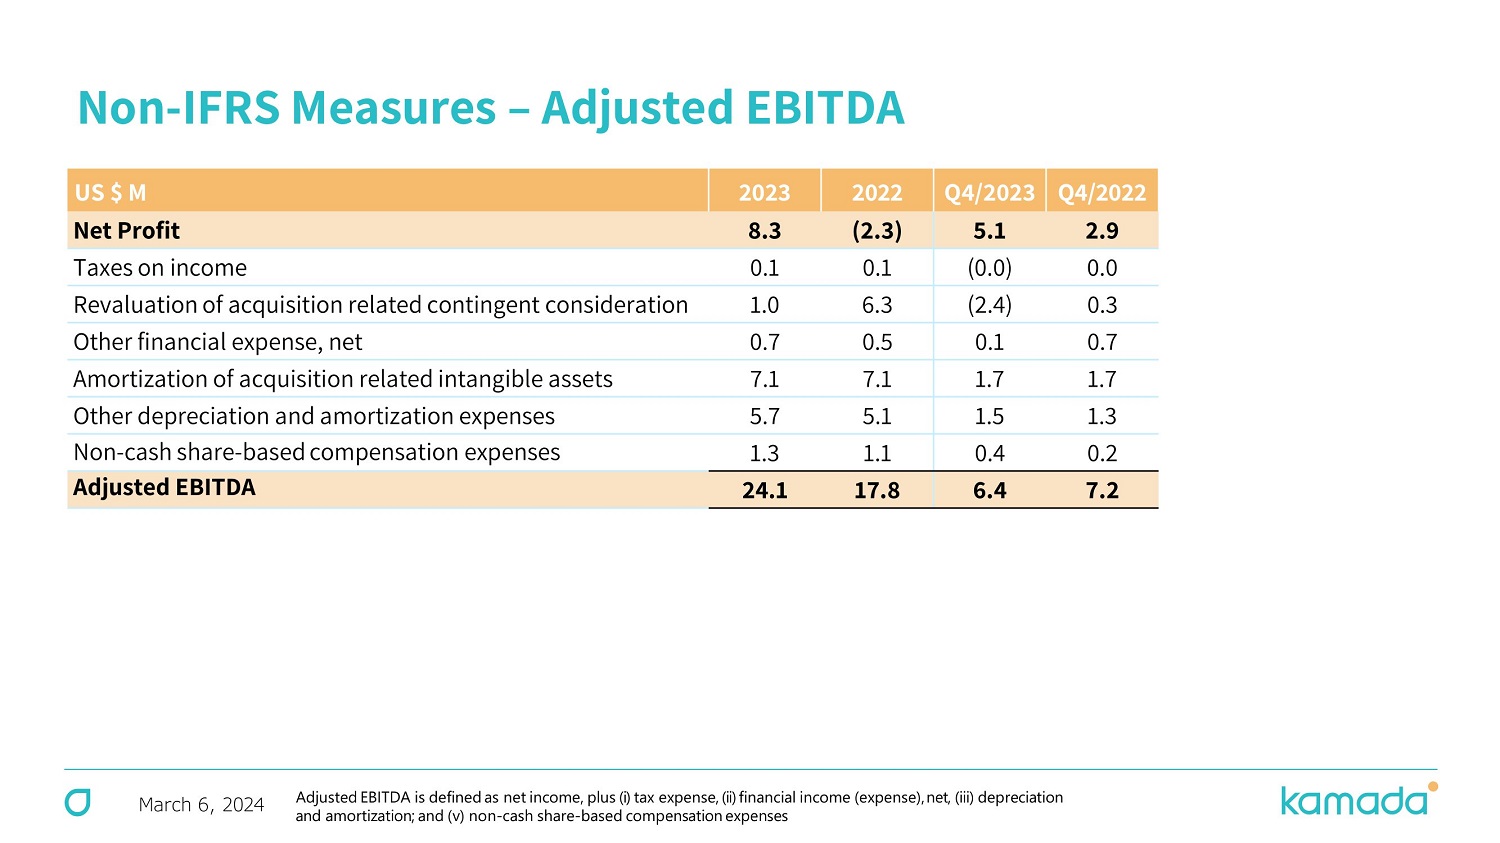
March 6, 2024 Non - IFRS Measures – Adjusted EBITDA Q4/ 20 22 Q4/2023 20 22 2023 US $ M 2.9 5.1 (2.3) 8.3 Net Profit 0.0 (0.0) 0.1 0.1 Taxes on income 0.3 (2.4) 6.3 1.0 Revaluation of acquisition related contingent consideration 0.7 0.1 0.5 0.7 Other financial expense, net 1.7 1.7 7.1 7.1 Amortization of acquisition related intangible assets 1.3 1.5 5.1 5.7 Other depreciation and amortization expenses 0.2 0.4 1.1 1.3 Non - cash share - based compensation expenses 7.2 6.4 17.8 24.1 Adjusted EBITDA Adjusted EBITDA is defined as net income, plus (i) tax expense, (ii) financial income (expense), net, (iii) depreciation and amortization ; and (v) non - cash share - based compensation expenses
Exhibit 99.3
Kamada Issues 2024 CEO Letter to Shareholders
Rehovot, Israel, and Hoboken, NJ – March
6, 2024 -- Kamada Ltd. (NASDAQ: KMDA; TASE: KMDA.TA), a commercial stage global biopharmaceutical company with a portfolio of marketed
products indicated for rare and serious conditions and a leader in the specialty plasma-derived field, today issued a Letter to Shareholders
from Amir London, Chief Executive Officer.
Dear Shareholders, Colleagues and Business Partners:
The recently completed 2023 was another successful
period in our commercial journey as a global leader in the specialty plasma-derived field. During the year, we continued our major transformation
to a diversified, fully integrated specialty plasma company with six U.S. Food and Drug Administration (FDA) approved proprietary products
and strong commercial capabilities in the U.S. market, as well as a sales footprint in over 30 countries.
Earlier today, we reported our full-year 2023
financial results, which met our annual guidance, with total revenues of $142.5 million and adjusted EBITDA of $24.1 million, representing
margins of 17%. Our strong performance in 2023 represented an adjusted EBITDA increase of 35% as compared to 2022.
Looking ahead, we expect the momentum from 2023
to extend throughout 2024, with profitability to be further increased as compared to last year. As such, we are introducing full-year
2024 revenue guidance of $156 million to $160 million, and adjusted EBITDA guidance of $27 million to $30 million, which would represent
double digit top- and bottom-line growth.
Our impressive results in 2023, and positive outlook
for this year, are the outcome of our ability to leverage our growth drivers, including a significant increase in sales of our anti-rabies
immunoglobulin product, KEDRAB®, and the promotion of CYTOGAM®.
These significant catalysts are propelling
our continued annual double-digit profitable growth with substantial upside potential and limited downside risk.
KEDRAB, our anti-rabies immunoglobulin, was especially
impactful in 2023 and following the recent amendment and extension of our distribution agreement with Kedrion, we expect this trend to
continue in 2024 and beyond. Throughout last year, we experienced a significant increase in demand for the product in the United States,
driven by Kedrion’s extensive market coverage and robust commercial activity, as well as the FDA approval for a label expansion
for the product, obtained in 2021, that has differentiated it as the first and only human rabies immunoglobulin available in the United
States to be clinically studied in children. As a result of this significant growth, we generated approximately $32.8 million in revenues
from sales of KEDRAB to Kedrion during 2023, which more than doubled our sales compared to 2022. Looking ahead, the extended agreement
with Kedrion, which is our largest commercial agreement signed since Kamada’s inception, is a tremendous milestone for the company,
guaranteeing approximately $180 million in revenues within the first four years of the eight-year term, which began this
past January.
We are confident that the continuation of our
partnership with Kedrion maximizes the future growth and value potential of KEDRAB, while it also most effectively exploits our U.S. business
by allowing us to focus our own internal sales efforts on the commercialization of our other specialized FDA-approved IgG products, primarily
in transplant centers, as Kedrion continues to promote KEDRAB in numerous hospitals and medical centers across the United States. Our
U.S. team, established in 2022, continues to achieve steady progress in promoting our portfolio to physicians and other healthcare
practitioners through direct engagement and opportunities at medical meetings. Our activities promoting these important therapies, primarily
CYTOGAM and VARIZIG, represent the first time in over a decade that these hyper-immune specialty products are being supported by
field-based activity in the United States. Each of these products made important contributions to our financial results in 2023, and we
expect further impact this year.
CYTOGAM is the largest of the four products we
are self-marketing. The product is indicated for the prophylaxis of cytomegalovirus disease associated with solid organs transplantation.
This proprietary and unique therapy is the only FDA approved IgG product for its indication. During 2023, we received the FDA’s
and Health Canada’s approvals of our applications to manufacture CYTOGAM at our Israeli facility, following completing the technology
transfer of the product manufacturing from its prior manufacturer, CSL Behring. While our CYTOGAM sales during 2023 were temporarily impacted
by the shorted-dated inventory we initially purchased as part of the product acquisition in 2021, the technology transfer approvals and
“fresh” product batches available since October 2023 ensure continuous long-term supply of the product to the U.S. and Canadian
markets, without interruption.
Importantly, during 2023 we established a CYTOGAM
Scientific Advisory Board, consisting of eight U.S. based, world-renowned thought leaders in the solid organ transplantation field, which
evaluates new opportunities and future research and development possibilities for this important product. The results of the first of
those studies, conducted by Dr. Fernando Torres, Clinical Chief, Division of Pulmonary and Critical Care at University of Texas Southwestern
Medical Center, were announced in October 2023 at IDWeek. In his summary, Dr. Torres concludes that the use of a proactive multimodality
CMV prophylaxis consisting of antivirals and immune augmentation with CMV immunoglobulin may improve outcomes among high-risk CMV mismatch
lung transplant recipients. We have already been notified that two additional studies related to the benefits of CYTOGAM, conducted by
other leading U.S. transplantation key opinion leaders (KOLs), have been accepted for presentation at transplantation-related medical
meetings during 2024. We expect these medical and clinical initiatives to continue supporting the increase in usage of CYTOGAM in the
coming years.
In addition to KEDRAB growth and our U.S. promotional
activities, we are leveraging our strong international distribution network to expand revenues of our IgG portfolio in other territories,
primarily in Canada, Asia, Latin America and the Middle East, as well as with the Pan American Health Organization.
We are also very excited about our innovative
investigational Inhaled AAT product candidate for the treatment of AAT Deficiency, a technology that has been shown to be highly effective
in delivering AAT directly into a patient’s lungs. A substantial opportunity exists for Inhaled AAT to be a transformational product
in a market that is already over $1 billion in annual sales in the U.S. and EU. We are currently conducting the InnovAATe clinical trial,
a randomized, double-blind, placebo-controlled, pivotal Phase 3 study. During 2023, we continued recruiting patients into the study and
made significant progress in our regulatory discussions, meeting both the FDA and the European Medicines Agency (EMA), presenting study
progress and safety data and discussing potential opportunities to accelerate the program. Both agencies reconfirmed the design of the
ongoing study and endorsed the positive safety data demonstrated to date. The EMA acknowledged the statistically and clinically meaningful
improvement in lung function, measured by FEV1, demonstrated in our previous Phase 2/3 European study. As a reminder, the results from
the prior study served as the basis for the design and the selection of the primary endpoint for our current pivotal Phase 3 study. During
our discussions with the FDA, the agency expressed its willingness to potentially accept a P<0.1 alpha level in evaluating InnovAATe
for meeting the study’s efficacy primary endpoint for registration, which may allow for the acceleration of the program. As a result,
we plan to present a revised statistical analysis plan and study protocol for the InnovAATe study, and subsequently seek FDA’s feedback
by mid-2024. In parallel to our clinical and regulatory progress, we also continue to have active discussions related to potential partnering
for this promising late-stage product candidate.
During 2023, we continued to receive royalties
from Takeda based on sales of GLASSIA in the United States. We expect royalties in the range of $10 million to $20 million per year through
2040, which will further support our profitability and cash position. In addition, we continue to grow sales of GLASSIA in other international
markets through our local partners.
Another major strategic step we are taking is
the advancement of our plasma collection business through our wholly owned subsidiary, Kamada Plasma, based in Texas. During 2023, we
expanded the hyperimmune plasma collection capacity at our first center and are currently advancing our plan to open additional centers
in the U.S. to further increase our supply of specialty and regular plasma, enhancing our vertical integration and profitability. Our
second center will be opened in Houston, Texas, during the second half of 2024.
In our distribution segment, we are leveraging
our expertise and strong presence in the Israeli market to register, market and distribute more than 25 products that are developed and
manufactured by our international partners. In recent years, we have significantly grown our pipeline of distributed products and in 2024
we anticipate continuing to launch new therapies across multiple medical specialties. An area of key strategic focus in this business
is the planned distribution of a portfolio of eleven biosimilar products, expected to be launched, subject to EMA and Israeli Ministry
of Health approvals, through 2028, with overall annual anticipated peak sales, within several years of launch, to be in the range of approximately
$30 million to $34 million annually. Included in this portfolio are eight products through a distribution agreement with Alvotech, a global
leader in the development and manufacturing of biosimilar drugs.
In closing, 2023 was
another year of significant progress for Kamada during which we executed our plan by leveraging multiple robust value-creating catalysts,
and we are well-positioned for further revenue and profitability growth in 2024, and the years beyond, with substantial upside potential
and limited downside risk as a global leader in the specialty plasma industry.
Importantly, we ended
2023 with over $55 million in cash and continue to have the financial flexibility to both accelerate the growth of our existing business
and pursue compelling business development opportunities, a process we are actively engaged in.
On behalf of the entire
Kamada team, we look forward to continuing to support patients and clinicians with the important lifesaving products that we develop,
manufacture, and commercialize. We thank all of our investors for their support and remain committed to creating long-term shareholder
value.
Sincerely,
Amir London
Chief Executive Officer
Kamada Ltd.
About Kamada
Kamada Ltd. (the “Company”) is a
commercial stage global biopharmaceutical company with a portfolio of marketed products indicated for rare and serious conditions and
a leader in the specialty plasma-derived field, focused on diseases of limited treatment alternatives. The Company is also advancing
an innovative development pipeline targeting areas of significant unmet medical need. The Company’s strategy is focused on driving
profitable growth from its significant commercial catalysts as well as its manufacturing and development expertise in the plasma-derived
and biopharmaceutical fields. The Company’s commercial products portfolio includes six FDA approved plasma-derived biopharmaceutical
products: KEDRAB®, CYTOGAM®, VARIZIG®, WINRHO SDF®, HEPAGAM B® and GLASSIA®, as well as KAMRAB®, KAMRHO (D)®
and two types of equine-based anti-snake venom (ASV) products. The Company distributes its commercial products portfolio directly, and
through strategic partners or third-party distributors in more than 30 countries, including the U.S., Canada, Israel, Russia, Argentina,
Brazil, India Australia and other countries in Latin America, Europe, the Middle East, and Asia. The Company leverages its expertise
and presence in the Israeli market to distribute, for use in Israel, more than 25 pharmaceutical products that are supplied by international
manufacturers and in addition have eleven biosimilar products in its Israeli distribution portfolio, which, subject to European Medicines
Agency (EMA) and Israeli Ministry of Health approvals, are expected to be launched in Israel through 2028. The Company owns an FDA licensed
plasma collection center in Beaumont, Texas, which currently specializes in the collection of hyper-immune plasma used in the manufacture
of KAMRHO (D), KAMRAB and KEDRAB. In addition to the Company’s commercial operation, it invests in research and development of
new product candidates. The Company’s leading investigational product is an inhaled AAT for the treatment of AAT deficiency, for
which it is continuing to progress the InnovAATe clinical trial, a randomized, double-blind, placebo-controlled, pivotal Phase 3 trial.
FIMI Opportunity Funds, the leading private equity firm in Israel, is the Company’s controlling shareholder, beneficially owning
approximately 38% of the outstanding ordinary shares.
Non-IFRS financial measures
We present EBITDA and adjusted EBITDA because
we use these non-IFRS financial measures to assess our operational performance, for financial and operational decision-making, and as
a means to evaluate period-to-period comparisons on a consistent basis. Management believes these non-IFRS financial measures are useful
to investors because: (1) they allow for greater transparency with respect to key metrics used by management in its financial and operational
decision-making and provide investors with a meaningful perspective on the current underlying performance of the Company’s core
ongoing operations; and (2) they exclude the impact of certain items that are not directly attributable to our core operating performance
and that may obscure trends in the core operating performance of the business. Non-IFRS financial measures have limitations as an analytical
tool and should not be considered in isolation from, or as a substitute for, our IFRS results. We expect to continue reporting non-IFRS
financial measures, adjusting for the items described below, and we expect to continue to incur expenses similar to certain of the non-cash,
non-IFRS adjustments described below. Accordingly, unless otherwise stated, the exclusion of these and other similar items in the presentation
of non-IFRS financial measures should not be construed as an inference that these items are unusual, infrequent or non-recurring. EBITDA
and adjusted EBITDA are not recognized terms under IFRS and do not purport to be an alternative to IFRS terms as an indicator of operating
performance or any other IFRS measure. Moreover, because not all companies use identical measures and calculations, the presentation of
EBITDA and adjusted EBITDA may not be comparable to other similarly titled measures of other companies. EBITDA and adjusted EBITDA are
defined as net income (loss), plus income tax expense, plus or minus financial income or expenses, net, plus or minus income or expense
in respect of securities measured at fair value, net, plus or minus income or expenses in respect of currency exchange differences and
derivatives instruments, net, plus depreciation and amortization expense, plus non-cash share-based compensation expenses and certain
other costs. For a reconciliation of the non-IFRS measures, please reference the press release for the quarter ended December 31, 2023
attached to the Current Report on Form 6-K we filed on March 6, 2024 with the Securities and Exchange Commission.
For the projected 2024 adjusted EBITDA information
presented herein, the Company is unable to provide a reconciliation of this forward measure to the most comparable IFRS financial measure
because the information for these measures is dependent on future events, many of which are outside of the Company’s control. Additionally,
estimating such forward-looking measures and providing a meaningful reconciliation consistent with the Company’s accounting policies
for future periods is meaningfully difficult and requires a level of precision that is unavailable for these future periods and cannot
be accomplished without unreasonable effort. Forward-looking non-IFRS measures are estimated in a manner consistent with the relevant
definitions and assumptions noted in the Company’s adjusted EBITDA for historical periods.
Cautionary Note Regarding Forward-Looking Statements
This
letter includes forward-looking statements within the meaning of Section 21E of the U.S. Securities Exchange Act of 1934, as amended,
and the safe harbor provisions of the U.S. Private Securities Litigation Reform Act of 1995. Forward-looking statements are statements
that are not historical facts, including statements regarding: 1) anticipation of continued momentum through 2024, with double-digit
top- and bottom-line growth, 2) full-year 2024 revenue guidance of $156 million to $160 million and adjusted EBITDA guidance of $27 million
to $30 million, 3) maintaining financial strength and flexibility to accelerate the growth and profitability of our existing business
beyond 2024 at double-digit rates and pursue compelling new business development opportunities, a process actively engaged in and that
would further enhance future growth, 4) continue to effectively leverage growth drivers, including a significant increase in sales of
KEDRAB and the promotion of CYTOGAM, 5) increase in KEDRAB sales expected to continue through 2024 and beyond, 6) projected $180 million
revenues from sale of KEDRAB to Kedrion during the first four years of the amended and extended distribution agreement, 7) ensuring continuous
long-term supply of CYTOGAM to the U.S. and Canadian markets, without interruption, 8) plans to initiate
an open-label extension study by mid-2024, 9) plans to present a revised SAP and study protocol for the InnovAATe study and seek the
FDA’s feedback, by mid-2024, which may allow for the acceleration of the program, 10) expected royalties income from
Takeda based on sales of GLASSIA in the U.S. in the range of $10 million to $20 million per year through 2040, 11) enhancing our supply
of specialty and regular plasma through opening additional hyperimmune plasma collection centers in the U.S., including opening our second
center in Houston, Texas, during the second half of 2024, 12) plans to distribute a portfolio of eleven biosimilar products, expected
to be launched subject to EMA and Israeli Ministry of Health approvals, through 2028, with overall annual anticipated peak sales, within
several years of launch, to be in the range of approximately $30 million to $34 million annually and 13) and continuing to launch new
distributed products across multiple medical specialties. Forward-looking statements are based on Kamada’s current knowledge and
its present beliefs and expectations regarding possible future events and are subject to risks, uncertainties and assumptions. Actual
results and the timing of events could differ materially from those anticipated in these forward-looking statements as a result of several
factors including, but not limited to the evolving nature of the conflicts in the Middle East and the impact of such conflicts in Israel,
the Middle East and the rest of the world, the impact of conflicts on market conditions and the general economic, industry and political
conditions in Israel, the U.S. and globally, continuation of inbound and outbound international delivery routes, continued demand for
Kamada’s products, financial conditions of the Company’s customers, suppliers and services providers, Kamada’s ability
to integrate the new product portfolio into its current product portfolio, Kamada’s ability to grow the revenues of its new product
portfolio, and leverage and expand its international distribution network, ability to reap the benefits of the acquisition of the plasma
collection center, including the ability to open additional U.S. plasma centers, and acquisition of the FDA-approved plasma-derived hyperimmune
commercial products, the ability to continue enrollment of the pivotal Phase 3 InnovAATe clinical trial, unexpected results of clinical
studies, Kamada’s ability to manage operating expenses, additional competition in the markets that Kamada competes, regulatory
delays, prevailing market conditions and the impact of general economic, industry or political conditions in the U.S., Israel or otherwise,
and other risks detailed in Kamada’s filings with the U.S. Securities and Exchange Commission (the “SEC”) including
those discussed in its most recent Annual Report on Form 20-F and in any subsequent reports on Form 6-K, each of which is on file or
furnished with the SEC and available at the SEC’s website at www.sec.gov. The forward-looking statements made herein speak only
as of the date of this letter and Kamada undertakes no obligation to update publicly such forward-looking statements to reflect subsequent
events or circumstances, except as otherwise required by law.
CONTACTS:
Chaime Orlev
Chief Financial Officer
IR@kamada.com
Brian Ritchie
LifeSci Advisors, LLC
212-915-2578
britchie@LifeSciAdvisors.com
5
Kamada (NASDAQ:KMDA)
Historical Stock Chart
From Mar 2024 to Apr 2024

Kamada (NASDAQ:KMDA)
Historical Stock Chart
From Apr 2023 to Apr 2024
