UNITED STATES
SECURITIES AND EXCHANGE COMMISSION
WASHINGTON, D.C. 20549
FORM 6-K
REPORT OF FOREIGN PRIVATE ISSUER
PURSUANT TO RULE 13a-16 OR 15d-16
UNDER THE SECURITIES EXCHANGE ACT OF 1934
For the Month of February 2024
Commission File Number: 001-38097
ARGENX SE
(Translation of registrant’s name into English)
Laarderhoogtweg 25
1101 EB Amsterdam, the Netherlands
(Address of principal executive offices)
Indicate by check mark whether the registrant files or will file annual
reports under cover of Form 20-F or Form 40-F.
Form 20-F x
Form 40-F ¨
Indicate
by check mark if the registrant is submitting the Form 6-K in paper as permitted by Regulation S-T Rule 101(b)(1): ¨
Indicate
by check mark if the registrant is submitting the Form 6-K in paper as permitted by Regulation S-T Rule 101(b)(7): ¨
EXPLANATORY NOTE
On February 29, 2024, argenx SE (the
“Company”) issued a press release, an investor presentation and its full year 2023 financial results, copies of which are attached hereto as Exhibits
99.1, 99.2 and 99.3, respectively, and are incorporated by reference herein.
The
information contained in this Current Report on Form 6-K, including Exhibit 99.1, Exhibit 99.2 and Exhibit 99.3, shall be
deemed to be incorporated by reference into the Company’s Registration Statements on Forms F-3
(File No. 333-258251) and S-8 (File Nos. 333-225375, 333-258253,
and 333-274721),
and to be part thereof from the date on which this Current Report on Form 6-K is filed, to the extent not superseded by
documents or reports subsequently filed or furnished.
SIGNATURES
Pursuant to the requirements of the Securities
Exchange Act of 1934, the registrant has duly caused this report to be signed on its behalf by the undersigned, thereunto duly authorized.
| |
ARGENX SE |
| |
|
|
| Date: February 29, 2024 |
By: |
/s/ Hemamalini (Malini) Moorthy |
| |
|
Name: Hemamalini (Malini) Moorthy |
| |
|
Title: General Counsel |
Exhibit 99.1

argenx Reports Full Year 2023 Financial
Results and Provides Fourth Quarter Business Update
$374 million in fourth quarter and $1.2 billion
in full year global net product sales
sBLA for VYVGART®
Hytrulo for CIDP accepted for priority review by FDA with PDUFA target action date of June 21, 2024
On track to report data from six Phase 2 proof-of-concept
trials by end of 2024
Management to host conference call today at
2:30 pm CET (8:30 am ET)
February 29, 2024, 7:00 am CET
Amsterdam, the Netherlands – argenx
SE (Euronext & Nasdaq: ARGX), a global immunology company committed to improving the lives of people suffering from severe autoimmune
diseases, today reported financial results for the full year 2023 and provided a fourth quarter business update.
“argenx reached thousands of new patients
and their families in 2023 by delivering on our commitment to make VYVGART available to the global MG community,” said Tim Van Hauwermeiren,
Chief Executive Officer of argenx. “This expansion demonstrates that VYVGART has the potential to address the high unmet need for
innovation in patients suffering from MG, and moves us closer to sustainability as we build an integrated immunology company. Clinically,
we generated significant data through multiple study readouts, achieving key milestones for both the CIDP and MMN patient communities
and importantly advancing our second molecule, empasiprubart. Looking forward to 2024, we will act with a continued sense of purpose to
expand our patient reach. We will use the learnings and momentum from our gMG launch to strategically lay the groundwork for a potential
CIDP approval, leveraging our current infrastructure and deep relationships in the neurology community to position VYVGART SC for success.
CIDP patients have been waiting for innovation, and we are eager to translate the transformative ADHERE data into potential benefit for
patients as quickly as possible.”
FOURTH QUARTER 2023 AND RECENT BUSINESS UPDATE
Reaching More Patients with VYVGART
VYVGART® (efgartigimod
alfa-fcab) is a first-in-class antibody fragment targeting the neonatal Fc receptor (FcRn), and is now approved in more than 30 countries
globally for the treatment of generalized myasthenia gravis (gMG). VYVGART subcutaneous (SC) (efgartigimod alfa and hyaluronidase-qvfc)
is approved in the U.S. (as VYVGART Hytrulo), Japan (as VYVDURA®) and Europe, making VYVGART the only gMG treatment available
as both an IV and simple SC injection. argenx is planning to reach more patients commercially through its multi-dimensional expansion
efforts, including patients earlier in the MG treatment paradigm and new patient populations through global regulatory approvals for
MG and the expansion of use to treat additional autoimmune indications.

| · | Generated global net product revenues (inclusive of both VYVGART and VYVGART SC) of $374 million in the
fourth quarter and $1.2 billion in the full year of 2023 |
| · | Medicines and Healthcare products Regulatory Agency (MHRA) approved VYVGART SC in the United Kingdom for
the treatment of adult patients with gMG on February 6, 2024, with self-administration |
| · | Ministry of Health, Labour and Welfare (MHLW) approved VYVDURA in Japan for the treatment of adult patients
with gMG, inclusive of seronegative patients, on January 18, 2024, with self-administration |
| · | Decisions on regulatory approvals of VYVGART for gMG expected in Switzerland, Australia, Saudi Arabia
and South Korea by end of 2024 |
| · | Decision on approval of VYVGART SC for gMG in China through Zai Lab expected by end of 2024 |
| · | Decision on approval of VYVGART for primary immune thrombocytopenia (ITP) in Japan expected in first quarter
of 2024 |
| · | Supplemental Biologics License Application (sBLA) for VYVGART Hytrulo accepted for priority review by
FDA for chronic inflammatory demyelinating polyneuropathy (CIDP); Prescription Drug User Fee Act (PDUFA) target action date of June 21,
2024 |
| · | Regulatory submissions of VYVGART SC for CIDP in Japan, Europe, China and Canada expected in 2024 |
| · | Registrational studies to expand VYVGART label into broader MG populations, including in seronegative
patients, expected to start in 2024 |
| · | Update on pre-filled syringe development expected in first half of 2024; ongoing clinical studies expected
to support potential approval in gMG and CIDP in 2024 |
Advancing Current Pipeline
argenx continues to demonstrate breadth and depth
within its immunology pipeline and is advancing multiple pipeline-in-a-product candidates. With efgartigimod, argenx is solidifying its
leadership in FcRn and is on track to be approved or in development in 15 autoimmune indications by 2025. Beyond efgartigimod, argenx
is advancing its earlier stage pipeline programs, including empasiprubart (C2 inhibitor) with Phase 2 studies ongoing in multifocal motor
neuropathy (MMN), delayed graft function (DGF) and dermatomyositis (DM). In addition, argenx is evaluating ARGX-119, a muscle-specific
kinase (MuSK) agonist in both congenital myasthenic syndrome (CMS) and amyotrophic lateral sclerosis (ALS).
| · | Evaluation ongoing to determine path forward in BALLAD study evaluating efgartigimod in bullous pemphigoid
(BP), with an update expected in 2024 |
| · | Topline data from Phase 2 RHO study evaluating efgartigimod in primary Sjogren’s syndrome expected in first half of 2024 |
| · | Topline data from Phase 2 ALPHA study evaluating efgartigimod in post-COVID-19 postural orthostatic tachycardia syndrome (PC-POTS)
expected in first half of 2024 |

| · | Topline data from seamless Phase 2/3 ALKIVIA study evaluating efgartigimod across three myositis subsets
(immune-mediated necrotizing myopathy (IMNM), anti-synthetase syndrome (ASyS), and DM) expected in second half of 2024 |
| · | Full Phase 2 topline data from ARDA study evaluating empasiprubart in MMN expected to be shared in 2024;
cohort 2 is ongoing to determine dose response ahead of Phase 3 study start |
| · | Phase 1 study of ARGX-119 ongoing in healthy volunteers; subsequent Phase 1b/2a trials planned to assess
early signal detection in patients with CMS and ALS in 2024 |
Leveraging Repeatable Innovation Playbook to
Drive Long-Term Pipeline Growth
argenx continues to invest in its discovery engine,
the Immunology Innovation Program (IIP), to drive long-term sustainable pipeline growth. Through the IIP, four new pipeline candidates
have been nominated, including: ARGX-213 targeting FcRn and further solidifying argenx’s leadership in this new class of medicine;
ARGX-121 and ARGX-220, which are first-in-class targets broadening argenx’s focus across the immune system; and ARGX-109, targeting
IL-6, which plays an important role in inflammation.
| · | On track to file four investigational new drug (IND) applications by end of 2025 |
| · | Received $30M milestone from AbbVie for advancement of ABBV-151 (ARGX-115) to Phase 2 |
FOURTH QUARTER AND FULL YEAR 2023 FINANCIAL
RESULTS
argenx SE
UNAUDITED CONDENSED CONSOLIDATED STATEMENTS
OF PROFIT OR LOSS
| | |
Three Months Ended
December 31, | | |
Twelve Months Ended
December 31, | |
| (in thousands of $ except for shares and EPS) | |
2023 | | |
2022 | | |
2023 | | |
2022 | |
| Product net sales | |
$ | 374,351 | | |
$ | 173,396 | | |
$ | 1,190,783 | | |
$ | 400,720 | |
| Collaboration revenue | |
| 32,486 | | |
| 764 | | |
| 35,533 | | |
| 10,026 | |
| Other operating income | |
| 11,003 | | |
| 7,956 | | |
| 42,278 | | |
| 34,520 | |
| Total operating income | |
$ | 417,840 | | |
$ | 182,116 | | |
$ | 1,268,594 | | |
$ | 445,267 | |
| Cost of sales | |
$ | (39,477 | ) | |
$ | (12,786 | ) | |
$ | (117,835 | ) | |
$ | (29,431 | ) |
| Research and development expenses | |
| (306,373 | ) | |
| (147,798 | ) | |
| (859,492 | ) | |
| (663,366 | ) |
| Selling, general and administrative expenses | |
| (208,826 | ) | |
| (135,287 | ) | |
| (711,905 | ) | |
| (472,132 | ) |
| Loss from investment in joint venture | |
| (1,788 | ) | |
| (677 | ) | |
| (4,411 | ) | |
| (677 | ) |
| Total operating expenses | |
| (556,464 | ) | |
| (296,548 | ) | |
| (1,693,643 | ) | |
| (1,165,607 | ) |
| Operating loss | |
$ | (138,624 | ) | |
$ | (114,432 | ) | |
$ | (425,049 | ) | |
$ | (720,341 | ) |
| Financial income | |
$ | 40,308 | | |
$ | 13,925 | | |
$ | 107,386 | | |
$ | 27,665 | |
| Financial expense | |
| (280 | ) | |
| (990 | ) | |
| (906 | ) | |
| (3,906 | ) |
| Exchange gains/(losses) | |
| 37,418 | | |
| 60,259 | | |
| 14,073 | | |
| (32,732 | ) |
| Loss for the period before taxes | |
$ | (61,178 | ) | |
$ | (41,238 | ) | |
$ | (304,496 | ) | |
$ | (729,314 | ) |
| Income tax benefit / (expense) | |
$ | (37,994 | ) | |
$ | 2,625 | | |
$ | 9,443 | | |
$ | 19,720 | |
| Loss for the period | |
$ | (99,172 | ) | |
$ | (38,613 | ) | |
$ | (295,053 | ) | |
$ | (709,594 | ) |
| Loss for the year attributable to: | |
| | | |
| | | |
| | | |
| | |
| Owners of the parent | |
$ | (99,172 | ) | |
$ | (38,613 | ) | |
$ | (295,053 | ) | |
$ | (709,594 | ) |
| Weighted average number of shares outstanding | |
| 59,118,827 | | |
| 55,364,124 | | |
| 57,169,253 | | |
| 54,381,371 | |
| Basis and diluted (loss) per share (in $) | |
| (1.68 | ) | |
| (0.70 | ) | |
| (5.16 | ) | |
| (13.05 | ) |
| Net increase/(decrease) in cash, cash equivalents and current financial assets compared to year-end 2022 and 2021 | |
| | | |
| | | |
$ | 987,296 | | |
$ | (144,180 | ) |
| Cash and cash equivalents and current financial assets at the end of the period | |
| | | |
| | | |
$ | 3,179,844 | | |
$ | 2,192,548 | |

DETAILS OF THE FINANCIAL RESULTS
Total operating income for the fourth quarter
and full year in 2023 was $418 million and $1,269 million, respectively, compared to $182 million and $445 million for the same periods
in 2022, and mainly consists of:
| · | Product net sales of VYVGART and VYVGART SC for the fourth quarter and full year in 2023, were
$374 million and $1,191 million, respectively, compared to $173 million and $401 million for the same periods in 2022. |
| · | Collaboration revenue for the fourth quarter and full year in 2023 was $32 million and $36 million,
respectively, compared to $1 million and $10 million for the same periods in 2022. The increase is mainly related to the clinical development
milestone argenx achieved with AbbVie following the dosing of the first patient in the Phase 2 trial for ABBV-151. Collaboration revenue
for full year in 2023 also includes $1 million in royalty revenue from VYVGART sales in China. |
| · | Other operating income for the fourth quarter and full year in 2023 was $11 million and $42 million,
respectively, compared to $8 million and $35 million for the same periods in 2022. The other operating income for the fourth quarter and
full year in 2023, primarily relates to research and development tax incentives and payroll tax rebates. |
Total operating expenses for the fourth
quarter and full year in 2023 were $556 million and $1,694 million, respectively, compared to $297 million and $1,166 million for the
same periods in 2022, and mainly consists of:
| · | Cost of sales for the fourth quarter and full year in 2023 was $39 million and $118 million, respectively,
compared to $13 million and $29 million for the same periods in 2022. The cost of sales was recognized with respect to the sale of VYVGART
and VYVGART SC. |
| · | Research and development expenses for the fourth quarter and full year in 2023 were $306 million
and $859 million, respectively, compared to $148 million and $663 million for the same periods in 2022. The research and development expenses
mainly relate to external research and development expenses and personnel expenses incurred in the clinical development of efgartigimod
in various indications and the expansion of other clinical and preclinical pipeline candidates. The research and development expenses
for the fourth quarter and the full year in 2023, includes the amortization of the priority review voucher submitted with the sBLA filling for VYVGART Hytrulo for the treatment of
CIDP, which resulted in an expense of $102 million. |
| · | Selling, general and administrative expenses for the fourth quarter and full year in 2023 were
$209 million and $712 million, respectively, compared to $135 million and $472 million for the same periods in 2022. The selling, general
and administrative expenses mainly relate to professional and marketing fees linked to the commercialization of VYVGART and VYVGART SC,
and personnel expenses. |
Financial income for the fourth quarter
and full year in 2023 was $40 million and $107 million, respectively, compared to $14 million and $28 million for the same periods in
2022. The increase in financial income is mainly due to an increase in interest income which results from higher interest rates and a
higher amount of current financial assets, cash and cash equivalents as a result of the financing round in July 2023.
Exchange gains for the fourth quarter and
full year in 2023 were $37 million and $14 million respectively, compared to $60 million of exchange gains and $33 million of exchange
losses for the same periods in 2022. Exchange gains/losses are mainly attributable to unrealized exchange rate gains or losses on the
cash, cash equivalents and current financial assets denominated in Euro.
Income tax for the fourth quarter and full
year in 2023 was $38 million of tax expense and $9 million of tax benefit, respectively, compared to $3 million and $20 million of tax
benefit for the same periods in 2022. Tax expense for the fourth quarter in 2023, consists of $12 million of income tax benefit and $50
million of deferred tax expense, compared to $12 million of income tax expense and $15 million of deferred tax benefit for the comparable
prior period.
Net loss for the fourth quarter and full
year in 2023, was $99 million and $295 million, respectively, compared to $39 million and $710 million over the prior year periods. On
a per weighted average share basis, the net loss was $5.16 and $13.05 for the twelve months ended December 31, 2023 and 2022, respectively.
Cash, cash equivalents and current financial
assets totalled $3.2 billion as of December 31, 2023, compared to $2.2 billion as of December 31, 2022. The increase in cash and cash
equivalents and current financial assets resulted primarily from the closing of a global offering of shares, including a U.S. offering,
which resulted in the receipt of $1.2 billion in net proceeds in July 2023, partially offset by net cash flows used in operating activities.
FINANCIAL GUIDANCE
Based on its current operating plans, argenx expects
its combined Research and development and Selling, general and administrative expenses in 2024 to be less than $2 billion. argenx expects
to utilize up to $500 million of net cash in 2024 on these anticipated operating expenses as well as working capital and capital expenditures.
EXPECTED 2024 FINANCIAL CALENDAR
| · | May 9, 2024: Q1 2024 financial results and business update |
| · | July 25, 2024: Q2 2024 financial results and business update |
| · | October 31, 2024: Q3 2024 financial results and business update |
CONFERENCE CALL DETAILS
The full year 2023 financial results and fourth
quarter business update will be discussed during a conference call and webcast presentation today at 2:30 pm CET/8:30 am ET. A webcast
of the live call may be accessed on the Investors section of the argenx website at argenx.com/investors. A replay of the webcast will
be available on the argenx website.
Dial-in numbers:
Please dial in 15 minutes prior to the live
call.
| Belgium |
32 800 50 201 |
| France |
33 800 943355 |
| Netherlands |
31 20 795 1090 |
| United Kingdom |
44 800 358 0970 |
| United States |
1 888 415 4250 |
| Japan |
81 3 4578 9081 |
| Switzerland |
41 43 210 11 32 |
About argenx
argenx
is a global immunology company committed to improving the lives of people suffering from severe autoimmune diseases. Partnering with
leading academic researchers through its Immunology Innovation Program (IIP), argenx aims to translate immunology breakthroughs into
a world-class portfolio of novel antibody-based medicines. argenx developed and is commercializing the first approved neonatal Fc
receptor (FcRn) blocker, globally in the U.S., Japan, Israel, the EU, the UK, China and Canada. The Company is evaluating
efgartigimod in multiple serious autoimmune diseases and advancing several earlier stage experimental medicines within its
therapeutic franchises. For more information, visit www.argenx.com and follow
us on LinkedIn, Twitter, and Instagram.
For further information, please contact:
Media:
Ben Petok
bpetok@argenx.com
Investors:
Alexandra Roy (US)
aroy@argenx.com
Lynn Elton (EU)
lelton@argenx.com
Forward-looking Statements
The contents of this announcement include statements
that are, or may be deemed to be, “forward-looking statements.” These forward-looking statements can be identified by the
use of forward-looking terminology, including the terms “plans,” “aims,” “continues,” “anticipates,”
“expects,” “will,” or “commitment” and include statements argenx makes concerning its utilization
of its learnings and momentum from its gMG launch for a potential CIDP approval and to position VYVGART SC for success; its plans to expand
its patient reach, including through its multidimensional expansion efforts aimed at including patients earlier in the MG treatment paradigm
and pursuing global regulatory approvals for MG as well as additional autoimmune indications; our goal to translate the ADHERE data into
potential benefit for patients; the advancement of, and anticipated clinical development, data readouts and regulatory milestones and
plans, including: (1) expected decisions on regulatory approvals of VYVGART for gMG in Switzerland, Australia, Saudi Arabia and South
Korea by end of 2024, (2) expected decisions on approval of VYVGART SC for gMG in China through Zai Lab by end of 2024, (3) expected decisions
on approval of VYVGART for ITP in Japan in the first quarter of 2024, (4) expected regulatory submissions of VYVGART SC of CIDP in Japan,
Europe, China and Canada in 2024, (5) the expansion of our VYVGART registrational studies into broader MG populations, including in seronegative
patients, expected to start in 2024, (6) the update on pre-filled syringe development expected in the first half of 2024, (7) clinical
studies expected to support potential approval in gMG and CIDP in 2024, (8) expected update on the path forward for BALLAD study in 2024,
(9) expected topline data from Phase 2 RHO in the first half of 2024, (10) expected topline data from Phase 2 ALPHA study in the first
half of 2024, (11) expected topline data from Phase 2/3 ALKIVIA in the second half of 2024, (12) the full Phase 2 topline data from ARDA
study expected in 2024, (13) planned Phase 1b/2a clinical trials of ARGX-119 in 2024, (14) four IND applications expected to be filed
by end of 2025, (15) expected data from six Phase 2 proof-of-concept trials by the end of 2024, and (16) the expected approval or development
in 15 autoimmune indications by 2025; the potential of its continued investment in its IIP to drive long-term sustainable pipeline growth;
its future financial and operating performance, including its anticipated operating expenses and utilization of net cash for 2024; and
our goal of translating immunology breakthroughs into a world-class portfolio of novel antibody-based medicines. By their nature, forward-looking
statements involve risks and uncertainties and readers are cautioned that any such forward-looking statements are not guarantees of future
performance. argenx’s actual results may differ materially from those predicted by the forward-looking statements as a result of
various important factors, including but not limited to, the results of argenx’s clinical trials, expectations regarding the inherent
uncertainties associated with development of novel drug therapies, preclinical and clinical trial and product development activities and
regulatory approval requirements, the acceptance of our products and product candidates by our patients as safe, effective and cost-effective,
and the impact of governmental laws and regulations on our business. A further list and description of these risks, uncertainties and
other risks can be found in argenx’s U.S. Securities and Exchange Commission (SEC) filings and reports, including in argenx’s
most recent annual report on Form 20-F filed with the SEC as well as subsequent filings and reports filed by argenx with the SEC. Given
these uncertainties, the reader is advised not to place any undue reliance on such forward-looking statements. These forward-looking statements
speak only as of the date of publication of this document. argenx undertakes no obligation to publicly update or revise the information
in this press release, including any forward-looking statements, except as may be required by law.
Exhibit 99.2
| Reaching Patients through
Immunology Innovation
F Y / 4 Q 2 0 2 3 E A R N I N G S C A L L | F E B R U A R Y 2 9 , 2 0 2 4 |
| Forward Looking Statements
• This presentation has been prepared by argenx se (“argenx” or the “company”) for informational purposes only and not for any other purpose. Nothing contained in this presentation is, or
should be construed as, a recommendation, promise or representation by the presenter or the company or any director, employee, agent, or adviser of the company. This presentation does not
purport to be all-inclusive or to contain all of the information you may desire. Certain information contained in this presentation relates to or is based on studies, publications, surveys and other
data obtained from third-party sources and the company’s own internal estimates and research. While argenx believes these third-party studies, publications, surveys and other data to be reliable
as of the date of this presentation, it has not independently verified, and makes no representation as to the adequacy, fairness, accuracy or completeness of, any information obtained from third-party sources. In addition, no independent source has evaluated the reasonableness or accuracy of argenx’s internal estimates or research and no reliance should be made on any information or
statements made in this presentation relating to or based on such internal estimates and research.
•
• Certain statements contained in this presentation, other than present and historical facts and conditions independently verifiable at the date hereof, may constitute forward-looking
statements. These forward-looking statements can be identified by the use of forward-looking terminology, including the terms “plans,” “aims,” “continues,” “anticipates,” “expects,” “will,” or
“commitment” and include statements argenx makes concerning its Immunology Innovation Program and its pipeline, including argenx’s goal to expand technical capabilities through collaboration
with different partners to drive internal and external value creation; the expected approval or development in 15 autoimmune indications by 2025; our plans to maximize the VYVGART opportunity
by its launch strategy success and expanding opportunities for MG; the advancement of, and anticipated clinical development, data readouts and regulatory milestones and plans, including: (1) the
update on pre-filled syringe (“PFS”) development, (2) expected decisions on approval of VYVGART for ITP in Japan in the first quarter of 2024, (3) expected PoC study readouts in 2024 and beyond,
(5) expected regulatory submissions of VYVGART SC of CIDP in 2024, (6) the Full Phase 2 MMN data expected in 2024, (7) the planned Phase 1b/2a clinical trials of ARGX-119 in 2024; its plans to
expand its patient reach, including through its multidimensional expansion efforts aimed at expanding opportunities for MG and pursuing global regulatory approvals for MG; its goal to continue to
drive transformational outcomes for patients and maximize value creation and patient impact by reaching new gMG patients with VYVGART and leveraging MG know-how into future indications;
its future financial and operating performance, including its anticipated operating expenses and cash burn for 2024; its autoimmune market opportunities; its goal to address the unseen suffering
in CIDP; and its commitment to value creation. By their nature, forward-looking statements involve risks and uncertainties and readers are cautioned that any such forward-looking statements are
not guarantees of future performance. argenx’s actual results may differ materially from those predicted by the forward-looking statements as a result of various important factors, including but
not limited to, the results of argenx’s clinical trials, expectations regarding the inherent uncertainties associated with development of novel drug therapies, preclinical and clinical trial and product
development activities and regulatory approval requirements, the acceptance of our products and product candidates by our patients as safe, effective and cost-effective, and the impact of
governmental laws and regulations on our business. A further list and description of these risks, uncertainties and other risks can be found in argenx’s U.S. Securities and Exchange Commission
(SEC) filings and reports, including in argenx’s most recent annual report on Form 20-F filed with the SEC as well as subsequent filings and reports filed by argenx with the SEC. Given these
uncertainties, the reader is advised not to place any undue reliance on such forward-looking statements. These forward-looking statements speak only as of the date of publication of this
document. argenx undertakes no obligation to publicly update or revise the information in this presentation, including any forward-looking statements, except as may be required by law.
•
• This presentation contains trademarks, trade names and service marks of other companies, which are the property of their respective owners.
..
2 |
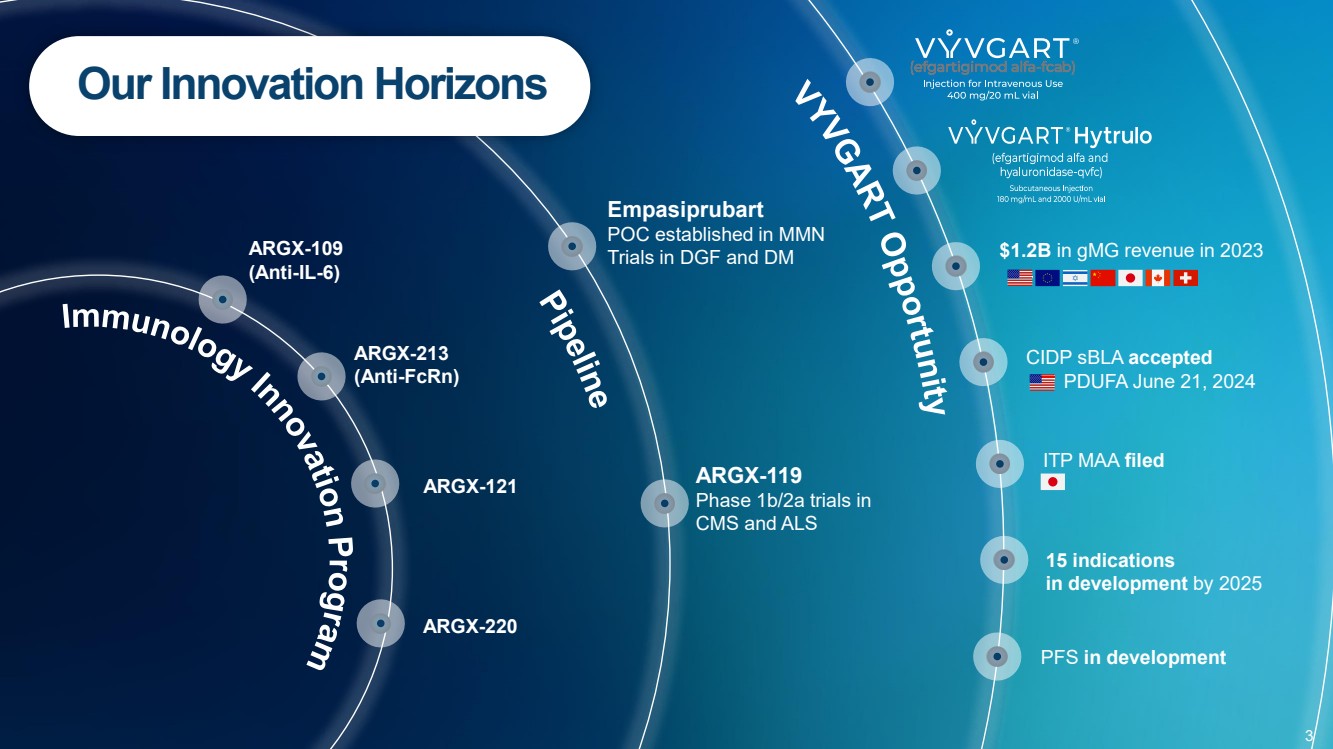
| PFS in development
15 indications
in development by 2025
ITP MAA filed
CIDP sBLA accepted
PDUFA June 21, 2024
ARGX-109 $1.2B in gMG revenue in 2023
(Anti-IL-6)
ARGX-213
(Anti-FcRn)
ARGX-220
ARGX-121
Empasiprubart
POC established in MMN
Trials in DGF and DM
ARGX-119
Phase 1b/2a trials in
CMS and ALS
Our Innovation Horizons
3 |
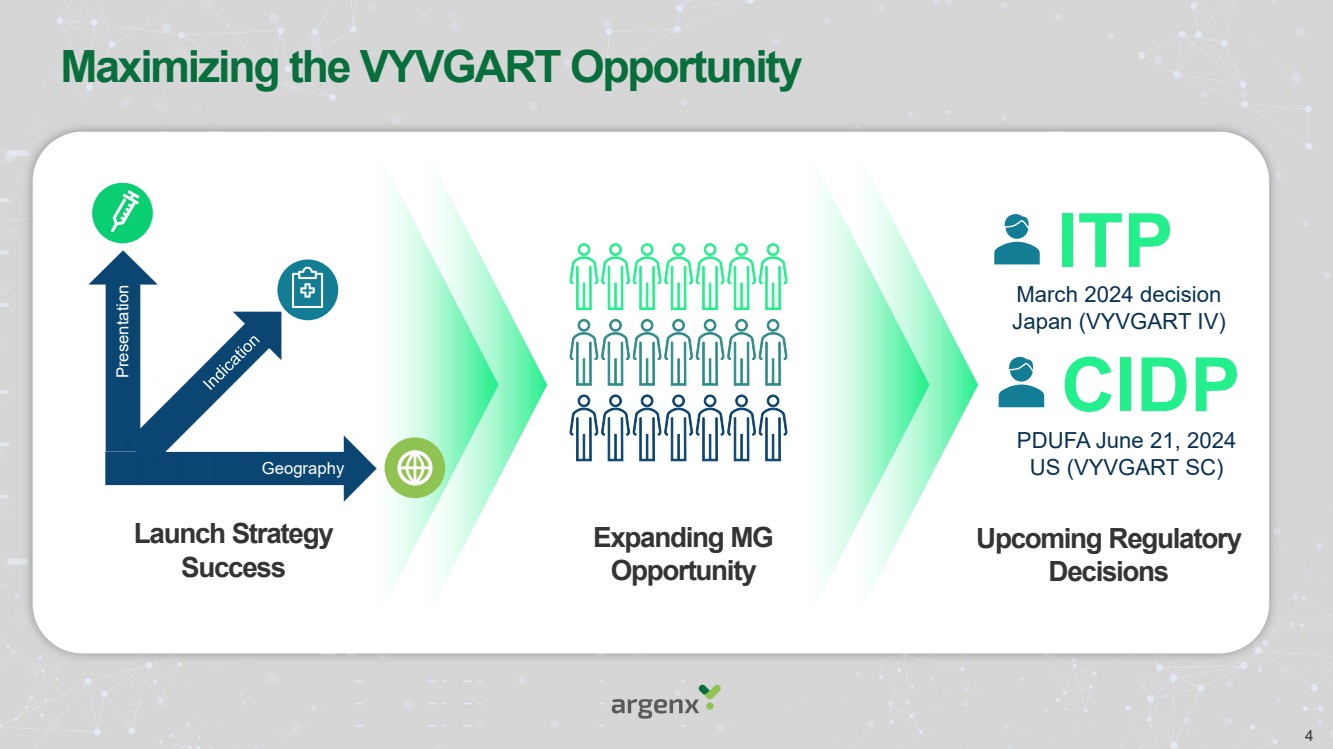
| Maximizing the VYVGART Opportunity
Upcoming Regulatory
Decisions
Expanding MG
Opportunity
Launch Strategy
Success
ITP
CIDP
March 2024 decision
Japan (VYVGART IV)
PDUFA June 21, 2024
Geography US (VYVGART SC)
Presentation
4 |
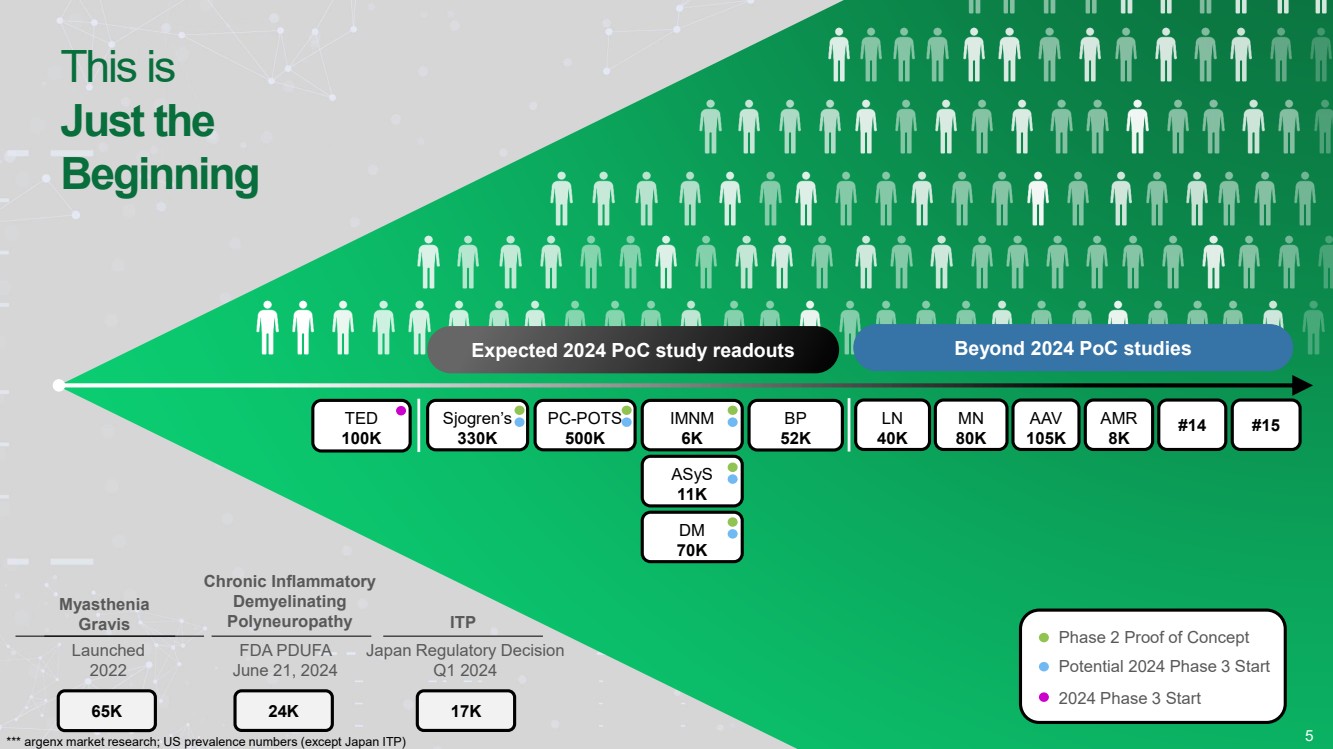
| This is
Just the
Beginning
5
Myasthenia
Gravis
Chronic Inflammatory
Demyelinating
Polyneuropathy
Expected 2024 PoC study readouts
ITP
Launched
2022
FDA PDUFA
June 21, 2024
Japan Regulatory Decision
Q1 2024
TED
100K
IMNM
6K
Sjogren’s
330K
PC-POTS
500K
Beyond 2024 PoC studies
BP
52K
LN
40K
MN
80K
AAV
105K
AMR
8K
Potential 2024 Phase 3 Start
Phase 2 Proof of Concept
65K 24K 17K
2024 Phase 3 Start
ASyS
11K
DM
70K
#14 #15
*** argenx market research; US prevalence numbers (except Japan ITP) |
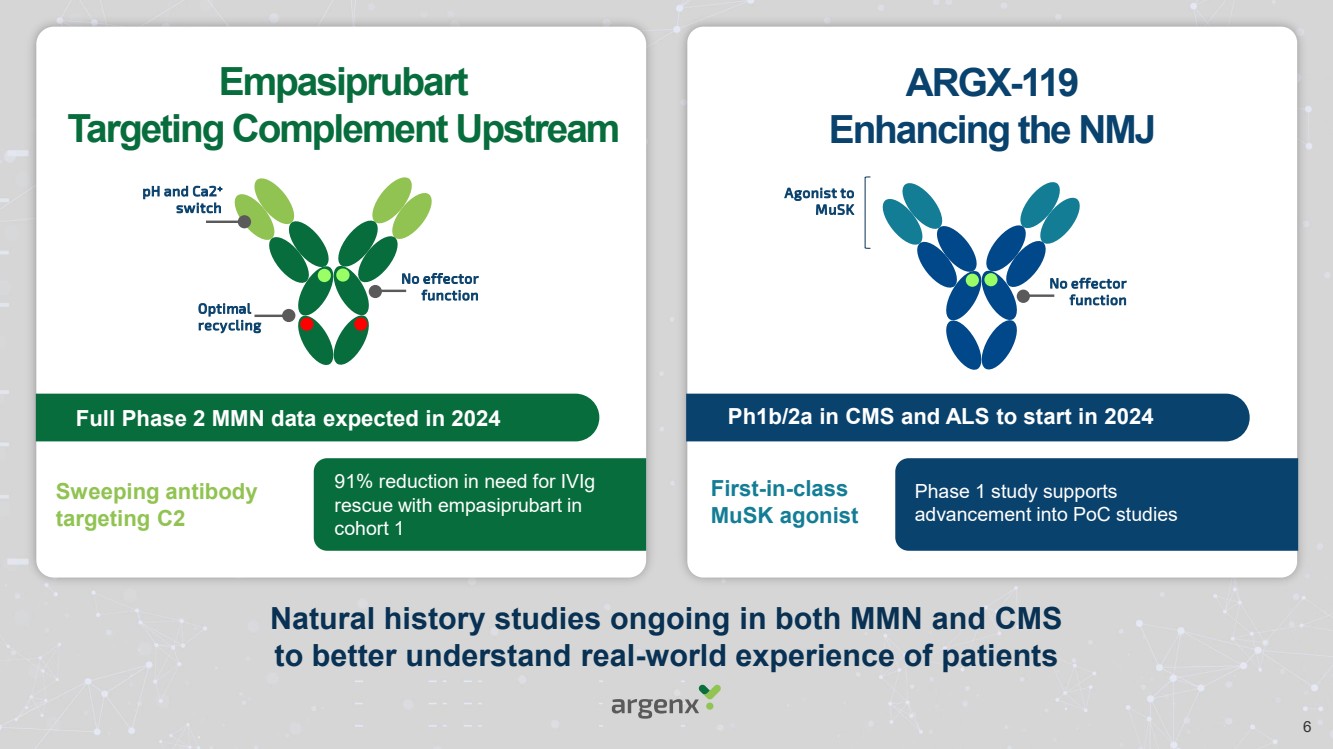
| Empasiprubart
Targeting Complement Upstream
ARGX-119
Enhancing the NMJ
Natural history studies ongoing in both MMN and CMS
to better understand real-world experience of patients
Optimal
recycling
pH and Ca2+
switch
No effector
function
Full Phase 2 MMN data expected in 2024
Agonist to
MuSK
No effector
function
Ph1b/2a in CMS and ALS to start in 2024
Sweeping antibody
targeting C2
First-in-class
MuSK agonist
91% reduction in need for IVIg
rescue with empasiprubart in
cohort 1
Phase 1 study supports
advancement into PoC studies
6 |
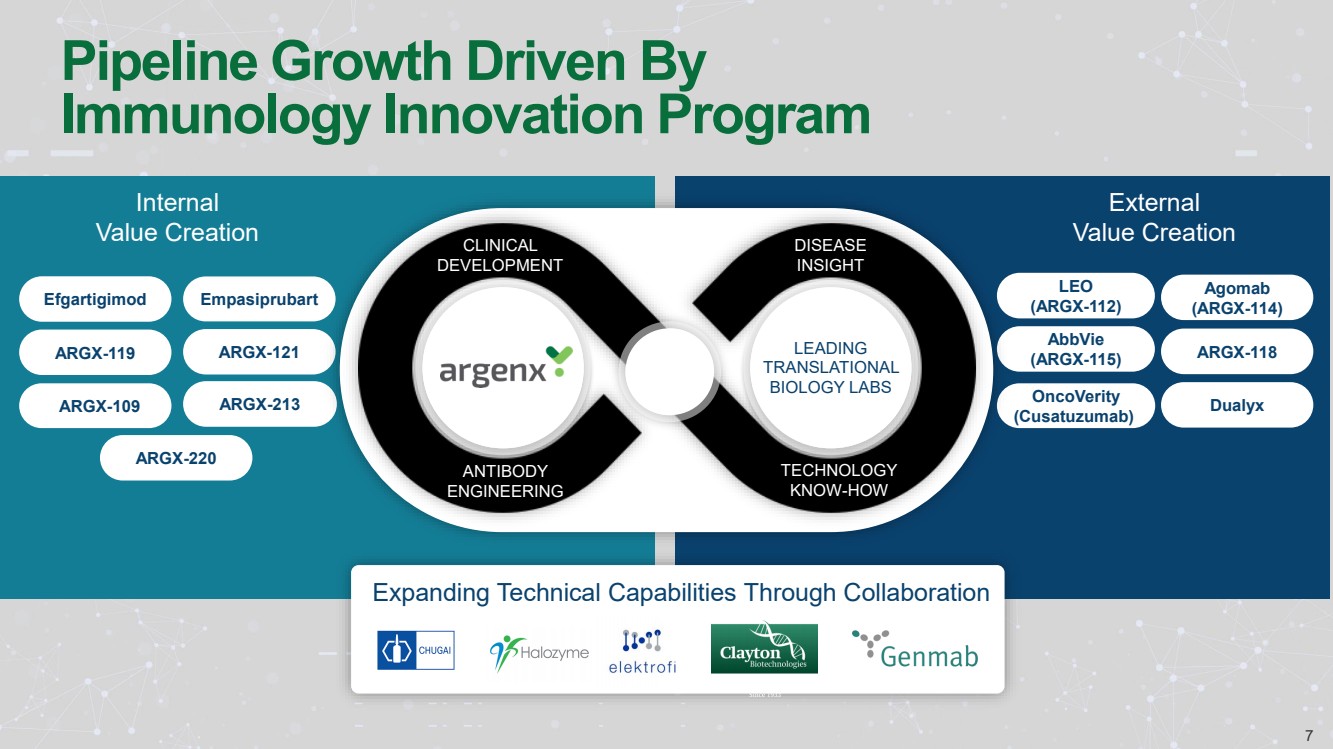
| Efgartigimod
ARGX-119
Empasiprubart
Internal
Value Creation
External
Value Creation
OncoVerity
(Cusatuzumab)
LEO
(ARGX-112)
ARGX-109
AbbVie
(ARGX-115) ARGX-118
Agomab
(ARGX-114)
Dualyx
Pipeline Growth Driven By
Immunology Innovation Program
ARGX-213
ARGX-121
ARGX-220
Expanding Technical Capabilities Through Collaboration
DISEASE
INSIGHT
ANTIBODY
ENGINEERING
CLINICAL
DEVELOPMENT
LEADING
TRANSLATIONAL
BIOLOGY LABS
TECHNOLOGY
KNOW-HOW
7 |
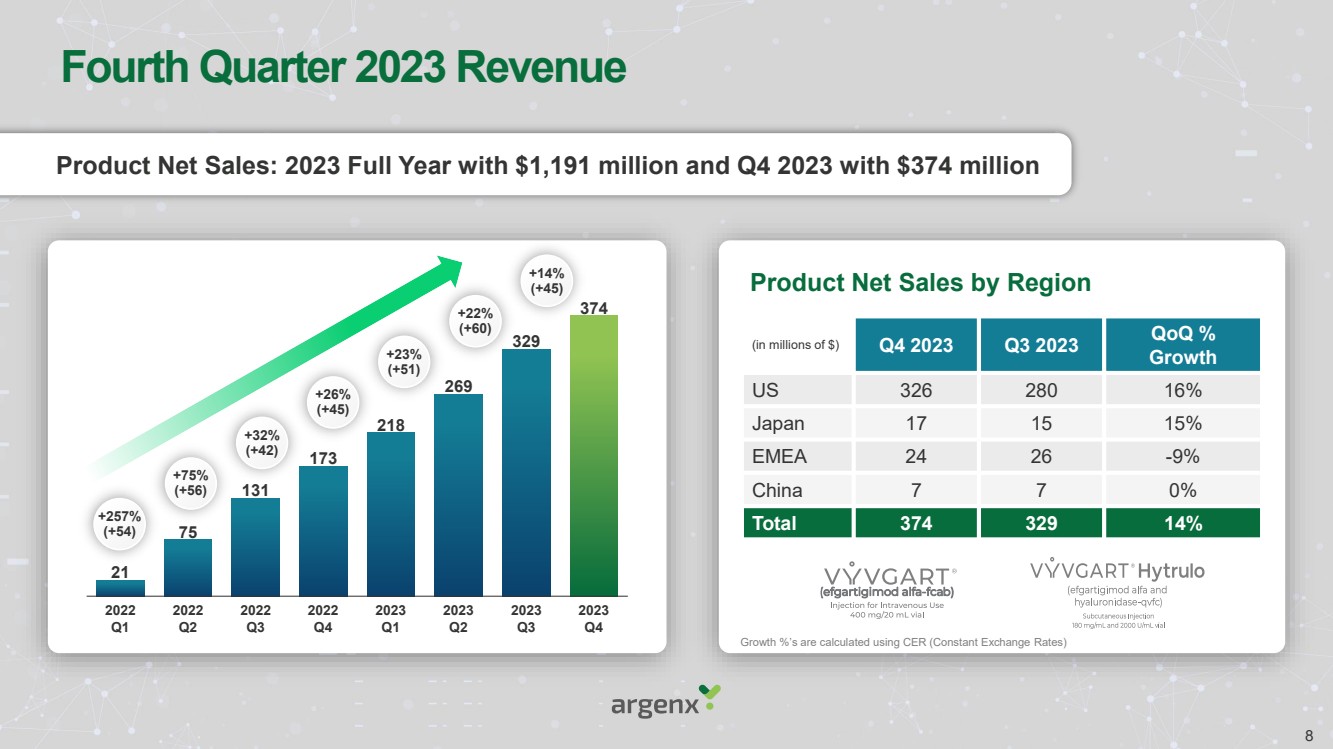
| Fourth Quarter 2023 Revenue
Product Net Sales: 2023 Full Year with $1,191 million and Q4 2023 with $374 million
21
75
131
173
218
269
329
374
2022
Q2
2022
Q3
2022
Q4
2023
Q1
2023
Q4
2023
Q3
2023
Q2
2022
Q1
+257%
(+54)
+75%
(+56)
+32%
(+42)
+26%
(+45)
+23%
(+51)
+22%
(+60)
+14%
(+45)
(in millions of $) Q4 2023 Q3 2023 QoQ %
Growth
US 326 280 16%
Japan 17 15 15%
EMEA 24 26 -9%
China 7 7 0%
Total 374 329 14%
Product Net Sales by Region
Growth %’s are calculated using CER (Constant Exchange Rates)
8 |
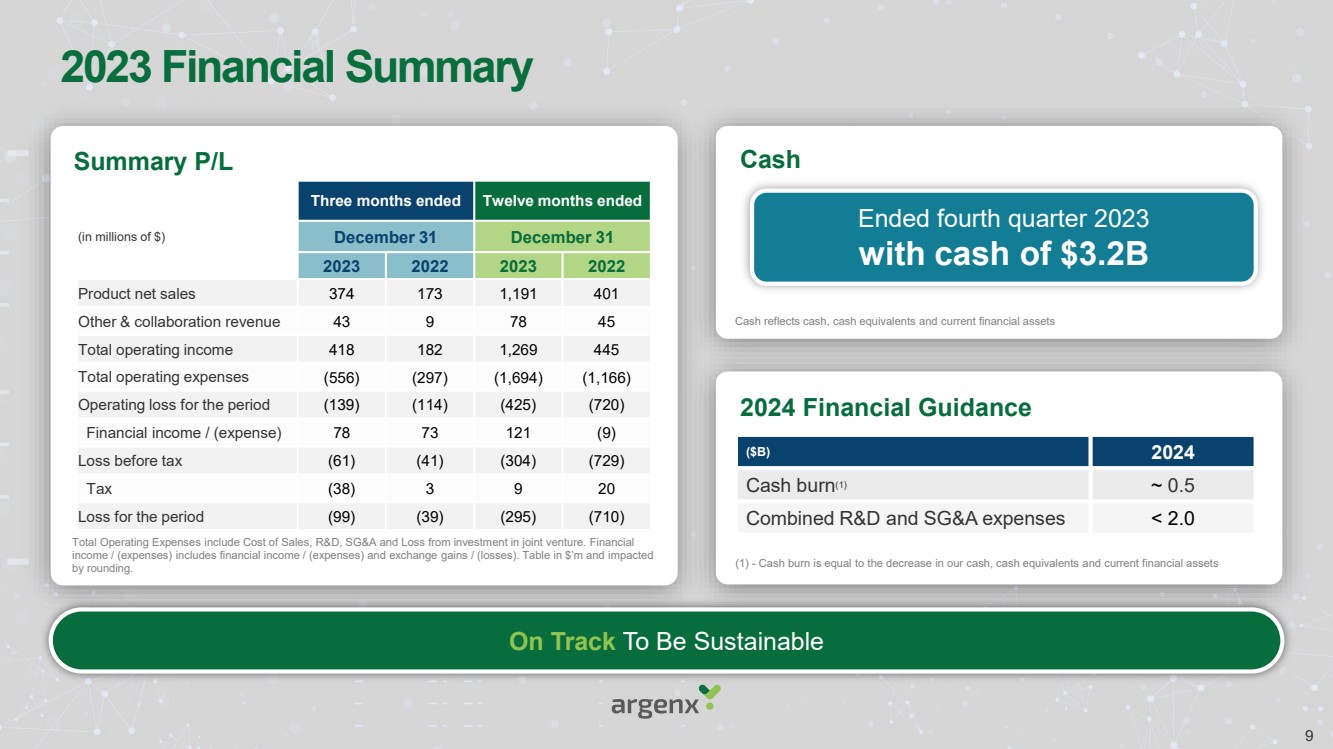
| 2023 Financial Summary
2024 Financial Guidance
($B) 2024
Cash burn(1) ~ 0.5
Combined R&D and SG&A expenses < 2.0
(1) - Cash burn is equal to the decrease in our cash, cash equivalents and current financial assets
Three months ended Twelve months ended
(in millions of $) December 31 December 31
2023 2022 2023 2022
Product net sales 374 173 1,191 401
Other & collaboration revenue 43 9 78 45
Total operating income 418 182 1,269 445
Total operating expenses (556) (297) (1,694) (1,166)
Operating loss for the period (139) (114) (425) (720)
Financial income / (expense) 78 73 121 (9)
Loss before tax (61) (41) (304) (729)
Tax (38) 3 9 20
Loss for the period (99) (39) (295) (710)
Summary P/L
Cash reflects cash, cash equivalents and current financial assets
Total Operating Expenses include Cost of Sales, R&D, SG&A and Loss from investment in joint venture. Financial
income / (expenses) includes financial income / (expenses) and exchange gains / (losses). Table in $’m and impacted
by rounding.
Ended fourth quarter 2023
with cash of $3.2B
Cash
On Track To Be Sustainable
9 |

| Continuing
to drive
transformational
outcomes for
patients
Alexis, VYVGART Patient
Reaching new gMG
patients with VYVGART
Leveraging MG know-how into
future indications
Maximizing value
creation and patient impact |
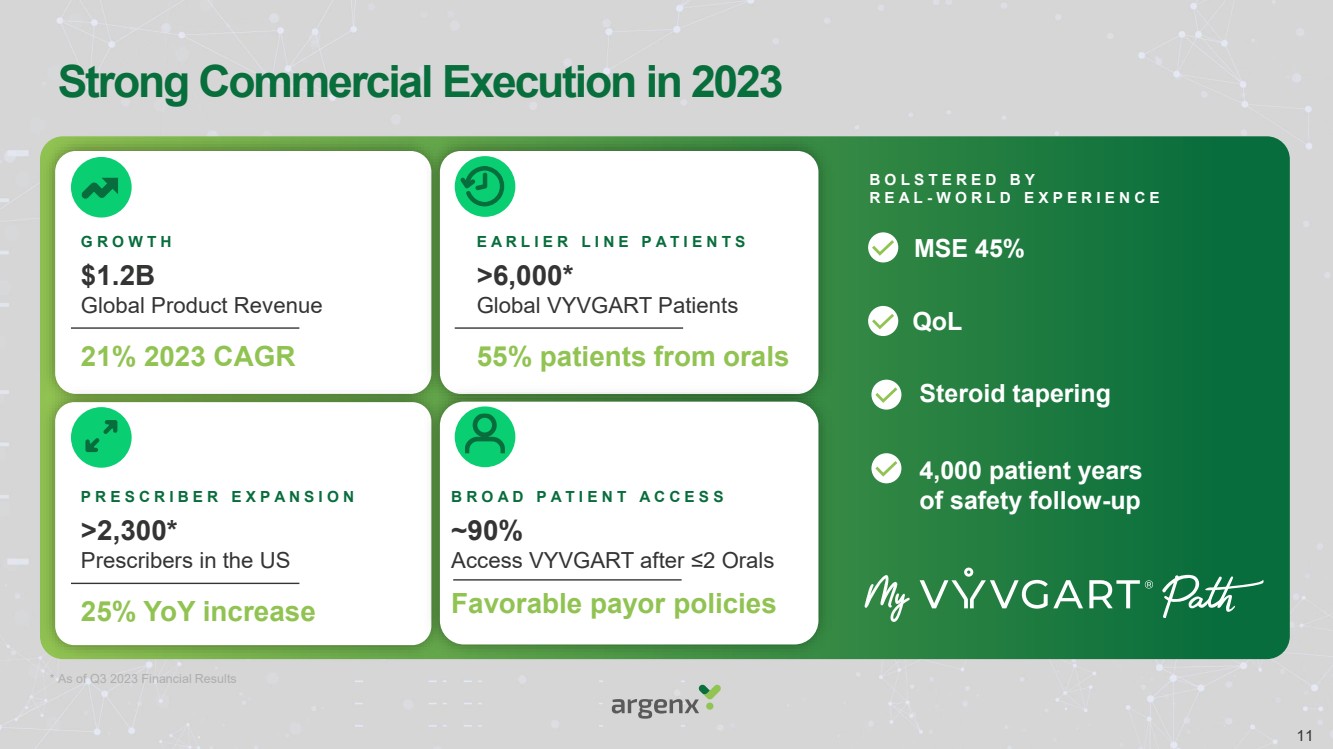
| Strong Commercial Execution in 2023
21% 2023 CAGR
$1.2B
Global Product Revenue
G R O W T H
* As of Q3 2023 Financial Results
B O L S T E R E D B Y
R E A L - W O R L D E X P E R I E N C E
MSE 45%
55% patients from orals
>6,000*
Global VYVGART Patients
E A R L I E R L I N E P A T I E N T S
25% YoY increase
>2,300*
Prescribers in the US
P R E S C R I B E R E X P A N S I O N
Favorable payor policies
~90%
Access VYVGART after ≤2 Orals
B R O A D P A T I E N T A C C E S S
QoL
Steroid tapering
4,000 patient years
of safety follow-up
11 |
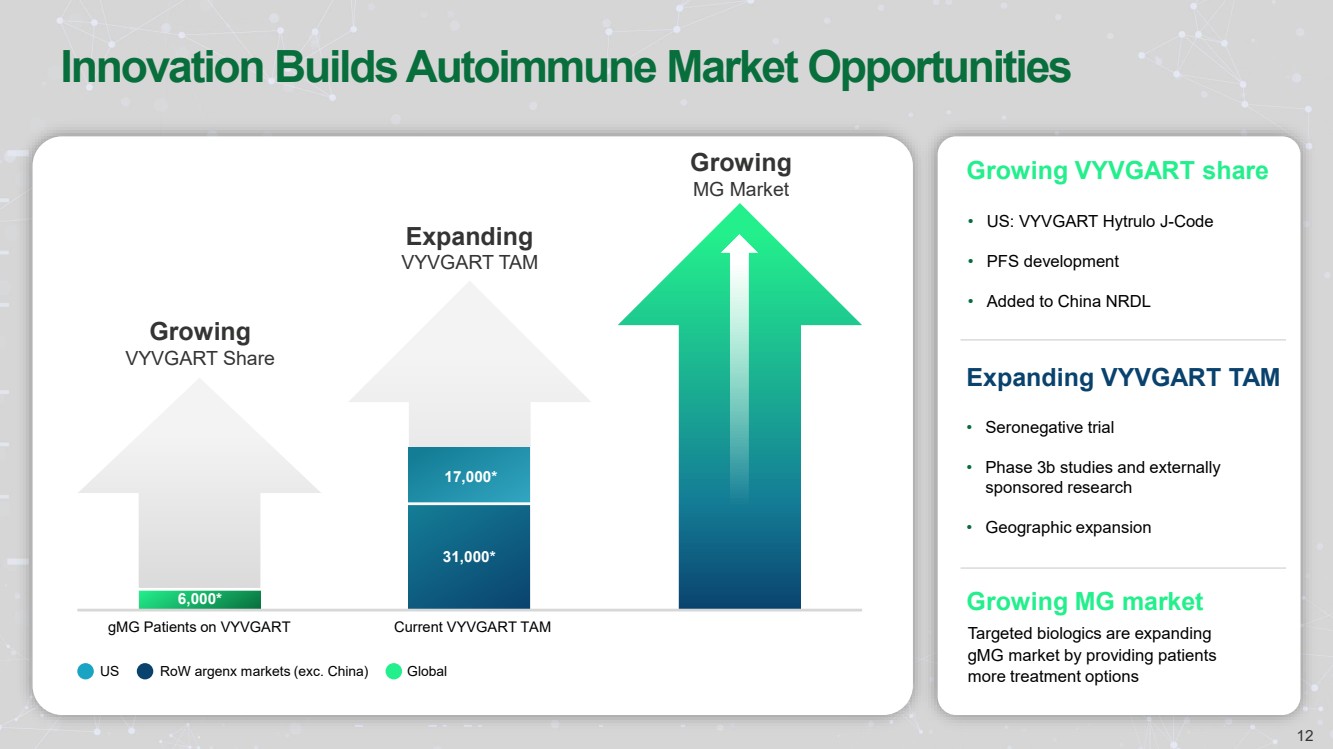
| Innovation Builds Autoimmune Market Opportunities
Growing
MG Market
gMG Patients on VYVGART Current VYVGART TAM
Expanding
VYVGART TAM
Growing
VYVGART Share
US RoW argenx markets (exc. China) Global
Growing VYVGART share
• US: VYVGART Hytrulo J-Code
• PFS development
• Added to China NRDL
Expanding VYVGART TAM
Growing MG market
Targeted biologics are expanding
gMG market by providing patients
more treatment options
6,000*
31,000*
17,000*
• Seronegative trial
• Phase 3b studies and externally
sponsored research
• Geographic expansion
12 |
| CONFIDENTIAL FOR INTERNAL USE ONLY. © 2023 argenx.
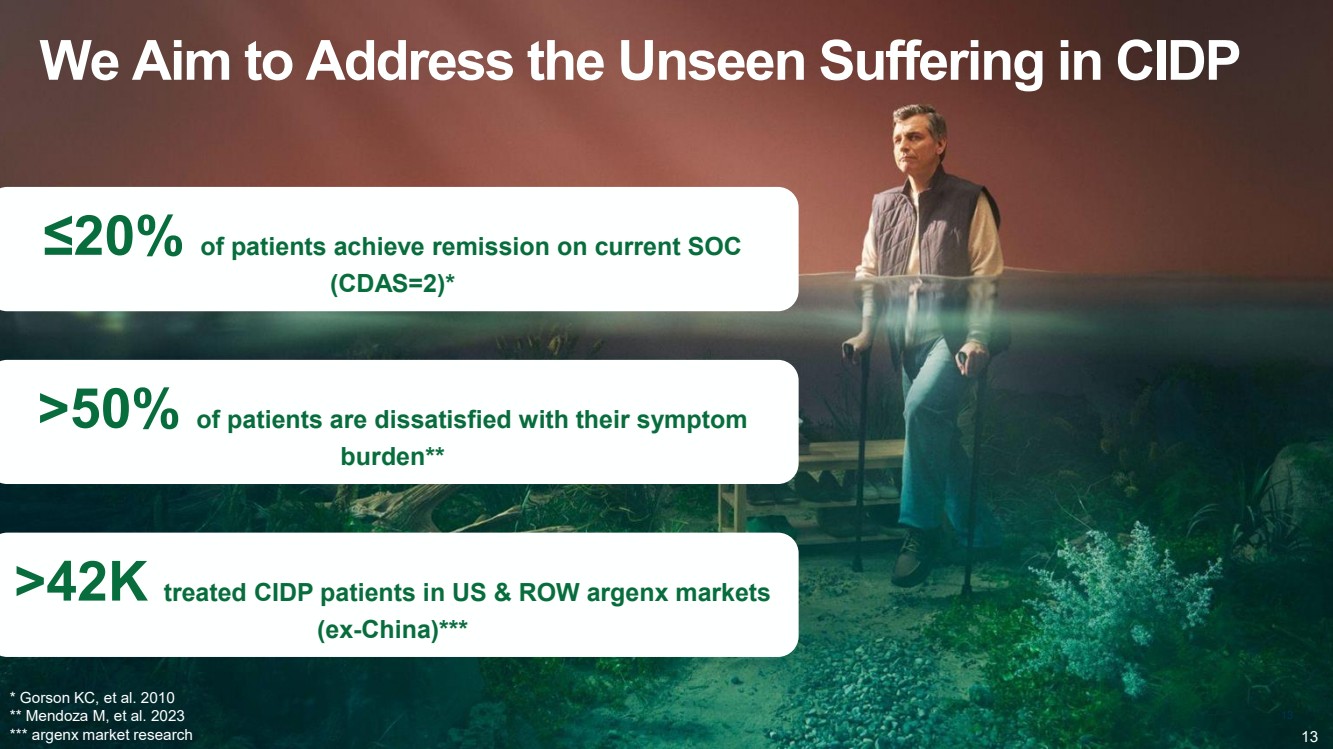
We Aim to Address the Unseen Suffering in CIDP
≤20% of patients achieve remission on current SOC
(CDAS=2)*
>50% of patients are dissatisfied with their symptom
burden**
>42K treated CIDP patients in US & ROW argenx markets
(ex-China)***
* Gorson KC, et al. 2010
** Mendoza M, et al. 2023
*** argenx market research
13
13 |

| Caitlin, MG patient Generating Disease Awareness
Long
-term commitment to
repeatable, sustainable and
comprehensive value creation
Maximizing patient
impact through our
commercial organization
Driving Innovation on Patient Experience
Providing Broad and Simple Access
Elevating Expectations for Treatment
14 |
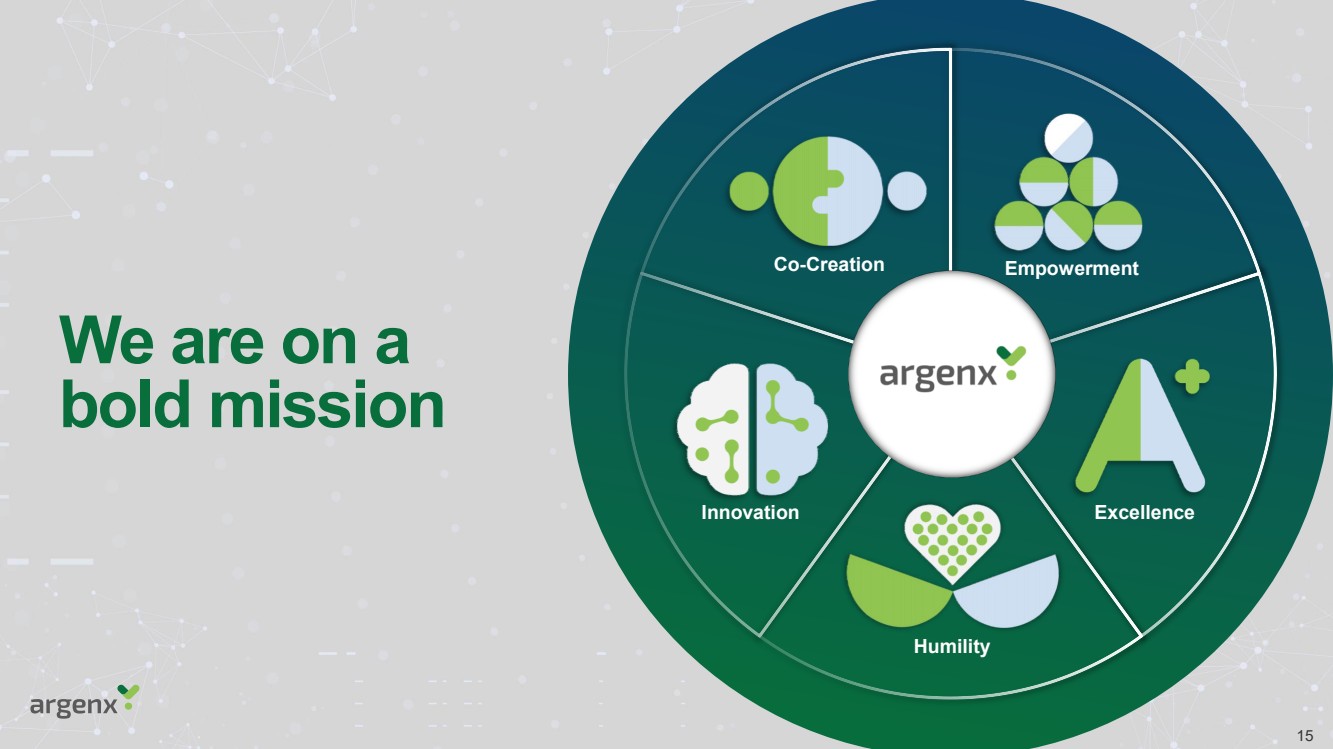
| We are on a
bold mission
Humility
Innovation Excellence
Co-Creation Empowerment
15 |
Exhibit 99.3
ARGENX SE
CONSOLIDATED STATEMENTS OF FINANCIAL POSITION
| | |
As of | |
| | |
December 31, | |
| (in thousands of $) | |
2023 | | |
2022 | | |
2021 | |
| ASSETS | |
| | | |
| | | |
| | |
| Non-current assets | |
| | | |
| | | |
| | |
| Property, plant and equipment | |
$ | 22,675 | | |
$ | 16,234 | | |
$ | 15,844 | |
| Intangible assets | |
| 125,228 | | |
| 174,901 | | |
| 171,684 | |
| Deferred tax asset | |
| 97,211 | | |
| 79,222 | | |
| 32,191 | |
| Research and development incentive receivables | |
| 76,706 | | |
| 47,488 | | |
| 32,707 | |
| Investment in joint venture | |
| 9,912 | | |
| 1,323 | | |
| — | |
| Prepaid expenses | |
| 47,327 | | |
| — | | |
| — | |
| Other non-current assets | |
| 39,662 | | |
| 40,894 | | |
| 54,876 | |
| Total non-current assets | |
| 418,721 | | |
| 360,064 | | |
| 307,303 | |
| | |
| | | |
| | | |
| | |
| Current assets | |
| | | |
| | | |
| | |
| Inventories | |
$ | 310,550 | | |
$ | 228,353 | | |
$ | 109,076 | |
| Prepaid expenses | |
| 134,072 | | |
| 76,022 | | |
| 58,946 | |
| Trade and other receivables | |
| 496,687 | | |
| 275,697 | | |
| 38,221 | |
| Research and development incentive receivables | |
| 2,584 | | |
| 1,578 | | |
| — | |
| Financial assets | |
| 1,131,000 | | |
| 1,391,808 | | |
| 1,002,052 | |
| Cash and cash equivalents | |
| 2,048,844 | | |
| 800,740 | | |
| 1,334,676 | |
| Total current assets | |
| 4,123,737 | | |
| 2,774,197 | | |
| 2,542,971 | |
| | |
| | | |
| | | |
| | |
| TOTAL ASSETS | |
$ | 4,542,458 | | |
$ | 3,134,261 | | |
$ | 2,850,274 | |
| | |
As of | |
| | |
December 31, | |
| (in thousands of $) | |
2023 | | |
2022 | | |
2021 | |
| EQUITY AND LIABILITIES | |
| | | |
| | | |
| | |
| Equity | |
| | | |
| | | |
| | |
| Equity attributable to owners of the parent | |
| | | |
| | | |
| | |
| Share capital | |
$ | 7,058 | | |
$ | 6,640 | | |
$ | 6,233 | |
| Share premium | |
| 5,651,497 | | |
| 4,309,880 | | |
| 3,462,775 | |
| Translation differences | |
| 131,543 | | |
| 129,280 | | |
| 131,684 | |
| Accumulated losses | |
| (2,404,844 | ) | |
| (2,109,791 | ) | |
| (1,400,197 | ) |
| Other reserves | |
| 712,253 | | |
| 477,691 | | |
| 333,729 | |
| Total equity | |
$ | 4,097,507 | | |
$ | 2,813,699 | | |
$ | 2,534,224 | |
| | |
| | | |
| | | |
| | |
| Non-current liabilities | |
| | | |
| | | |
| | |
| Provisions for employee benefits | |
| 1,449 | | |
| 870 | | |
| 417 | |
| Lease liabilities | |
| 15,354 | | |
| 9,009 | | |
| 7,956 | |
| Deferred tax liabilities | |
| 5,155 | | |
| 8,406 | | |
| 6,438 | |
| Total non-current liabilities | |
| 21,958 | | |
| 18,285 | | |
| 14,811 | |
| | |
| | | |
| | | |
| | |
| Current liabilities | |
| | | |
| | | |
| | |
| Lease liabilities | |
| 4,646 | | |
| 3,417 | | |
| 3,509 | |
| Trade and other payables | |
| 414,013 | | |
| 295,679 | | |
| 293,415 | |
| Tax liabilities | |
| 4,334 | | |
| 3,181 | | |
| 4,315 | |
| Total current liabilities | |
| 422,993 | | |
| 302,277 | | |
| 301,239 | |
| | |
| | | |
| | | |
| | |
| Total liabilities | |
$ | 444,951 | | |
$ | 320,562 | | |
$ | 316,050 | |
| | |
| | | |
| | | |
| | |
| TOTAL EQUITY AND LIABILITIES | |
$ | 4,542,458 | | |
$ | 3,134,261 | | |
$ | 2,850,274 | |
ARGENX SE
CONSOLIDATED STATEMENTS OF PROFIT OR LOSS
| | |
Year Ended | |
| | |
December 31, | |
| (in thousands of $ except for shares and EPS) | |
2023 | | |
2022 | | |
2021 | |
| Product net sales | |
$ | 1,190,783 | | |
$ | 400,720 | | |
$ | — | |
| Collaboration revenue | |
| 35,533 | | |
| 10,026 | | |
| 497,277 | |
| Other operating income | |
| 42,278 | | |
| 34,520 | | |
| 42,141 | |
| Total operating income | |
| 1,268,594 | | |
| 445,267 | | |
| 539,418 | |
| | |
| | | |
| | | |
| | |
| Cost of sales | |
| (117,835 | ) | |
| (29,431 | ) | |
| — | |
| Research and development expenses | |
| (859,492 | ) | |
| (663,366 | ) | |
| (580,520 | ) |
| Selling, general and administrative expenses | |
| (711,905 | ) | |
| (472,132 | ) | |
| (307,644 | ) |
| Loss from investment in joint venture | |
| (4,411 | ) | |
| (677 | ) | |
| — | |
| Total operating expenses | |
| (1,693,643 | ) | |
| (1,165,607 | ) | |
| (888,164 | ) |
| | |
| | | |
| | | |
| | |
| Operating loss | |
$ | (425,049 | ) | |
$ | (720,341 | ) | |
$ | (348,746 | ) |
| | |
| | | |
| | | |
| | |
| Financial income | |
| 107,386 | | |
| 27,665 | | |
| 3,633 | |
| Financial expense | |
| (906 | ) | |
| (3,906 | ) | |
| (4,578 | ) |
| Exchange gains/(losses) | |
| 14,073 | | |
| (32,732 | ) | |
| (50,053 | ) |
| | |
| | | |
| | | |
| | |
| Loss for the year before taxes | |
$ | (304,496 | ) | |
$ | (729,314 | ) | |
$ | (399,743 | ) |
| Income tax benefit / (expense) | |
$ | 9,443 | | |
$ | 19,720 | | |
$ | (8,522 | ) |
| Loss for the year | |
$ | (295,053 | ) | |
$ | (709,594 | ) | |
$ | (408,265 | ) |
| Loss for the year attributable to: | |
| | | |
| | | |
| | |
| Owners of the parent | |
| (295,053 | ) | |
$ | (709,594 | ) | |
$ | (408,265 | ) |
| Weighted average number of shares outstanding | |
| 57,169,253 | | |
| 54,381,371 | | |
| 51,075,827 | |
| Basic and diluted (loss) per share (in $) | |
| (5.16 | ) | |
| (13.05 | ) | |
| (7.99 | ) |
ARGENX SE
CONSOLIDATED
STATEMENTS OF COMPREHENSIVE INCOME (LOSS)
| | |
Year Ended | |
| | |
December 31, | |
| (in thousands of $) | |
2023 | | |
2022 | | |
2021 | |
| Loss for the year | |
$ | (295,053 | ) | |
$ | (709,594 | ) | |
$ | (408,265 | ) |
| | |
| | | |
| | | |
| | |
| Items that may be reclassified subsequently to profit or loss, net of tax | |
| | | |
| | | |
| | |
| Currency translation differences, arisen from translating foreign activities | |
| 2,263 | | |
| (2,404 | ) | |
| (3,048 | ) |
| Items that will not be reclassified subsequently to profit or loss, net of tax | |
| | | |
| | | |
| | |
| Fair value gain/(loss) on investments in equity instruments designated as at FVTOCI | |
| (1,915 | ) | |
| (18,267 | ) | |
| (39,290 | ) |
| | |
| | | |
| | | |
| | |
| Other comprehensive loss, net of income | |
| 348 | | |
| (20,671 | ) | |
| (42,338 | ) |
| | |
| | | |
| | | |
| | |
| Total comprehensive loss attributable to: | |
| | | |
| | | |
| | |
| Owners of the parent | |
$ | (294,705 | ) | |
$ | (730,266 | ) | |
$ | (450,603 | ) |
ARGENX SE
CONSOLIDATED STATEMENTS OF CASH FLOWS
| | |
Year Ended | |
| | |
December 31, | |
| (in thousands of $) | |
2023 | | |
2022 | | |
2021 | |
| Operating loss | |
$ | (425,049 | ) | |
$ | (720,341 | ) | |
$ | (348,746 | ) |
| Adjustments for non-cash items | |
| | | |
| | | |
| | |
| Amortization of intangible assets | |
| 105,674 | | |
| 99,766 | | |
| 776 | |
| Depreciation of property, plant and equipment | |
| 5,633 | | |
| 4,576 | | |
| 5,091 | |
| Provisions for employee benefits | |
| 573 | | |
| 459 | | |
| 260 | |
| Expense recognized in respect of share-based payments | |
| 232,974 | | |
| 157,026 | | |
| 179,366 | |
| Fair value gains on financial assets at fair value through profit or loss | |
| — | | |
| (4,256 | ) | |
| (11,152 | ) |
| Non-cash revenue | |
| — | | |
| — | | |
| (75,000 | ) |
| Loss from investment in joint venture | |
| 4,411 | | |
| 677 | | |
| — | |
| Other non-cash expenses | |
| 2,074 | | |
| — | | |
| — | |
| | |
$ | (73,710 | ) | |
$ | (462,093 | ) | |
$ | (249,405 | ) |
| Movements in current assets/liabilities | |
| | | |
| | | |
| | |
| (Increase)/decrease in trade and other receivables | |
| (185,694 | ) | |
| (222,260 | ) | |
| (31,632 | ) |
| (Increase)/decrease in inventories | |
| (83,030 | ) | |
| (119,277 | ) | |
| (83,880 | ) |
| (Increase)/decrease in other current assets | |
| (59,024 | ) | |
| (18,294 | ) | |
| (30,990 | ) |
| Increase/(decrease) in trade and other payables | |
| 95,600 | | |
| 329 | | |
| 134,892 | |
| Increase/(decrease) in deferred revenue — current | |
| — | | |
| — | | |
| (46,327 | ) |
| Movements in non-current assets/liabilities | |
| | | |
| | | |
| | |
| (Increase)/decrease in other non-current assets | |
| (29,416 | ) | |
| (16,220 | ) | |
| (13,975 | ) |
| (Increase)/decrease in non-current prepaid expense | |
| (47,327 | ) | |
| — | | |
| — | |
| Increase/(decrease) in deferred revenue — non-current | |
| — | | |
| — | | |
| (269,039 | ) |
| | |
| | | |
| | | |
| | |
| Net cash flows used in operating activities | |
| (382,601 | ) | |
| (837,815 | ) | |
| (590,356 | ) |
| | |
| | | |
| | | |
| | |
| Interest paid | |
| (211 | ) | |
| (851 | ) | |
| (684 | ) |
| Income taxes paid | |
| (37,515 | ) | |
| (24,141 | ) | |
| (15,772 | ) |
| | |
| | | |
| | | |
| | |
| Net cash flows used in operating activities | |
$ | (420,327 | ) | |
$ | (862,807 | ) | |
$ | (606,812 | ) |
| | |
| | | |
| | | |
| | |
| Purchase of intangible assets | |
| (43,000 | ) | |
| (102,986 | ) | |
| (117,811 | ) |
| Purchase of property, plant and equipment | |
| (812 | ) | |
| (837 | ) | |
| (3,623 | ) |
| (Increase)/decrease in current financial assets | |
| — | | |
| — | | |
| (228,239 | ) |
| Purchase of current financial investments | |
| (1,271,730 | ) | |
| (1,694,046 | ) | |
| — | |
| Sale of current financial investments | |
| 1,543,999 | | |
| 1,325,540 | | |
| — | |
| Interest received | |
| 92,753 | | |
| 13,146 | | |
| 2,603 | |
| Investment in joint venture | |
| (13,000 | ) | |
| (2,000 | ) | |
| — | |
| | |
| | | |
| | | |
| | |
| Net cash flows (used in) / from investing activities | |
$ | 308,210 | | |
$ | (461,184 | ) | |
$ | (347,070 | ) |
| | |
| | | |
| | | |
| | |
| Principal elements of lease payments | |
| (3,801 | ) | |
| (4,165 | ) | |
| (3,855 | ) |
| Proceeds from issue of new shares, gross amount | |
| 1,196,731 | | |
| 760,953 | | |
| 1,091,326 | |
| Issue costs paid | |
| (821 | ) | |
| (781 | ) | |
| (528 | ) |
| Exchange gain/(losses) from currency conversion on proceeds from issue of new shares | |
| (1,507 | ) | |
| 410 | | |
| 966 | |
| Payment of employee withholding taxes relating to restricted stock unit awards | |
| (12,138 | ) | |
| (5,855 | ) | |
| — | |
| Proceeds from exercise of stock options | |
| 158,263 | | |
| 93,195 | | |
| 33,433 | |
| | |
| | | |
| | | |
| | |
| Net cash flows from financing activities | |
$ | 1,336,727 | | |
$ | 843,757 | | |
$ | 1,121,342 | |
| | |
| | | |
| | | |
| | |
| Increase/decrease (-) in cash and cash equivalents | |
$ | 1,224,610 | | |
$ | (480,234 | ) | |
$ | 167,460 | |
| | |
| | | |
| | | |
| | |
| Cash and cash equivalents at the beginning of the period | |
$ | 800,740 | | |
$ | 1,334,676 | | |
$ | 1,216,803 | |
| Exchange gains/(losses) on cash and cash equivalents | |
$ | 23,494 | | |
$ | (53,702 | ) | |
$ | (49,587 | ) |
| Cash and cash equivalents at the end of the period | |
$ | 2,048,844 | | |
$ | 800,740 | | |
$ | 1,334,676 | |
ARGENX SE
CONSOLIDATED STATEMENTS OF CHANGES IN EQUITY
| | |
Attributable to owners of the parent | |
| | |
| | |
| | |
| | |
| | |
Share-based | | |
| | |
Total | | |
| |
| | |
| | |
| | |
| | |
| | |
payment and | | |
| | |
equity | | |
| |
| | |
| | |
| | |
| | |
| | |
income tax | | |
Fair
value movement on | | |
attributable | | |
| |
| | |
| | |
| | |
| | |
| | |
deduction on | | |
investment
in equity | | |
to owners | | |
| |
| | |
Share | | |
Share | | |
Accumulated | | |
Translation | | |
share-based | | |
instruments
designated | | |
of the | | |
Total | |
| (in thousands
of $) | |
capital | | |
premium | | |
losses | | |
differences | | |
payments | | |
as
at FVTOCI | | |
parent | | |
equity | |
| Balance
at January 1, 2021 | |
$ | 5,744 | | |
$ | 2,339,033 | | |
$ | (991,932 | ) | |
$ | 134,732 | | |
$ | 186,474 | | |
$ | — | | |
$ | 1,674,051 | | |
$ | 1,674,051 | |
| | |
| | | |
| | | |
| | | |
| | | |
| | | |
| | | |
| | | |
| | |
| Loss for the year | |
| | | |
| | | |
| (408,265 | ) | |
| | | |
| | | |
| | | |
| (408,265 | ) | |
| (408,265 | ) |
| Other comprehensive income / (loss) | |
| | | |
| | | |
| | | |
| (3,048 | ) | |
| | | |
| (39,290 | ) | |
| (42,338 | ) | |
| (42,338 | ) |
| Total comprehensive income
/ (loss) for the year | |
| | | |
| | | |
| (408,265 | ) | |
| (3,048 | ) | |
| | | |
| (39,290 | ) | |
| (450,603 | ) | |
| (450,603 | ) |
| Income tax benefit from excess
tax deductions related to share-based payments | |
| | | |
| | | |
| | | |
| | | |
| 7,179 | | |
| | | |
| 7,179 | | |
| 7,179 | |
| Share-based payment | |
| | | |
| | | |
| | | |
| | | |
| 179,366 | | |
| | | |
| 179,366 | | |
| 179,366 | |
| Issue of share capital | |
| 430 | | |
| 1,090,896 | | |
| | | |
| | | |
| | | |
| | | |
| 1,091,326 | | |
| 1,091,326 | |
| Transaction costs for equity issue | |
| | | |
| (528 | ) | |
| | | |
| | | |
| | | |
| | | |
| (528 | ) | |
| (528 | ) |
| Exercise of stock options | |
| 59 | | |
| 33,374 | | |
| | | |
| | | |
| | | |
| | | |
| 33,433 | | |
| 33,433 | |
| | |
| | | |
| | | |
| | | |
| | | |
| | | |
| | | |
| | | |
| | |
| Balance year ended December
31, 2021 | |
$ | 6,233 | | |
$ | 3,462,775 | | |
$ | (1,400,197 | ) | |
$ | 131,684 | | |
$ | 373,019 | | |
$ | (39,290 | ) | |
$ | 2,534,224 | | |
$ | 2,534,224 | |
| | |
| | | |
| | | |
| | | |
| | | |
| | | |
| | | |
| | | |
| | |
| Loss for the year | |
| | | |
| | | |
| (709,594 | ) | |
| | | |
| | | |
| | | |
| (709,594 | ) | |
| (709,594 | ) |
| Other comprehensive income / (loss) | |
| | | |
| | | |
| | | |
| (2,404 | ) | |
| | | |
| (18,267 | ) | |
| (20,671 | ) | |
| (20,671 | ) |
| Total comprehensive income
/ (loss) for the year | |
| | | |
| | | |
| (709,594 | ) | |
| (2,404 | ) | |
| | | |
| (18,267 | ) | |
| (730,266 | ) | |
| (730,266 | ) |
| Income tax benefit from excess
tax deductions related to share-based payments | |
| | | |
| | | |
| | | |
| | | |
| 3,946 | | |
| | | |
| 3,946 | | |
| 3,946 | |
| Share-based payment | |
| | | |
| | | |
| | | |
| | | |
| 158,282 | | |
| | | |
| 158,282 | | |
| 158,282 | |
| Issue of share capital | |
| 294 | | |
| 760,659 | | |
| | | |
| | | |
| | | |
| | | |
| 760,953 | | |
| 760,953 | |
| Transaction costs for equity issue | |
| | | |
| (781 | ) | |
| | | |
| | | |
| | | |
| | | |
| (781 | ) | |
| (781 | ) |
| Exercise of stock options | |
| 113 | | |
| 93,082 | | |
| | | |
| | | |
| | | |
| | | |
| 93,195 | | |
| 93,195 | |
| Ordinary shares withheld for payment
of employees’ withholding tax liability | |
| | | |
| (5,855 | ) | |
| | | |
| | | |
| | | |
| | | |
| (5,855 | ) | |
| (5,855 | ) |
| | |
| | | |
| | | |
| | | |
| | | |
| | | |
| | | |
| | | |
| | |
| Balance year ended December
31, 2022 | |
$ | 6,640 | | |
| 4,309,880 | | |
| (2,109,791 | ) | |
| 129,280 | | |
| 535,247 | | |
| (57,557 | ) | |
| 2,813,699 | | |
| 2,813,699 | |
| | |
| | | |
| | | |
| | | |
| | | |
| | | |
| | | |
| | | |
| | |
| Loss for the year | |
| | | |
| | | |
| (295,053 | ) | |
| | | |
| | | |
| | | |
| (295,053 | ) | |
| (295,053 | ) |
| Other comprehensive income / (loss) | |
| | | |
| | | |
| | | |
| 2,263 | | |
| | | |
| (1,915 | ) | |
| 348 | | |
| 348 | |
| Total comprehensive income
/ (loss) for the year | |
| | | |
| | | |
| (295,053 | ) | |
| 2,263 | | |
| | | |
| (1,915 | ) | |
| (294,705 | ) | |
| (294,705 | ) |
| Income tax benefit from excess
tax deductions related to share-based payments | |
| | | |
| | | |
| | | |
| | | |
| 2,310 | | |
| | | |
| 2,310 | | |
| 2,310 | |
| Share-based payment | |
| | | |
| | | |
| | | |
| | | |
| 234,168 | | |
| | | |
| 234,168 | | |
| 234,168 | |
| Issue of share capital | |
| 288 | | |
| 1,196,444 | | |
| | | |
| | | |
| | | |
| | | |
| 1,196,732 | | |
| 1,196,732 | |
| Transaction costs for equity issue | |
| | | |
| (821 | ) | |
| | | |
| | | |
| | | |
| | | |
| (821 | ) | |
| (821 | ) |
| Exercise of stock options | |
| 130 | | |
| 158,133 | | |
| | | |
| | | |
| | | |
| | | |
| 158,263 | | |
| 158,263 | |
| Ordinary shares withheld for payment
of employees’ withholding tax liability | |
| | | |
| (12,139 | ) | |
| | | |
| | | |
| | | |
| | | |
| (12,139 | ) | |
| (12,139 | ) |
| | |
| | | |
| | | |
| | | |
| | | |
| | | |
| | | |
| | | |
| | |
| Balance year ended December
31, 2023 | |
$ | 7,058 | | |
$ | 5,651,497 | | |
$ | (2,404,844 | ) | |
$ | 131,543 | | |
$ | 771,725 | | |
$ | (59,472 | ) | |
$ | 4,097,507 | | |
$ | 4,097,507 | |
argenx (NASDAQ:ARGX)
Historical Stock Chart
From Apr 2024 to May 2024

argenx (NASDAQ:ARGX)
Historical Stock Chart
From May 2023 to May 2024
