false
0001677576
0001677576
2024-02-26
2024-02-26
0001677576
us-gaap:CommonStockMember
2024-02-26
2024-02-26
0001677576
us-gaap:SeriesAPreferredStockMember
2024-02-26
2024-02-26
iso4217:USD
xbrli:shares
iso4217:USD
xbrli:shares
UNITED STATES
SECURITIES AND
EXCHANGE COMMISSION
WASHINGTON,
D.C. 20549
FORM 8-K
CURRENT REPORT
Pursuant to
Section 13 or 15(d)
of the Securities
Exchange Act of 1934
Date of
Report (Date of earliest event reported): February 26, 2024
Innovative Industrial
Properties, Inc.
(Exact name
of registrant as specified in its charter)
| Maryland |
|
001-37949 |
|
81-2963381 |
|
(State or Other Jurisdiction
of Incorporation) |
|
(Commission
File No.) |
|
(I.R.S. Employer
Identification No.) |
1389 Center
Drive, Suite 200
Park City, Utah
84098
(Address of
principal executive offices, including zip code)
Registrant’s
telephone number, including area code: (858) 997-3332
Check the appropriate box below if
the Form 8-K filing is intended to simultaneously satisfy the filing obligation of the registrant under any of the following provisions
(see General Instruction A.2. below):
| ¨ |
Written communications pursuant to Rule 425 under the Securities Act (17 CFR 230.425) |
| ¨ |
Soliciting material pursuant to Rule 14a-12 under the Exchange Act (17 CFR 240.14a-12) |
| ¨ |
Pre-commencement communications pursuant
to Rule 14d-2(b) under the Exchange Act (17 CFR 240.14d-2(b)) |
| ¨ |
Pre-commencement communications pursuant to Rule 13e-4(c) under
the Exchange Act (17 CFR 240.13e-4(c)) |
Indicate
by check mark whether the registrant is an emerging growth company as defined in Rule 405 of the Securities Act of 1933 (§230.405
of this chapter) or Rule 12b-2 of the Securities Exchange Act of 1934 (§240.12b-2 of this chapter). Emerging growth company
¨
If an emerging growth company, indicate by check mark if the
registrant has elected not to use the extended transition period for complying with any new or revised financial accounting standards
provided pursuant to Section 13(a) of the Exchange Act. ¨
Securities Registered pursuant to Section 12(b) of the Act:
| Title of each class |
|
Trading Symbol(s) |
|
Name of each exchange on
which registered |
| Common Stock, par value $0.001 per share |
|
IIPR |
|
New York Stock Exchange |
| Series A Preferred Stock, par value $0.001 per share |
|
IIPR-PA |
|
New York Stock Exchange |
Item 2.02
Results of Operations and Financial Condition.
On
February 26, 2024, Innovative Industrial Properties, Inc. (the “Company”) issued a press release regarding its financial results
for the fourth quarter and year ended December 31, 2023. A copy of the press release is attached hereto as Exhibit 99.1 and is incorporated
by reference herein.
On
February 26, 2024, the Company posted on its website, www.innovativeindustrialproperties.com, certain supplemental financial information
for the fourth quarter and year ended December 31, 2023, which is attached hereto as Exhibit 99.2 and is incorporated by reference herein.
The
information contained in this Current Report, including Exhibits 99.1 and 99.2 referenced herein, is being furnished and shall not be
deemed “filed” for purposes of Section 18 of the Securities Exchange Act of 1934, as amended (the “Exchange Act”),
or otherwise subject to the liabilities of that section and shall not be deemed to be incorporated by reference into any filing under
the Securities Act of 1933, as amended, or the Exchange Act.
Item 9.01
Financial Statements and Exhibits.
(d) Exhibits
SIGNATURES
Pursuant to the requirements
of the Securities Exchange Act of 1934, the registrant has duly caused this report to be signed on its behalf by the undersigned hereunto
duly authorized.
| Date: February 27, 2024 |
INNOVATIVE INDUSTRIAL PROPERTIES, INC. |
| |
|
|
| |
By: |
/s/ David Smith |
| |
Name: |
David Smith |
| |
Title: |
Chief Financial Officer |
Exhibit 99.1
Innovative Industrial Properties Reports Fourth
Quarter and Full-Year 2023 Results
FY 2023 Net Income and AFFO Per Share Increased
5% and 7% over 2022, Respectively
SAN DIEGO, CA – February 26, 2024 – Innovative Industrial
Properties, Inc. (IIP), the first and only real estate company on the New York Stock Exchange (NYSE: IIPR) focused on the regulated U.S.
cannabis industry, announced today results for the fourth quarter and year ended December 31, 2023.
Full Year 2023
| · | Generated total revenues of approximately $309.5 million, representing an increase of 12% over 2022. |
| · | Recorded net income attributable to common stockholders of approximately $164.2 million, or $5.77 per share (all per share amounts
in this press release are reported on a diluted basis unless otherwise noted). |
| · | Recorded adjusted funds from operations (AFFO) and normalized funds from operations (Normalized FFO) of approximately $256.5 million
and $234.1 million, increases of 10% and 9% over 2022, respectively. |
| · | Declared dividends to common stockholders totaling $7.22 per share, increasing IIP’s common stock dividends declared each year
since its inception in 2016. |
| · | Committed up to approximately $119.5 million (excluding transaction costs) for the payment of purchase prices and funding of qualifying
building infrastructure improvements for two property acquisitions, lease amendments for three properties, two new leases in the existing
portfolio and an additional commitment under a construction loan where IIP is lender. |
| · | Sold a portfolio of properties in March located in California for $16.2 million (excluding transaction costs), which included secured
seller financing with the buyer of the property for $16.1 million (interest only, payable monthly). |
| · | Published IIP’s third annual Sustainability Report, highlighting IIP’s commitment to sound
environmental management, collaborative community engagement and corporate governance principles that align to the core values of the
IIP team, and available on its corporate website at www.innovativeindustrialproperties.com. |
| · | At year-end, IIP’s footprint comprised 108 properties totaling 8.9 million rentable square feet in 19 states. |
| | |
Years Ended December 31, | |
| (Per share) | |
2023 | | |
2022 | | |
$ Change | | |
% Change | |
| Net income attributable to common stockholders | |
$ | 5.77 | | |
$ | 5.52 | | |
$ | 0.25 | | |
| 5 | % |
| Normalized FFO | |
$ | 8.29 | | |
$ | 7.76 | | |
$ | 0.53 | | |
| 7 | % |
| AFFO | |
$ | 9.08 | | |
$ | 8.45 | | |
$ | 0.63 | | |
| 7 | % |
Fourth Quarter 2023
Financial Results and Dividend
| · | Generated total revenues of approximately $79.2 million in the quarter, representing a 12% increase from the prior year’s quarter. |
| · | Recorded net income attributable to common stockholders of approximately $41.3 million for the quarter, or $1.45 per share. |
| · | Recorded AFFO of approximately $64.3 million, or $2.28 per share, each increases of 8% from the prior year’s quarter, respectively. |
| · | Paid a quarterly dividend of $1.82 per common share on January 12, 2024 to stockholders of record as of December 29, 2023. |
| | |
Three Months Ended December 31, | |
| (Per share) | |
2023 | | |
2022 | | |
$ Change | | |
% Change | |
| Net income attributable to common stockholders | |
$ | 1.45 | | |
$ | 1.46 | | |
$ | (0.01 | ) | |
| (1 | )% |
| Normalized FFO | |
$ | 2.07 | | |
$ | 1.95 | | |
$ | 0.12 | | |
| 6 | % |
| AFFO | |
$ | 2.28 | | |
$ | 2.12 | | |
$ | 0.16 | | |
| 8 | % |
Financing Activity
| · | Entered into a loan and security agreement (the Loan Agreement) with a federally regulated commercial bank, which matures on October
23, 2026 and provides $30.0 million in aggregate commitments for secured revolving loans (the Revolving Credit Facility). |
| · | Issued shares of common stock under IIP’s “at-the-market” offering program (ATM Program) for net proceeds of approximately
$9.6 million. |
Portfolio – Leasing and New Commitments
| · | Executed a new lease for the property located at 9410 Davis Highway in Dimondale, Michigan, which is under redevelopment as a regulated
cannabis cultivation and processing facility and was previously leased to Green Peak Industries, Inc. (Green Peak). |
| · | Entered into a lease amendment with a subsidiary of Goodness Growth Holdings, Inc. at one of IIP’s New York properties, to,
among other things, increase base rent and increase the improvement allowance under the lease by $14.0 million. |
Portfolio – Rent Collection
| · | Rent collection for IIP’s operating portfolio (calculated as base rent and property management fees collected as a percentage
of contractually due base rent and property management fees) was 100% for the fourth quarter. |
| o | Rent collected for the quarter includes approximately $0.8 million of security deposits applied for the payment of rent in connection
with an amendment with 4Front Ventures Corp. (4Front) at one of IIP’s Illinois properties, and approximately $0.7 million of $1.7
million collected in December 2023 from a subsidiary of SH Parent, Inc. (Parallel) pursuant to a consent judgment awarded in IIP’s
favor and applied to rent due from Parallel for October 2023 at one of IIP’s Pennsylvania properties (Parallel vacated that property
on October 31, 2023). |
Year-to-Date 2024
Portfolio – Leasing and New Commitments
| · | Amended IIP’s lease and development agreement with PharmaCann Inc. at one of IIP’s New York properties to increase the
improvement allowance by $16.0 million, adjust base rent accordingly and extend the lease term. |
| · | Executed a new lease with a tenant at one of IIP’s retail properties in Michigan that was previously leased to Green Peak. |
| · | Executed a non-binding letter of intent with Lume Cannabis Co. to lease IIP’s property located at 10070 Harvest Park in Dimondale,
Michigan, which is currently occupied by the receiver for Green Peak and expected to be returned to IIP on March 1, 2024. |
Financing Activity
| · | Amended Loan Agreement to upsize the Revolving Credit Facility to $45.0 million. |
| · | Exchanged approximately $4.3 million principal amount of IIP’s 3.75% Exchangeable Senior Notes due 2024 (the Exchangeable Senior
Notes) for a combination of cash and shares of IIP common stock prior to maturity, and paid off the remaining $100,000 principal amount
at maturity. |
Portfolio – Rent Collection
| · | Rent collection for IIP’s operating portfolio was 100% year-to-date through February 2024. |
Balance Sheet Highlights (at December 31, 2023)
| · | 12% debt to total gross assets, with approximately $2.6 billion in total gross assets. |
| · | Total liquidity was approximately $177.2 million as of December 31, 2023, consisting of cash and cash equivalents and short-term investments
(each as reported in IIP’s consolidated balance sheet as of December 31, 2023) and availability under the Revolving Credit Facility. |
| · | No debt maturities until May 2026, other than $4.4 million principal amount of Exchangeable Senior Notes which was exchanged or paid
off in full subsequent to year-end. |
| · | Debt service coverage ratio of 16.4x (calculated in accordance with IIP’s 5.50% Unsecured Senior Notes due 2026). |
Property Portfolio Statistics (as of December 31, 2023)
| · | Total property portfolio comprises 108 properties across 19 states, with approximately 8.9 million rentable square feet (including
approximately 1.4 million rentable square feet under development / redevelopment), consisting of: |
| o | Operating portfolio: 103 properties, representing approximately 8.2 million rentable square feet. |
| o | Under development / redevelopment portfolio contains five properties expected to comprise 715,000 rentable square feet at completion,
of which 460,000 rentable square feet (64% of total) is pre-leased or under a non-binding letter of intent to lease, with the remainder
comprised of one property totaling 192,000 square feet in San Bernardino, California and twelve acres of land to be developed in San Marcos,
Texas. The five properties in the development / redevelopment portfolio are as follows: |
| § | Perez Road in Cathedral City, California (pre-leased) |
| § | Davis Highway in Dimondale, Michigan (pre-leased) |
| § | 63795 19th Avenue in Palm Springs, California (non-binding letter of intent to lease) |
| § | Inland Center Drive in San Bernardino, California |
| § | Leah Avenue in San Marcos, Texas |
| o | 95.8% leased (triple-net). |
| o | Weighted-average remaining lease term: 14.6 years. |
| o | Total invested / committed capital per square foot: $275. |
| · | By annualized base rent (excluding non-cannabis tenants that comprise less than 1% of annualized base rent in the aggregate): |
| o | No tenant represents more than 16% of annualized base rent. |
| o | No state represents more than 15% of annualized base rent. |
| o | Multi-state operators (MSOs) represent 90% of annualized base rent. |
| o | Public company operators represent 62% of annualized base rent. |
| o | Industrial (cultivation and/or processing), retail (dispensing) and combined industrial/retail represent 92%, 2% and 6% of the operating
portfolio, respectively. |
Financial Results
For the three months ended December 31, 2023, IIP generated total revenues
of approximately $79.2 million, compared to approximately $70.5 million for the same period in 2022, an increase of 12%. The increase
was primarily driven by an increase in tenant reimbursements versus the prior period, as well as activity in prior periods for the acquisition
and leasing of new properties, additional building infrastructure allowances provided to tenants at certain properties that resulted in
increases to base rent and contractual rental escalations at certain properties. Total revenues for the three months ended December 31,
2023 and 2022 included approximately $6.6 million and $3.0 million, respectively, of tenant reimbursements for property insurance premiums
and property taxes. Rental revenues for the three months ended December 31, 2023 also included (1) approximately $0.8 million of security
deposits applied for payment of rent for a lease with 4Front; (2) approximately $0.2 million of the $0.4 million in payments received
from Kings Garden, Inc. (Kings Garden) pursuant to an offer of judgment for lease defaults on certain California properties previously
occupied by Kings Garden; and (3) approximately $1.7 million received as partial payment of a consent order against Parallel for lease
defaults at one of IIP’s Pennsylvania properties previously leased to Parallel.
For the year ended December 31, 2023, IIP generated total revenues
of approximately $309.5 million, compared to approximately $276.4 million for 2022, an increase of 12%. Of that increase, approximately
$13.3 million was related to tenant reimbursements for property insurance premiums and property taxes, which increased to approximately
$23.4 million for the year ended December 31, 2023, compared to approximately $10.1 million for the year ended December 31, 2022. The
increase in tenant reimbursements was primarily due to a change in IIP’s policy from allowing tenants to pay property taxes directly
to taxing authorities to IIP making tax payments directly to taxing authorities and then billing tenants for property tax reimbursements
starting in January 2023. The remaining increase was driven primarily by the acquisition and leasing of new properties, additional building
infrastructure allowances provided to tenants at certain properties that resulted in adjustments to base rent, and contractual rental
escalations at certain properties, partially offset by the previously disclosed defaults of tenants for which IIP did not receive or record
revenue and the termination of certain leases with Green Peak, Kings Garden, Medical Investor Holdings, LLC (Vertical) and Parallel. During
the twelve months ended December 31, 2023, IIP collected 98% of contractual rents and did not collect rents totaling approximately $4.8
million (including approximately $4.5 million of contractual base rents and property management fees and $0.3 million for tenant reimbursements
for property insurance premiums and taxes from three tenants).
For the three months ended December 31, 2023, IIP recorded net income
attributable to common stockholders of approximately $41.3 million, or $1.45 per share; funds from operations (FFO) of approximately $58.4
million, or $2.07 per share; Normalized FFO of approximately $58.6 million, or $2.07 per share; and AFFO of approximately $64.3 million,
or $2.28 per share.
For the year ended December 31, 2023, IIP recorded net income attributable
to common stockholders of approximately $164.2 million, or $5.77 per share; FFO of approximately $231.6 million, or $8.20 per share; Normalized
FFO of approximately $234.1 million, or $8.29 per share; and AFFO of approximately $256.5 million, or $9.08 per share.
IIP paid a quarterly dividend of $1.82 per common share on January
12, 2024 to stockholders of record as of December 29, 2023. IIP’s AFFO payout ratio was 80% (calculated by dividing the common stock
dividend declared per share by IIP’s AFFO per common share for the quarter). The common stock dividends declared for the twelve
months ended December 31, 2023 totaled $7.22 per common share. IIP has increased its common stock dividends declared each year since its
inception in 2016.
FFO, Normalized FFO and AFFO are supplemental non-GAAP financial measures
used in the real estate industry to measure and compare the operating performance of real estate companies. A complete reconciliation
containing adjustments from GAAP net income attributable to common stockholders to FFO, Normalized FFO and AFFO and definitions of terms
are included at the end of this release.
Financing Activity
In October 2023, IIP Operating Partnership, LP, IIP’s operating
partnership subsidiary (the Operating Partnership), entered into a Loan Agreement with a federally regulated commercial bank, as lender
and as agent for lenders that become party thereto from time to time. The Loan Agreement matures on October 23, 2026, and was upsized
in February 2024 to provide for $45.0 million in aggregate commitments for a Revolving Credit Facility, the availability of which is based
on a borrowing base consisting of real properties owned by subsidiaries (the Subsidiary Guarantors) of the Operating Partnership that
satisfy eligibility criteria set forth in the Loan Agreement. The obligations of the Operating Partnership under the Loan Agreement are
guaranteed by IIP and the Subsidiary Guarantors, and are secured by (i) operating accounts of the Operating Partnership into which lease
payments under the real property included in the borrowing base are paid, (ii) the equity interest of the Subsidiary Guarantors, (iii)
the real estate included in the borrowing base and the leases and rents thereunder, and (iv) all personal property of the Subsidiary Guarantors.
Borrowings under the Loan Agreement bear interest at a variable rate based on the greater of the prime rate and an applicable margin based
on deposits with the participating bank(s) and a stipulated interest rate. The Loan Agreement is subject to certain liquidity and operating
covenants and includes customary representations and warranties, affirmative and negative covenants and events of default. The Loan Agreement
also allows the Operating Partnership, subject to the satisfaction of certain conditions, to request additional revolving loan commitments
up to a specified amount.
During the three months and year ended December 31, 2023, IIP issued
101,061 shares of its common stock under its ATM Program for net proceeds of approximately $9.6 million.
Subsequent to year-end, IIP exchanged approximately $4.3 million principal
amount of its Exchangeable Senior Notes for a combination of cash and shares of IIP common stock prior to maturity, in accordance with
the terms of the indenture, and paid off the remaining $100,000 principal amount at maturity.
Supplemental Information
Supplemental financial information is available in the Investor Relations
section of IIP’s website at www.innovativeindustrialproperties.com.
Teleconference and Webcast
Innovative Industrial Properties, Inc. will conduct a conference
call and webcast at 10:00 a.m. Pacific Time (1:00 p.m. Eastern Time) on Tuesday, February 27, 2024 to discuss IIP’s
financial results and operations for the fourth quarter and year ended December 31, 2023. The call will be open to all interested
investors through a live audio webcast at the Investor Relations section of IIP’s website at www.innovativeindustrialproperties.com,
or live by calling 1-877-328-5514 (domestic) or 1-412-902-6764 (international) and asking to be joined to the Innovative Industrial Properties,
Inc. conference call. The complete webcast will be archived for 90 days on IIP’s website. A telephone playback of the conference
call will also be available from 12:00 p.m. Pacific Time on Tuesday, February 27, 2024 until 12:00 p.m. Pacific
Time on Tuesday, March 5, 2024, by calling 1-877-344-7529 (domestic), 855-669-9658 (Canada) or 1-412-317-0088 (international) and
using access code 9779220.
About Innovative Industrial Properties
Innovative Industrial Properties, Inc. is a self-advised Maryland corporation
focused on the acquisition, ownership and management of specialized properties leased to experienced, state-licensed operators for their
regulated cannabis facilities. Innovative Industrial Properties, Inc. has elected to be taxed as a real estate investment trust, commencing
with the year ended December 31, 2017. Additional information is available at www.innovativeindustrialproperties.com.
This press release contains statements that IIP believes to be
“forward-looking statements” within the meaning of the safe harbor provisions of the Private Securities Litigation
Reform Act of 1995. All statements other than historical facts are forward-looking statements. When used in this press release,
words such as IIP “expects,” “intends,” “plans,” “estimates,”
“anticipates,” “believes” or “should” or the negative thereof or similar terminology are
generally intended to identify forward-looking statements. Such forward-looking statements are subject to risks and uncertainties
that could cause actual results to differ materially from those expressed in, or implied by, such statements. Investors should not
place undue reliance upon forward-looking statements. IIP disclaims any obligation to update or revise any forward-looking
statements, whether as a result of new information, future events or otherwise.
Innovative
Industrial Properties, Inc.
Consolidated
Balance SheetS
(Unaudited)
(In thousands, except share and per share amounts)
| | |
December 31, | | |
December 31, | |
| | |
2023 | | |
2022 | |
| Assets | |
| | | |
| | |
| Real estate, at cost: | |
| | | |
| | |
| Land | |
$ | 142,524 | | |
$ | 139,953 | |
| Buildings and improvements | |
| 2,108,218 | | |
| 2,010,628 | |
| Construction in progress | |
| 117,773 | | |
| 54,106 | |
| Total real estate, at cost | |
| 2,368,515 | | |
| 2,204,687 | |
| Less accumulated depreciation | |
| (202,692 | ) | |
| (138,405 | ) |
| Net real estate held for investment | |
| 2,165,823 | | |
| 2,066,282 | |
| Construction loan receivable | |
| 22,000 | | |
| 18,021 | |
| Cash and cash equivalents | |
| 140,249 | | |
| 87,122 | |
| Restricted cash | |
| 1,450 | | |
| 1,450 | |
| Investments | |
| 21,948 | | |
| 200,935 | |
| Right of use office lease asset | |
| 1,355 | | |
| 1,739 | |
| In-place lease intangible assets, net | |
| 8,245 | | |
| 9,105 | |
| Other assets, net | |
| 30,020 | | |
| 30,182 | |
| Total assets | |
$ | 2,391,090 | | |
$ | 2,414,836 | |
| Liabilities and stockholders’ equity | |
| | | |
| | |
| Liabilities: | |
| | | |
| | |
| Exchangeable Senior Notes, net | |
$ | 4,431 | | |
$ | 6,380 | |
| Notes due 2026, net | |
| 296,449 | | |
| 295,115 | |
| Building improvements and construction funding payable | |
| 9,591 | | |
| 29,376 | |
| Accounts payable and accrued expenses | |
| 11,406 | | |
| 10,615 | |
| Dividends payable | |
| 51,827 | | |
| 50,840 | |
| Rent received in advance and tenant security deposits | |
| 59,358 | | |
| 58,716 | |
| Other liabilities | |
| 5,056 | | |
| 1,901 | |
| Total liabilities | |
| 438,118 | | |
| 452,943 | |
| | |
| | | |
| | |
| Stockholders’ equity: | |
| | | |
| | |
| Preferred stock, par value $0.001 per share, 50,000,000 shares authorized: 9.00% Series A cumulative redeemable preferred stock, $15,000 liquidation preference ($25.00 per share), 600,000 shares issued and outstanding at December 31, 2023 and December 31, 2022 | |
| 14,009 | | |
| 14,009 | |
| Common stock, par value $0.001 per share, 50,000,000 shares authorized: 28,140,891 and 27,972,830 shares issued and outstanding at December 31, 2023 and December 31, 2022, respectively | |
| 28 | | |
| 28 | |
| Additional paid-in capital | |
| 2,095,789 | | |
| 2,065,248 | |
| Dividends in excess of earnings | |
| (156,854 | ) | |
| (117,392 | ) |
| Total stockholders’ equity | |
| 1,952,972 | | |
| 1,961,893 | |
| Total liabilities and stockholders’ equity | |
$ | 2,391,090 | | |
$ | 2,414,836 | |
Innovative
Industrial Properties, Inc.
Consolidated
STATEMENTS OF INCOME
For the Three Months and Years Ended December
31, 2023 and 2022
(Unaudited)
(In thousands, except share and per share amounts)
| | |
For the Three Months Ended | | |
For the Year Ended | |
| | |
December 31, | | |
December 31, | |
| | |
2023 | | |
2022 | | |
2023 | | |
2022 | |
| Revenues: | |
| | |
| | |
| | |
| |
| Rental (including tenant reimbursements) | |
$ | 78,615 | | |
$ | 69,923 | | |
$ | 307,349 | | |
$ | 274,377 | |
| Other | |
| 541 | | |
| 538 | | |
| 2,157 | | |
| 1,982 | |
| Total revenues | |
| 79,156 | | |
| 70,461 | | |
| 309,506 | | |
| 276,359 | |
| | |
| | | |
| | | |
| | | |
| | |
| Expenses: | |
| | | |
| | | |
| | | |
| | |
| Property expenses | |
| 7,193 | | |
| 3,288 | | |
| 24,893 | | |
| 10,520 | |
| General and administrative expense | |
| 10,908 | | |
| 10,232 | | |
| 42,832 | | |
| 38,520 | |
| Depreciation and amortization expense | |
| 17,098 | | |
| 16,302 | | |
| 67,194 | | |
| 61,303 | |
| Total expenses | |
| 35,199 | | |
| 29,822 | | |
| 134,919 | | |
| 110,343 | |
| Gain on sale of real estate | |
| — | | |
| 3,601 | | |
| — | | |
| 3,601 | |
| Income from operations | |
| 43,957 | | |
| 44,240 | | |
| 174,587 | | |
| 169,617 | |
| Interest and other income | |
| 1,821 | | |
| 1,784 | | |
| 8,446 | | |
| 3,195 | |
| Interest expense | |
| (4,145 | ) | |
| (4,518 | ) | |
| (17,467 | ) | |
| (18,301 | ) |
| Gain (loss) on exchange of Exchangeable Senior Notes | |
| — | | |
| — | | |
| 22 | | |
| (125 | ) |
| Net income | |
| 41,633 | | |
| 41,506 | | |
| 165,588 | | |
| 154,386 | |
| Preferred stock dividends | |
| (338 | ) | |
| (338 | ) | |
| (1,352 | ) | |
| (1,352 | ) |
| Net income attributable to common stockholders | |
$ | 41,295 | | |
$ | 41,168 | | |
$ | 164,236 | | |
$ | 153,034 | |
| Net income attributable to common stockholders per share: | |
| | | |
| | | |
| | | |
| | |
| Basic | |
$ | 1.46 | | |
$ | 1.47 | | |
$ | 5.82 | | |
$ | 5.57 | |
| Diluted | |
$ | 1.45 | | |
$ | 1.46 | | |
$ | 5.77 | | |
$ | 5.52 | |
| Weighted-average shares outstanding: | |
| | | |
| | | |
| | | |
| | |
| Basic | |
| 27,996,393 | | |
| 27,938,804 | | |
| 27,977,807 | | |
| 27,345,047 | |
| Diluted | |
| 28,279,834 | | |
| 28,160,261 | | |
| 28,255,797 | | |
| 27,663,169 | |
Innovative
Industrial Properties, Inc.
Consolidated
FFO, NORMALIZED FFO AND AFFO
For the Three Months and Years Ended December
31, 2023 and 2022
(Unaudited)
(In thousands, except share and per share amounts)
| | |
For the Three Months Ended | | |
For the Year Ended | |
| | |
December 31, | | |
December 31, | |
| | |
2023 | | |
2022 | | |
2023 | | |
2022 | |
| Net income attributable to common stockholders | |
$ | 41,295 | | |
$ | 41,168 | | |
$ | 164,236 | | |
$ | 153,034 | |
| Real estate depreciation and amortization | |
| 17,098 | | |
| 16,302 | | |
| 67,194 | | |
| 61,303 | |
| Gain on sale of real estate | |
| — | | |
| (3,601 | ) | |
| — | | |
| (3,601 | ) |
| FFO attributable to common stockholders (basic) | |
| 58,393 | | |
| 53,869 | | |
| 231,430 | | |
| 210,736 | |
| Cash and non-cash interest expense on Exchangeable Senior Notes | |
| 50 | | |
| 72 | | |
| 219 | | |
| 546 | |
| FFO attributable to common stockholders (diluted) | |
| 58,443 | | |
| 53,941 | | |
| 231,649 | | |
| 211,282 | |
| Financing expense | |
| — | | |
| 249 | | |
| — | | |
| 367 | |
| Litigation-related expense | |
| 152 | | |
| 779 | | |
| 2,480 | | |
| 3,010 | |
| Loss (gain) on exchange of Exchangeable Senior Notes | |
| — | | |
| — | | |
| (22 | ) | |
| 125 | |
| Normalized FFO attributable to common stockholders (diluted) | |
| 58,595 | | |
| 54,969 | | |
| 234,107 | | |
| 214,784 | |
| Interest income on seller-financed note(1) | |
| 403 | | |
| — | | |
| 1,342 | | |
| — | |
| Stock-based compensation | |
| 4,934 | | |
| 4,312 | | |
| 19,581 | | |
| 17,507 | |
| Non-cash interest expense | |
| 383 | | |
| 321 | | |
| 1,375 | | |
| 1,255 | |
| Above-market lease amortization | |
| 23 | | |
| 23 | | |
| 92 | | |
| 91 | |
| AFFO attributable to common stockholders (diluted) | |
$ | 64,338 | | |
$ | 59,625 | | |
$ | 256,497 | | |
$ | 233,637 | |
| FFO per common share – diluted | |
$ | 2.07 | | |
$ | 1.92 | | |
$ | 8.20 | | |
$ | 7.64 | |
| Normalized FFO per common share – diluted | |
$ | 2.07 | | |
$ | 1.95 | | |
$ | 8.29 | | |
$ | 7.76 | |
| AFFO per common share – diluted | |
$ | 2.28 | | |
$ | 2.12 | | |
$ | 9.08 | | |
$ | 8.45 | |
| Weighted average common shares outstanding – basic | |
| 27,996,393 | | |
| 27,938,804 | | |
| 27,977,807 | | |
| 27,345,047 | |
| Restricted stock and RSUs | |
| 206,667 | | |
| 117,831 | | |
| 196,821 | | |
| 116,046 | |
| Dilutive effect of Exchangeable Senior Notes | |
| 76,774 | | |
| 103,626 | | |
| 81,169 | | |
| 202,076 | |
| Weighted average common shares outstanding – diluted | |
| 28,279,834 | | |
| 28,160,261 | | |
| 28,255,797 | | |
| 27,663,169 | |
| (1) | Amount reflects the non-refundable interest paid on the seller-financed note issued to IIP by the buyer in connection with IIP’s
disposition of a portfolio of four properties in southern California, which is recognized as a deposit liability and is included in other
liabilities in IIP’s consolidated balance sheet as of December 31, 2023, as the transaction did not qualify for recognition as a
completed sale. |
FFO and FFO per share are operating performance
measures adopted by the National Association of Real Estate Investment Trusts, Inc. (NAREIT). NAREIT defines FFO as the most commonly
accepted and reported measure of a REIT’s operating performance equal to net income, computed in accordance with accounting principles
generally accepted in the United States (GAAP), excluding gains (or losses) from sales of property, depreciation, amortization and impairment
related to real estate properties, and after adjustments for unconsolidated partnerships and joint ventures.
Management believes that net income, as
defined by GAAP, is the most appropriate earnings measurement. However, management believes FFO and FFO per share to be supplemental
measures of a REIT’s performance because they provide an understanding of the operating performance of IIP’s properties
without giving effect to certain significant non-cash items, primarily depreciation expense. Historical cost accounting for real
estate assets in accordance with GAAP assumes that the value of real estate assets diminishes predictably over time. However, real
estate values instead have historically risen or fallen with market conditions. IIP believes that by excluding the effect of
depreciation, FFO and FFO per share can facilitate comparisons of operating performance between periods. IIP reports FFO and FFO per
share because these measures are observed by management to also be the predominant measures used by the REIT industry and industry
analysts to evaluate REITs and because FFO per share is consistently reported, discussed, and compared by research analysts in their
notes and publications about REITs. For these reasons, management has deemed it appropriate to disclose and discuss FFO and FFO per
share.
IIP computes Normalized FFO by adjusting FFO,
as defined by NAREIT, to exclude certain GAAP income and expense amounts that management believes are infrequent and unusual in nature
and/or not related to IIP’s core real estate operations. Exclusion of these items from similar FFO-type metrics is common within
the equity REIT industry, and management believes that presentation of Normalized FFO and Normalized FFO per share provides investors
with a metric to assist in their evaluation of IIP’s operating performance across multiple periods and in comparison to the operating
performance of other companies, because it removes the effect of unusual items that are not expected to impact IIP’s operating performance
on an ongoing basis. Normalized FFO is used by management in evaluating the performance of its core business operations. Items included
in calculating FFO that may be excluded in calculating Normalized FFO include certain transaction-related gains, losses, income or expense
or other non-core amounts as they occur.
Management believes that AFFO and AFFO per share
are also appropriate supplemental measures of a REIT’s operating performance. IIP calculates AFFO by adjusting Normalized FFO for
certain cash and non-cash items.
For all periods presented, FFO (diluted), Normalized
FFO, AFFO and FFO, Normalized FFO and AFFO per diluted share include the dilutive impact of the assumed full exchange of the Exchangeable
Senior Notes for shares of common stock.
For all periods presented, as the performance
thresholds for vesting of the performance share units were not met as measured as of the respective dates, they were excluded from the
calculation of weighted average common shares outstanding – diluted.
IIP’s computation of FFO, Normalized FFO
and AFFO may differ from the methodology for calculating FFO, Normalized FFO and AFFO utilized by other equity REITs and, accordingly,
may not be comparable to such REITs. Further, FFO, Normalized FFO and AFFO do not represent cash flow available for management’s
discretionary use. FFO, Normalized FFO and AFFO should not be considered as an alternative to net income (computed in accordance with
GAAP) as an indicator of IIP’s financial performance or to cash flow from operating activities (computed in accordance with GAAP)
as an indicator of IIP’s liquidity, nor is it indicative of funds available to fund IIP’s cash needs, including IIP’s
ability to pay dividends or make distributions. FFO, Normalized FFO and AFFO should be considered only as supplements to net income computed
in accordance with GAAP as measures of IIP’s operations.
Company Contact:
David Smith
Chief Financial Officer
Innovative Industrial Properties, Inc.
(858) 997-3332
Exhibit 99.2
Innovative Industrial Properties Fourth Quarter 2023 Supplemental Financial Information
Innovative Industrial Properties 2 Overview Forward - Looking Statements 3 Company Overview 4 Financial Information Quarterly Performance Summary 5 Balance Sheet 6 Net Income 7 FFO, Normalized FFO, and AFFO Reconciliation 8 Historical Net Income 9 Historical FFO, Normalized FFO, and AFFO Reconciliation 10 Statements of Cash Flows 11 Portfolio Data Capital Commitments 12 Leasing Summary 13 Top Tenants Overview 14 Property List 15 – 17 Secured Loans 18 Capitalization Capital and Debt Summary 19 Definitions 20 – 21 Analyst Coverage 22 Senior Management Team and Board of Directors 23 Table of Contents
Innovative Industrial Properties 3 Forward - Looking Statements This Supplemental Financial Information Package include "forward - looking statements" (within the meaning of the Private Securities Litigation Reform Act of 1995 , Section 27 A of the Securities Act of 1933 , as amended, and Section 21 E of the Securities Exchange Act of 1934 , as amended) that are subject to risks and uncertainties . In particular, statements pertaining to our capital resources, portfolio performance and results of operations contain forward - looking statements . Likewise, our statements regarding anticipated growth in our funds from operations and anticipated market and regulatory conditions, our strategic direction, our dividend rate and policy, demographics, results of operations, plans and objectives are forward - looking statements . Forward - looking statements involve numerous risks and uncertainties, and you should not rely on them as predictions of future events . Forward - looking statements depend on assumptions, data or methods which may be incorrect or imprecise, and we may not be able to realize them . We do not guarantee that the transactions and events described will happen as described (or that they will happen at all) . You can identify forward - looking statements by the use of forward - looking terminology such as "believes“, "expects“, "may“, "will“, "should“, "seeks“, "approximately“, "intends“, "plans“, "estimates" or "anticipates" or the negative of these words and phrases or similar words or phrases . You can also identify forward - looking statements by discussions of strategy, plans or intentions . The following factors, among others, could cause actual results and future events to differ materially from those set forth or contemplated in the forward - looking statements : rates of default on leases for our assets ; concentration of our portfolio of assets and limited number of tenants ; the estimated growth in and evolving market dynamics of the regulated cannabis market ; the demand for regulated cannabis facilities ; inflation dynamics ; our ability to improve our internal control over financial reporting, including our inability to remediate an identified material weakness, and the costs and the time associated with such efforts ; the impact of pandemics on us, our business, our tenants, or the economy generally ; war and other hostilities, including the conflicts in Ukraine and Israel ; our business and investment strategy ; our projected operating results ; actions and initiatives of the U . S . or state governments and changes to government policies and the execution and impact of these actions, initiatives and policies, including the fact that cannabis remains illegal under federal law ; availability of suitable investment opportunities in the regulated cannabis industry ; our understanding of our competition and our potential tenants’ alternative financing sources ; the expected medical - use or adult - use cannabis legalization in certain states ; shifts in public opinion regarding regulated cannabis ; the potential impact on us from litigation matters, including rising liability and insurance costs ; the additional risks that may be associated with certain of our tenants cultivating, processing and/or dispensing adult - use cannabis in our facilities ; the state of the U . S . economy generally or in specific geographic areas ; economic trends and economic recoveries ; our ability to access equity or debt capital ; financing rates for our target assets ; our level of indebtedness, which could reduce funds available for other business purposes and reduce our operational flexibility ; covenants in our debt instruments, which may limit our flexibility and adversely affect our financial condition ; our ability to maintain our investment grade credit rating ; changes in the values of our assets ; our expected portfolio of assets ; our expected investments ; interest rate mismatches between our assets and our borrowings used to fund such investments ; changes in interest rates and the market value of our assets ; the degree to which any interest rate or other hedging strategies may or may not protect us from interest rate volatility ; the impact of and changes in governmental regulations, tax law and rates, accounting guidance and similar matters ; our ability to maintain our qualification as a real estate investment trust for U . S . federal income tax purposes ; our ability to maintain our exemption from registration under the Investment Company Act of 1940 ; availability of qualified personnel ; and market trends in our industry, interest rates, real estate values, the securities markets or the general economy . The risks included here are not exhaustive, and additional factors could adversely affect our business and financial performance . In addition, we discussed a number of material risks in our most recent Annual Report on Form 10 - K and subsequent Quarterly Reports on Form 10 - Q . Those risks continue to be relevant to our performance and financial condition . Moreover, we operate in a very competitive and rapidly changing environment . New risk factors emerge from time to time and it is not possible for management to predict all such risk factors, nor can it assess the impact of all such risk factors on our business or the extent to which any factor, or combination of factors, may cause actual results to differ materially from those contained in any forward - looking statements . Any forward - looking statement made by us speaks only of the date on which we make it . We undertake no obligation to publicly update or revise any forward - looking statements, whether as a result of new information, future events or otherwise, except as may be required by law . Stockholders and investors are cautioned not to unduly rely on such forward - looking statements when evaluating the information presented in our filings and reports . Market and industry data are included in this presentation . We have obtained substantially all of this information from internal studies, public filings, other independent published industry sources and market studies prepared by third parties . We believe these internal studies, public filings, other independent published industry sources and market studies prepared by third parties are reliable . However, this information may prove to be inaccurate . No representation or warranty is made as to the accuracy of such information . All amounts shown in this report are unaudited . This Supplemental Financial Information Package is not an offer to sell or solicitation to buy securities of Innovative Industrial Properties, Inc . Any offers to sell or solicitations to buy securities of Innovative Industrial Properties, Inc . shall be made only by means of a prospectus approved for that purpose .
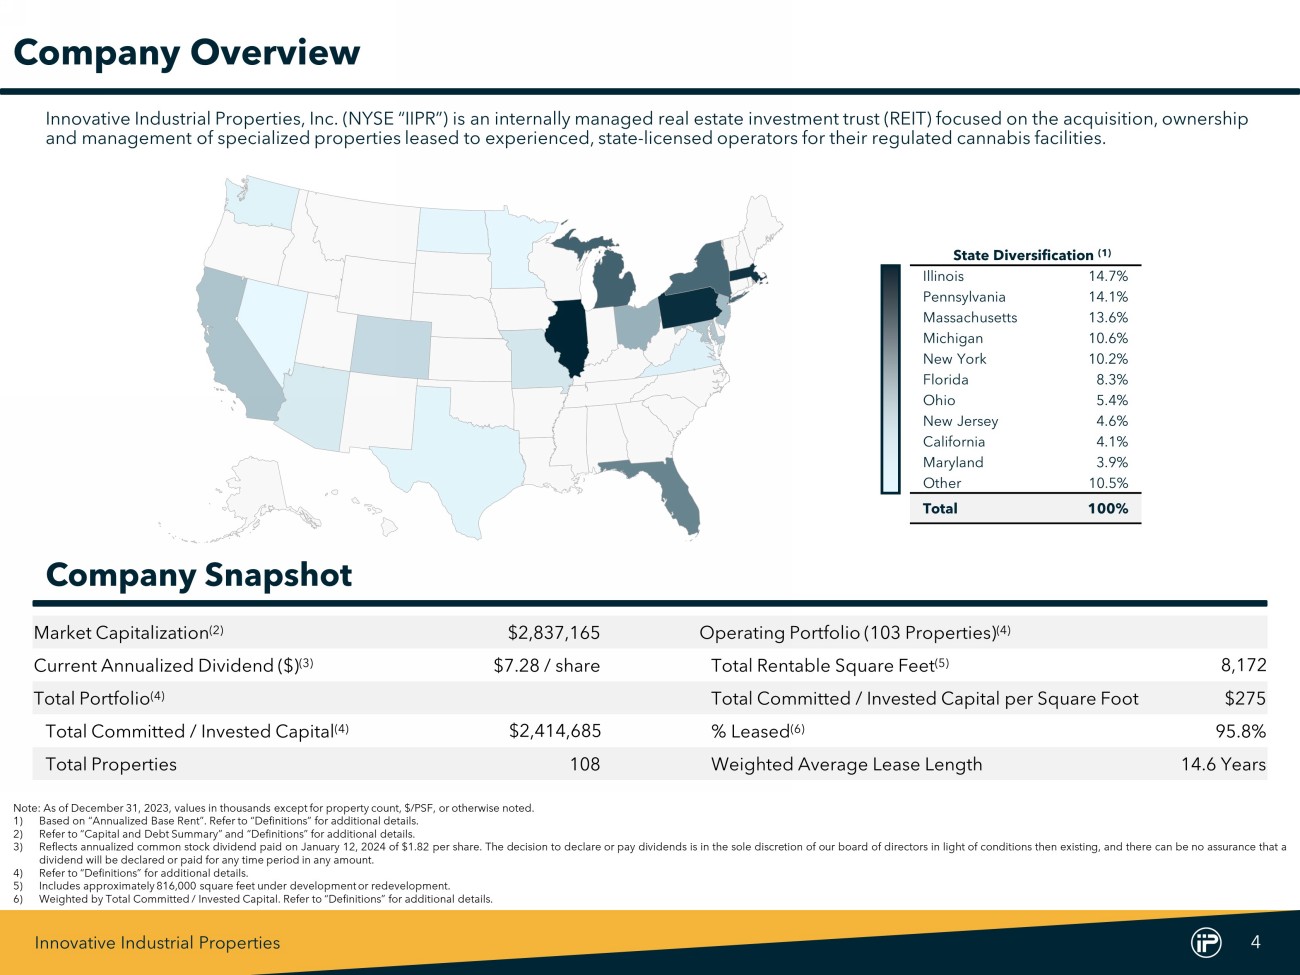
Innovative Industrial Properties 4 Company Snapshot State Diversification (1) Illinois 14.7% Pennsylvania 14.1% Massachusetts 13.6% Michigan 10.6% New York 10.2% Florida 8.3% Ohio 5.4% New Jersey 4.6% California 4.1% Maryland 3.9% Other 10.5% Total 100% Company Overview Innovative Industrial Properties, Inc. (NYSE “IIPR”) is an internally managed real estate investment trust (REIT) focused on the acquisition, ownership and management of specialized properties leased to experienced, state - licensed operators for their regulated cannabis facilities . Note : As of December 31 , 2023 , values in thousands except for property count, $ /PSF, or otherwise noted . 1) Based on “Annualized Base Rent” . Refer to “Definitions” for additional details . 2) Refer to “Capital and Debt Summary” and “Definitions” for additional details . 3) Reflects annualized common stock dividend paid on January 12 , 2024 of $ 1 . 82 per share . The decision to declare or pay dividends is in the sole discretion of our board of directors in light of conditions then existing, and there can be no assurance that a dividend will be declared or paid for any time period in any amount . 4) Refer to “Definitions” for additional details . 5) Includes approximately 816 , 000 square feet under development or redevelopment . 6) Weighted by Total Committed / Invested Capital . Refer to “Definitions” for additional details . Market Capitalization (2) $2,837,165 Operating Portfolio (103 Properties) (4) Current Annualized Dividend ($) (3) $7.28 / share Total Rentable Square Feet (5) 8,172 Total Portfolio (4) Total Committed / Invested Capital per Square Foot $275 Total Committed / Invested Capital (4) $2,414,685 % Leased (6) 95.8% Total Properties 108 Weighted Average Lease Length 14.6 Years
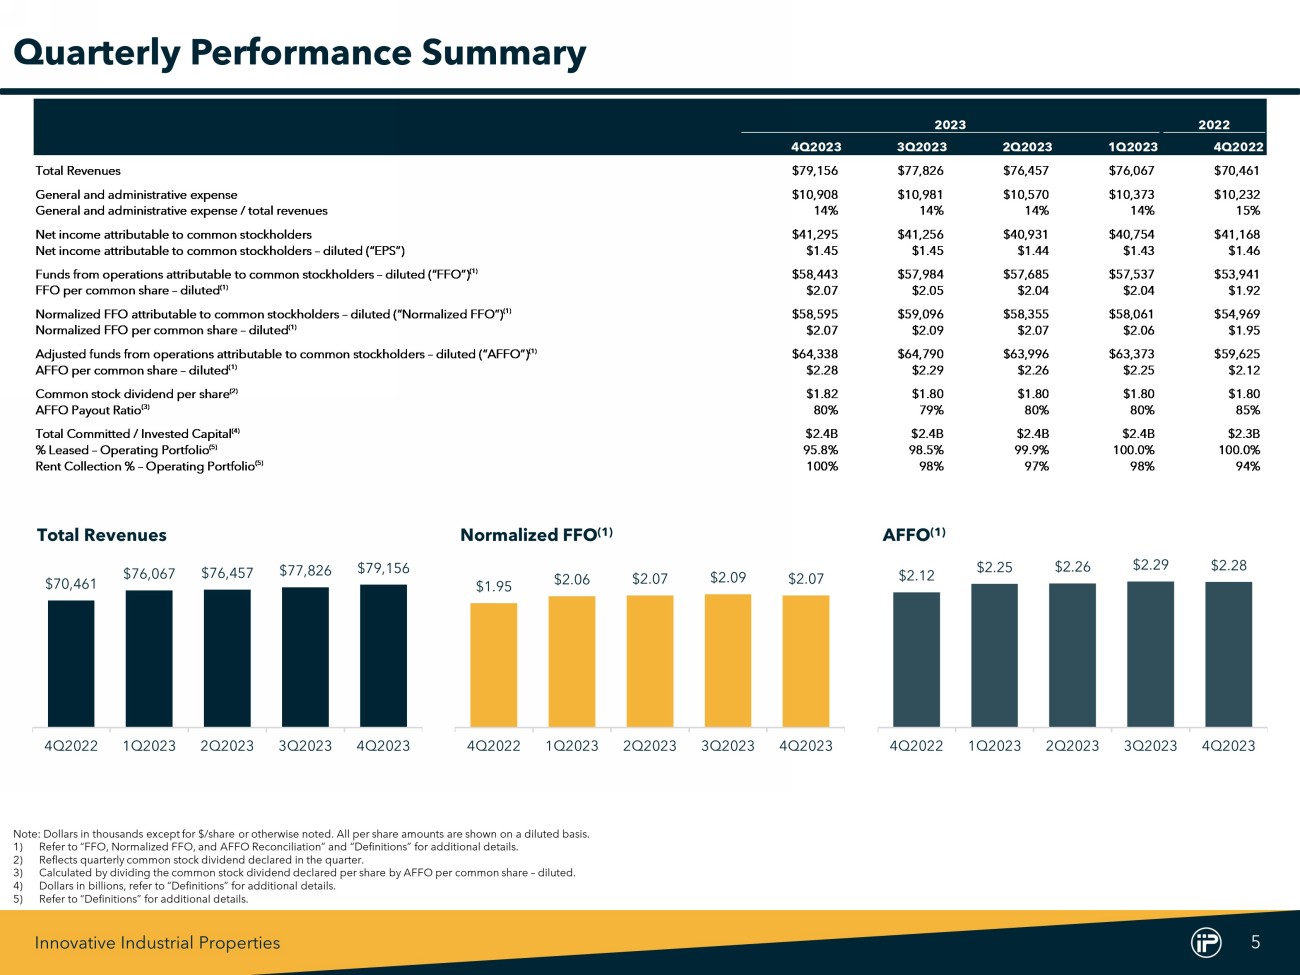
Innovative Industrial Properties 5 Delta 2023 2022 4Q2023 3Q2023 2Q2023 1Q2023 4Q2022 Total Revenues $79,156 $77,826 $76,457 $76,067 $70,461 General and administrative expense $10,908 $10,981 $10,570 $10,373 $10,232 General and administrative expense / total revenues 14% 14% 14% 14% 15% Net income attributable to common stockholders $41,295 $41,256 $40,931 $40,754 $41,168 Net income attributable to common stockholders – diluted (“EPS”) $1.45 $1.45 $1.44 $1.43 $1.46 Funds from operations attributable to common stockholders – diluted (“FFO”) (1) $58,443 $57,984 $57,685 $57,537 $53,941 FFO per common share – diluted (1) $2.07 $2.05 $2.04 $2.04 $1.92 Normalized FFO attributable to common stockholders – diluted (“Normalized FFO”) (1) $58,595 $59,096 $58,355 $58,061 $54,969 Normalized FFO per common share – diluted (1) $2.07 $2.09 $2.07 $2.06 $1.95 Adjusted funds from operations attributable to common stockholders – diluted (“AFFO”) (1) $64,338 $64,790 $63,996 $63,373 $59,625 AFFO per common share – diluted (1) $2.28 $2.29 $2.26 $2.25 $2.12 Common stock dividend per share (2) $1.82 $1.80 $1.80 $1.80 $1.80 AFFO Payout Ratio (3) 80% 79% 80% 80% 85% Total Committed / Invested Capital (4) $2.4B $2.4B $2.4B $2.4B $2.3B % Leased – Operating Portfolio (5) 95.8% 98.5% 99.9% 100.0% 100.0% Rent Collection % – Operating Portfolio (5) 100% 98% 97% 98% 94% Quarterly Performance Summary Note : Dollars in thousands except for $ /share or otherwise noted . All per share amounts are shown on a diluted basis . 1) Refer to “FFO, Normalized FFO, and AFFO Reconciliation” and “Definitions” for additional details . 2) Reflects quarterly common stock dividend declared in the quarter . 3) Calculated by dividing the common stock dividend declared per share by AFFO per common share – diluted . 4) Dollars in billions, refer to “Definitions” for additional details . 5) Refer to “Definitions” for additional details . $2.12 $2.25 $2.26 $2.29 $2.28 4Q2022 1Q2023 2Q2023 3Q2023 4Q2023 AFFO (1) $1.95 $2.06 $2.07 $2.09 $2.07 4Q2022 1Q2023 2Q2023 3Q2023 4Q2023 Normalized FFO (1) $70,461 $76,067 $76,457 $77,826 $79,156 4Q2022 1Q2023 2Q2023 3Q2023 4Q2023 Total Revenues
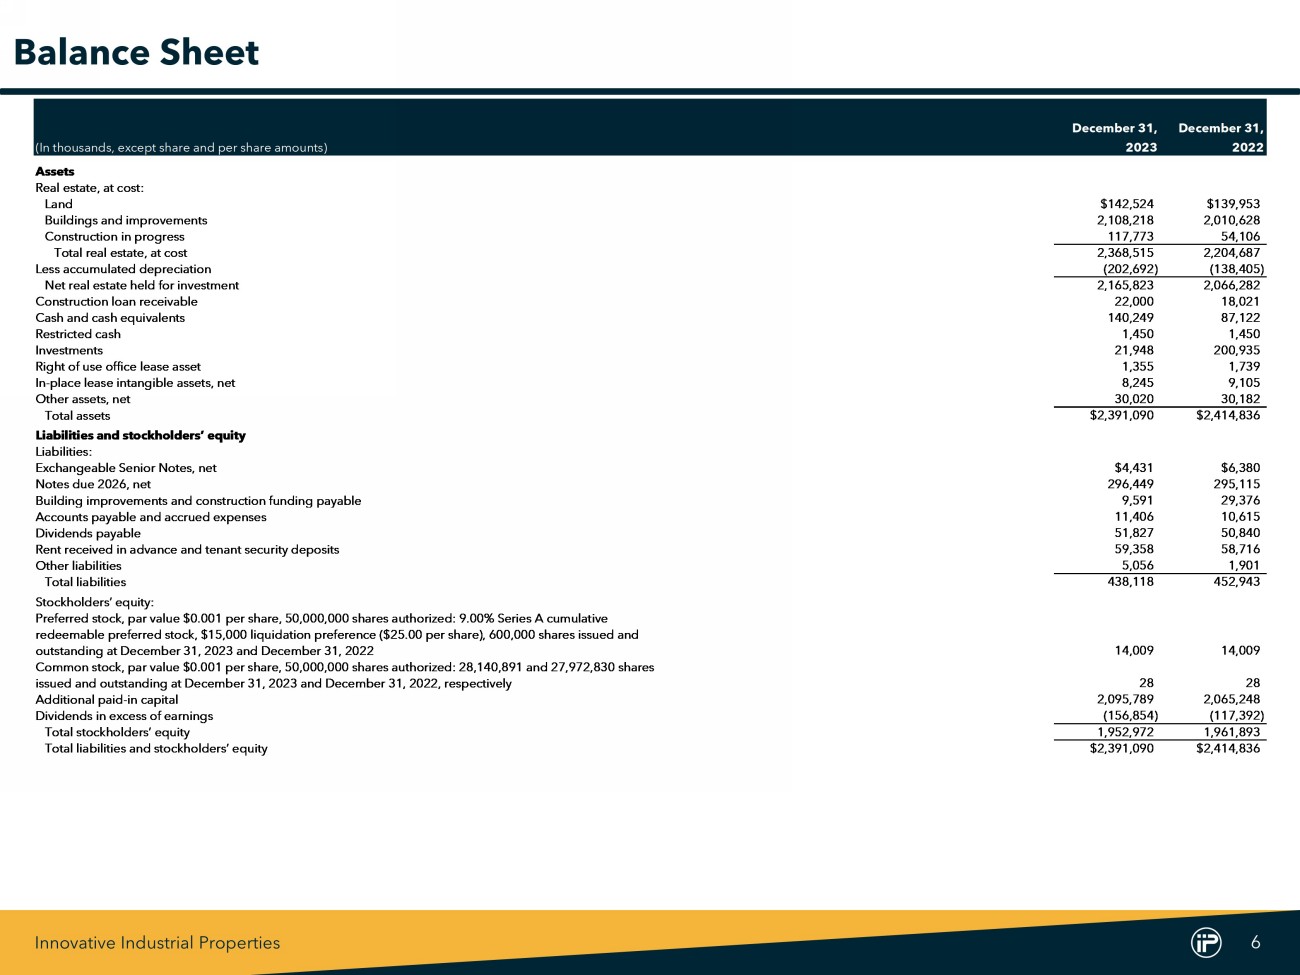
Innovative Industrial Properties 6 December 31, December 31, (In thousands, except share and per share amounts) 2023 2022 Assets Real estate, at cost: Land $142,524 $139,953 Buildings and improvements 2,108,218 2,010,628 Construction in progress 117,773 54,106 Total real estate, at cost 2,368,515 2,204,687 Less accumulated depreciation (202,692) (138,405) Net real estate held for investment 2,165,823 2,066,282 Construction loan receivable 22,000 18,021 Cash and cash equivalents 140,249 87,122 Restricted cash 1,450 1,450 Investments 21,948 200,935 Right of use office lease asset 1,355 1,739 In-place lease intangible assets, net 8,245 9,105 Other assets, net 30,020 30,182 Total assets $2,391,090 $2,414,836 Liabilities and stockholders’ equity Liabilities: Exchangeable Senior Notes, net $4,431 $6,380 Notes due 2026, net 296,449 295,115 Building improvements and construction funding payable 9,591 29,376 Accounts payable and accrued expenses 11,406 10,615 Dividends payable 51,827 50,840 Rent received in advance and tenant security deposits 59,358 58,716 Other liabilities 5,056 1,901 Total liabilities 438,118 452,943 Stockholders’ equity: Preferred stock, par value $0.001 per share, 50,000,000 shares authorized: 9.00% Series A cumulative redeemable preferred stock, $15,000 liquidation preference ($25.00 per share), 600,000 shares issued and outstanding at December 31, 2023 and December 31, 2022 14,009 14,009 Common stock, par value $0.001 per share, 50,000,000 shares authorized: 28,140,891 and 27,972,830 shares issued and outstanding at December 31, 2023 and December 31, 2022, respectively 28 28 Additional paid-in capital 2,095,789 2,065,248 Dividends in excess of earnings (156,854) (117,392) Total stockholders’ equity 1,952,972 1,961,893 Total liabilities and stockholders’ equity $2,391,090 $2,414,836 Balance Sheet
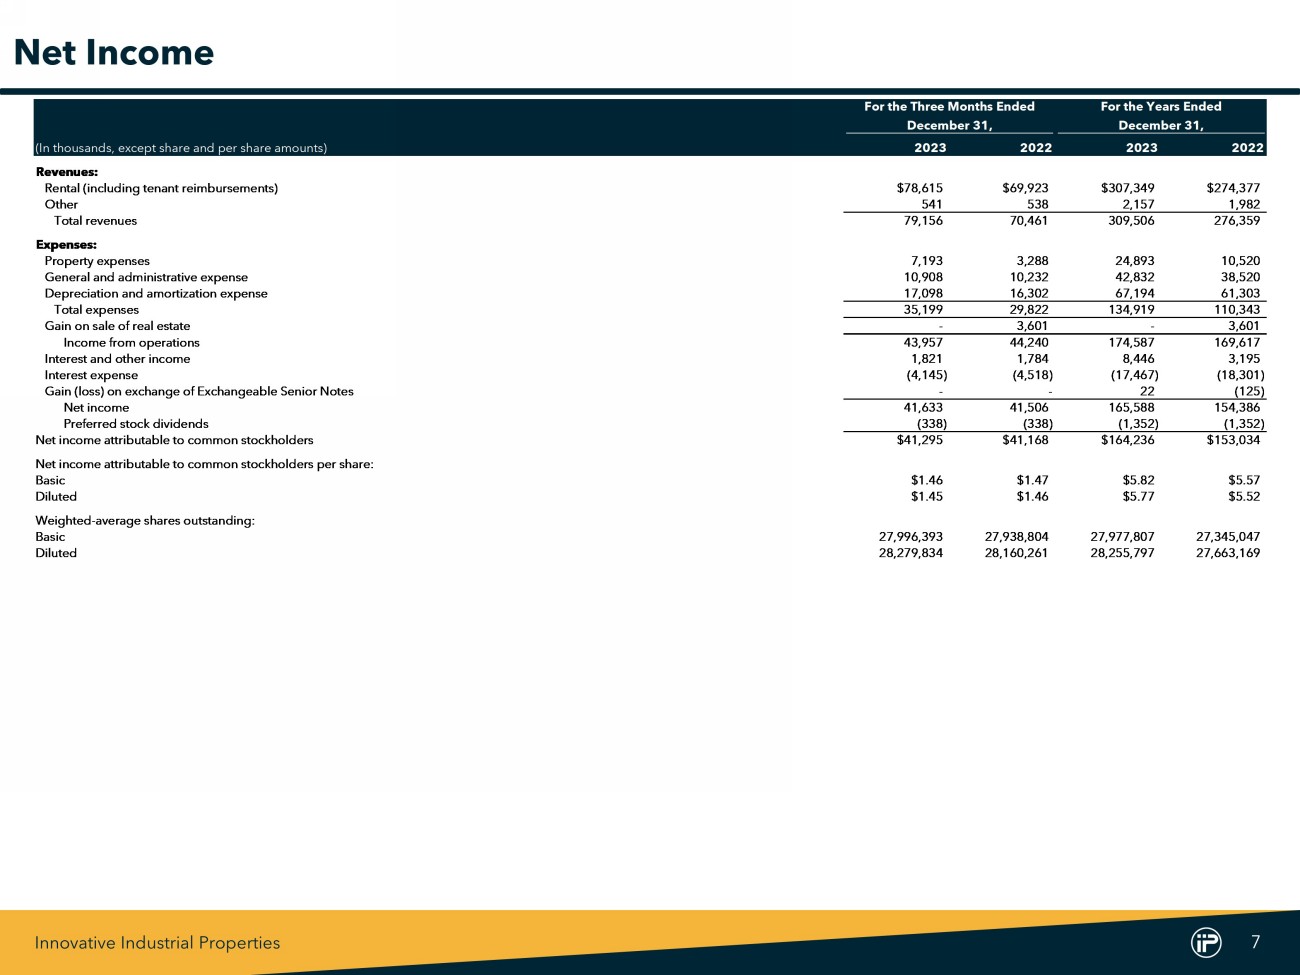
Innovative Industrial Properties 7 For the Three Months Ended For the Years Ended December 31, December 31, (In thousands, except share and per share amounts) 2023 2022 2023 2022 Revenues: Rental (including tenant reimbursements) $78,615 $69,923 $307,349 $274,377 Other 541 538 2,157 1,982 Total revenues 79,156 70,461 309,506 276,359 Expenses: Property expenses 7,193 3,288 24,893 10,520 General and administrative expense 10,908 10,232 42,832 38,520 Depreciation and amortization expense 17,098 16,302 67,194 61,303 Total expenses 35,199 29,822 134,919 110,343 Gain on sale of real estate - 3,601 - 3,601 Income from operations 43,957 44,240 174,587 169,617 Interest and other income 1,821 1,784 8,446 3,195 Interest expense (4,145) (4,518) (17,467) (18,301) Gain (loss) on exchange of Exchangeable Senior Notes - - 22 (125) Net income 41,633 41,506 165,588 154,386 Preferred stock dividends (338) (338) (1,352) (1,352) Net income attributable to common stockholders $41,295 $41,168 $164,236 $153,034 Net income attributable to common stockholders per share: Basic $1.46 $1.47 $5.82 $5.57 Diluted $1.45 $1.46 $5.77 $5.52 Weighted-average shares outstanding: Basic 27,996,393 27,938,804 27,977,807 27,345,047 Diluted 28,279,834 28,160,261 28,255,797 27,663,169 Net Income
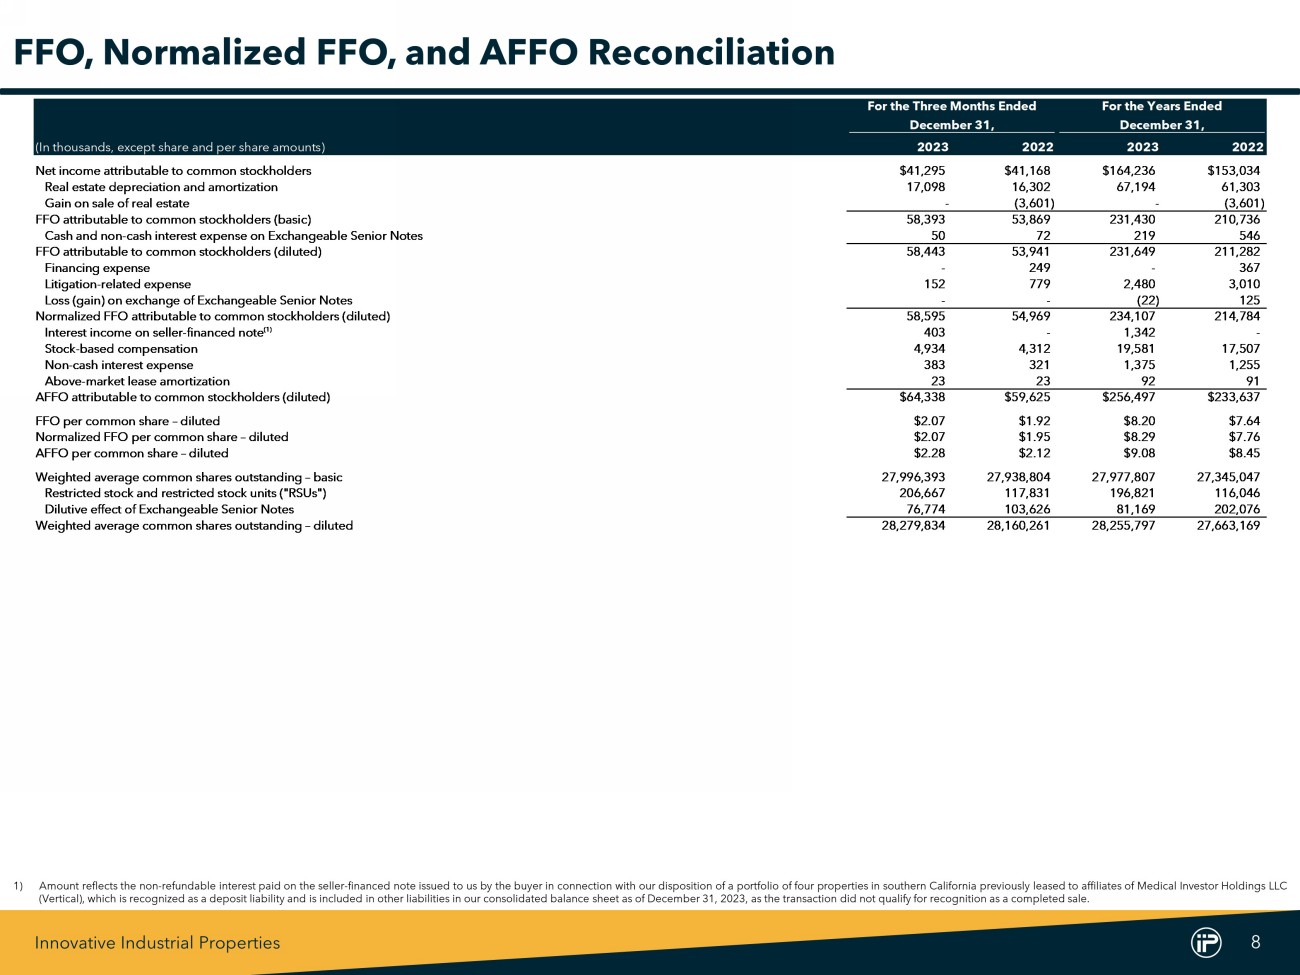
Innovative Industrial Properties 8 For the Three Months Ended For the Years Ended December 31, December 31, (In thousands, except share and per share amounts) 2023 2022 2023 2022 Net income attributable to common stockholders $41,295 $41,168 $164,236 $153,034 Real estate depreciation and amortization 17,098 16,302 67,194 61,303 Gain on sale of real estate - (3,601) - (3,601) FFO attributable to common stockholders (basic) 58,393 53,869 231,430 210,736 Cash and non-cash interest expense on Exchangeable Senior Notes 50 72 219 546 FFO attributable to common stockholders (diluted) 58,443 53,941 231,649 211,282 Financing expense - 249 - 367 Litigation-related expense 152 779 2,480 3,010 Loss (gain) on exchange of Exchangeable Senior Notes - - (22) 125 Normalized FFO attributable to common stockholders (diluted) 58,595 54,969 234,107 214,784 Interest income on seller-financed note (1) 403 - 1,342 - Stock-based compensation 4,934 4,312 19,581 17,507 Non-cash interest expense 383 321 1,375 1,255 Above-market lease amortization 23 23 92 91 AFFO attributable to common stockholders (diluted) $64,338 $59,625 $256,497 $233,637 FFO per common share – diluted $2.07 $1.92 $8.20 $7.64 Normalized FFO per common share – diluted $2.07 $1.95 $8.29 $7.76 AFFO per common share – diluted $2.28 $2.12 $9.08 $8.45 Weighted average common shares outstanding – basic 27,996,393 27,938,804 27,977,807 27,345,047 Restricted stock and restricted stock units ("RSUs") 206,667 117,831 196,821 116,046 Dilutive effect of Exchangeable Senior Notes 76,774 103,626 81,169 202,076 Weighted average common shares outstanding – diluted 28,279,834 28,160,261 28,255,797 27,663,169 FFO, Normalized FFO, and AFFO Reconciliation 1) Amount reflects the non - refundable interest paid on the seller - financed note issued to us by the buyer in connection with our disposition of a portfolio of four properties in southern California previously leased to affiliates of Medical Investor Holdings LLC (Vertical), which is recognized as a deposit liability and is included in other liabilities in our consolidated balance sheet as of December 31 , 2023 , as the transaction did not qualify for recognition as a completed sale .
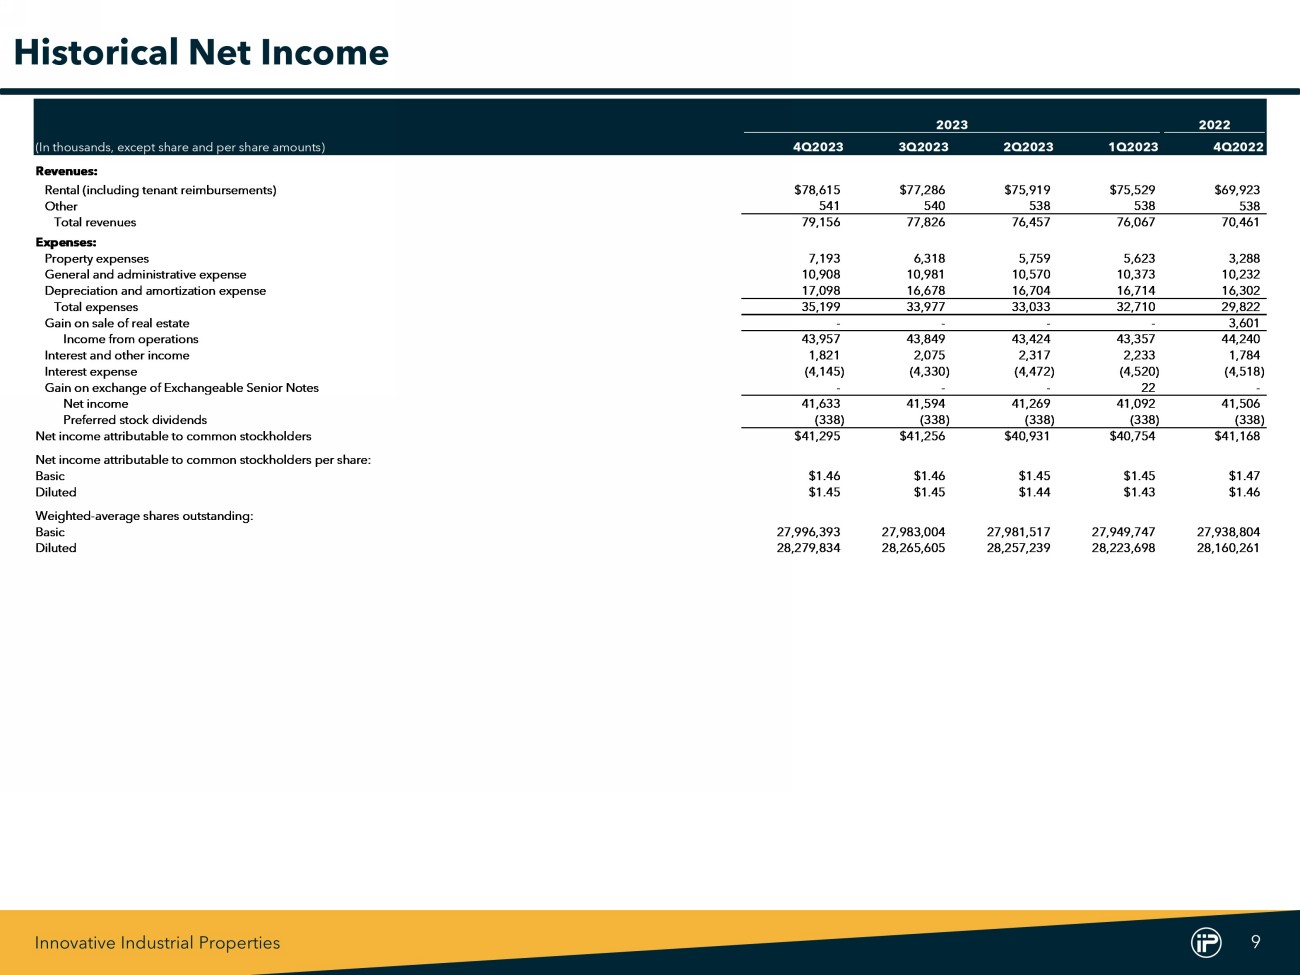
Innovative Industrial Properties 9 2023 2022 (In thousands, except share and per share amounts) 4Q2023 3Q2023 2Q2023 1Q2023 4Q2022 Revenues: Rental (including tenant reimbursements) $78,615 $77,286 $75,919 $75,529 $69,923 Other 541 540 538 538 538 Total revenues 79,156 77,826 76,457 76,067 70,461 Expenses: Property expenses 7,193 6,318 5,759 5,623 3,288 General and administrative expense 10,908 10,981 10,570 10,373 10,232 Depreciation and amortization expense 17,098 16,678 16,704 16,714 16,302 Total expenses 35,199 33,977 33,033 32,710 29,822 Gain on sale of real estate - - - - 3,601 Income from operations 43,957 43,849 43,424 43,357 44,240 Interest and other income 1,821 2,075 2,317 2,233 1,784 Interest expense (4,145) (4,330) (4,472) (4,520) (4,518) Gain on exchange of Exchangeable Senior Notes - - - 22 - Net income 41,633 41,594 41,269 41,092 41,506 Preferred stock dividends (338) (338) (338) (338) (338) Net income attributable to common stockholders $41,295 $41,256 $40,931 $40,754 $41,168 Net income attributable to common stockholders per share: Basic $1.46 $1.46 $1.45 $1.45 $1.47 Diluted $1.45 $1.45 $1.44 $1.43 $1.46 Weighted-average shares outstanding: Basic 27,996,393 27,983,004 27,981,517 27,949,747 27,938,804 Diluted 28,279,834 28,265,605 28,257,239 28,223,698 28,160,261 Historical Net Income
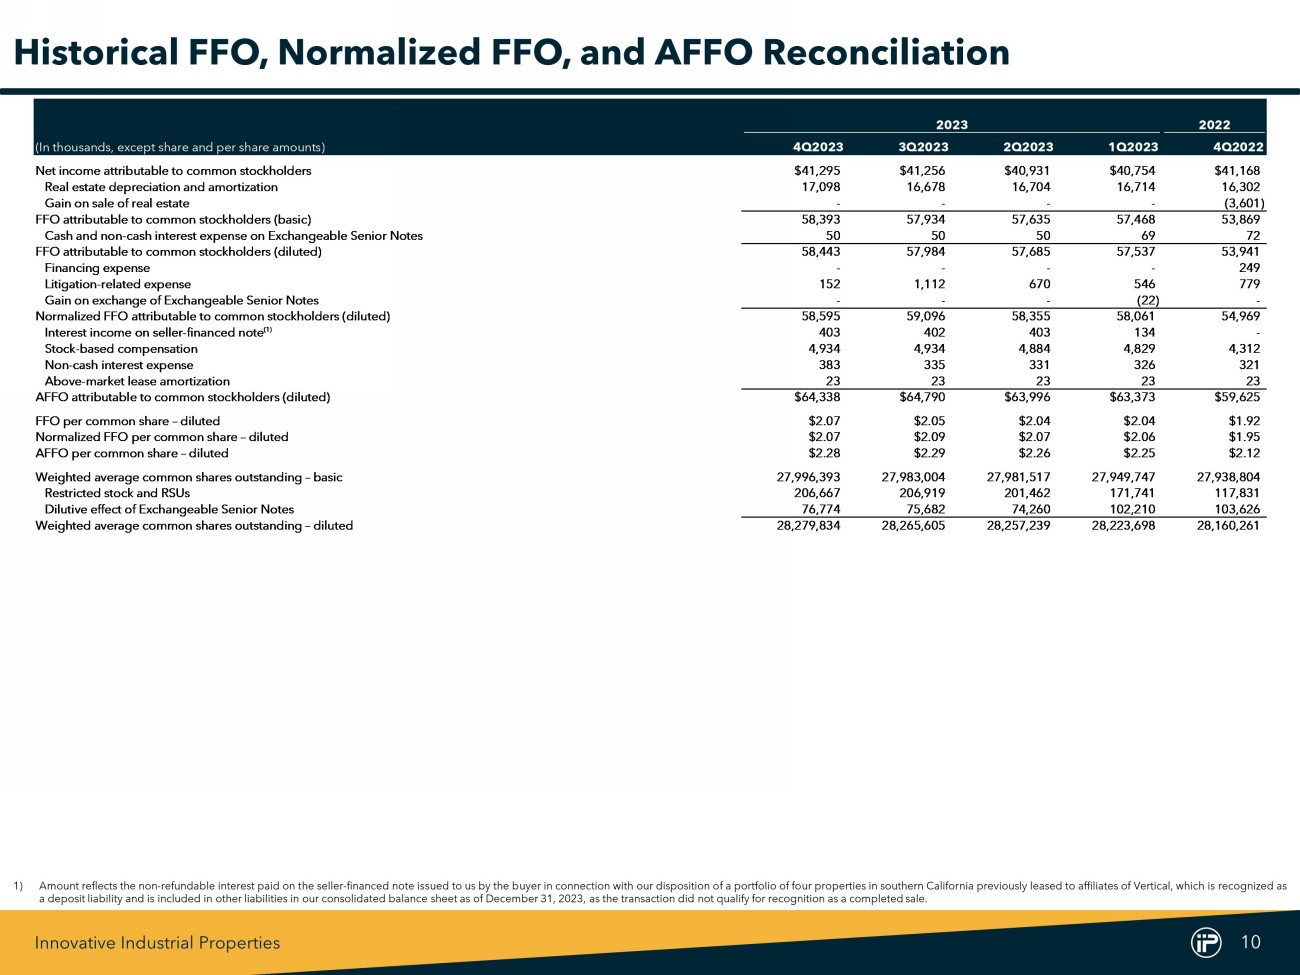
Innovative Industrial Properties 10 2023 2022 (In thousands, except share and per share amounts) 4Q2023 3Q2023 2Q2023 1Q2023 4Q2022 Net income attributable to common stockholders $41,295 $41,256 $40,931 $40,754 $41,168 Real estate depreciation and amortization 17,098 16,678 16,704 16,714 16,302 Gain on sale of real estate - - - - (3,601) FFO attributable to common stockholders (basic) 58,393 57,934 57,635 57,468 53,869 Cash and non-cash interest expense on Exchangeable Senior Notes 50 50 50 69 72 FFO attributable to common stockholders (diluted) 58,443 57,984 57,685 57,537 53,941 Financing expense - - - - 249 Litigation-related expense 152 1,112 670 546 779 Gain on exchange of Exchangeable Senior Notes - - - (22) - Normalized FFO attributable to common stockholders (diluted) 58,595 59,096 58,355 58,061 54,969 Interest income on seller-financed note (1) 403 402 403 134 - Stock-based compensation 4,934 4,934 4,884 4,829 4,312 Non-cash interest expense 383 335 331 326 321 Above-market lease amortization 23 23 23 23 23 AFFO attributable to common stockholders (diluted) $64,338 $64,790 $63,996 $63,373 $59,625 FFO per common share – diluted $2.07 $2.05 $2.04 $2.04 $1.92 Normalized FFO per common share – diluted $2.07 $2.09 $2.07 $2.06 $1.95 AFFO per common share – diluted $2.28 $2.29 $2.26 $2.25 $2.12 Weighted average common shares outstanding – basic 27,996,393 27,983,004 27,981,517 27,949,747 27,938,804 Restricted stock and RSUs 206,667 206,919 201,462 171,741 117,831 Dilutive effect of Exchangeable Senior Notes 76,774 75,682 74,260 102,210 103,626 Weighted average common shares outstanding – diluted 28,279,834 28,265,605 28,257,239 28,223,698 28,160,261 Historical FFO, Normalized FFO, and AFFO Reconciliation 1) Amount reflects the non - refundable interest paid on the seller - financed note issued to us by the buyer in connection with our disposition of a portfolio of four properties in southern California previously leased to affiliates of Vertical, which is recognized as a deposit liability and is included in other liabilities in our consolidated balance sheet as of December 31 , 2023 , as the transaction did not qualify for recognition as a completed sale .
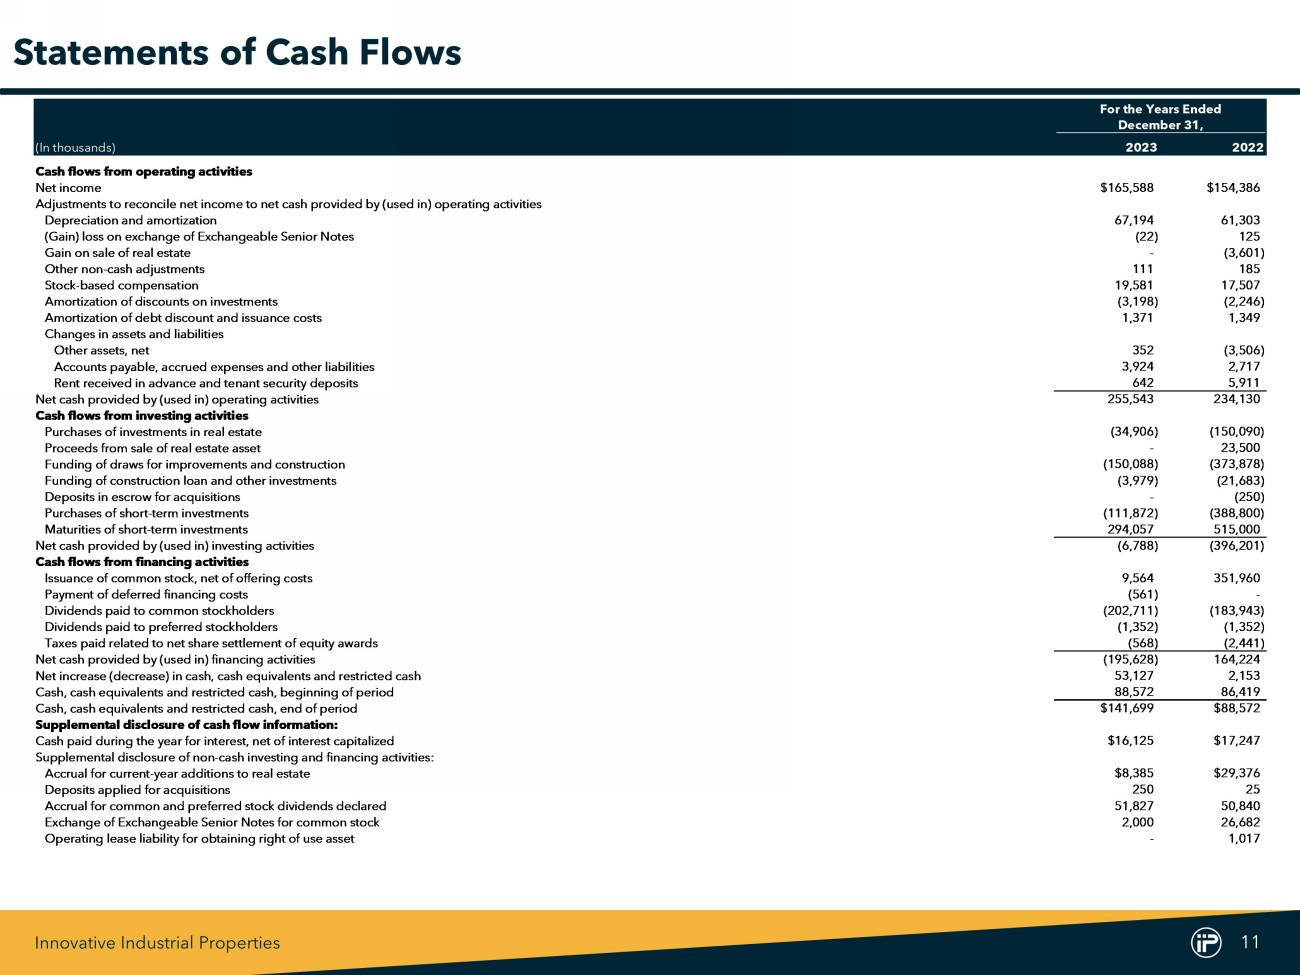
Innovative Industrial Properties 11 For the Years Ended December 31, (In thousands) 2023 2022 Cash flows from operating activities Net income $165,588 $154,386 Adjustments to reconcile net income to net cash provided by (used in) operating activities Depreciation and amortization 67,194 61,303 (Gain) loss on exchange of Exchangeable Senior Notes (22) 125 Gain on sale of real estate - (3,601) Other non-cash adjustments 111 185 Stock-based compensation 19,581 17,507 Amortization of discounts on investments (3,198) (2,246) Amortization of debt discount and issuance costs 1,371 1,349 Changes in assets and liabilities Other assets, net 352 (3,506) Accounts payable, accrued expenses and other liabilities 3,924 2,717 Rent received in advance and tenant security deposits 642 5,911 Net cash provided by (used in) operating activities 255,543 234,130 Cash flows from investing activities Purchases of investments in real estate (34,906) (150,090) Proceeds from sale of real estate asset - 23,500 Funding of draws for improvements and construction (150,088) (373,878) Funding of construction loan and other investments (3,979) (21,683) Deposits in escrow for acquisitions - (250) Purchases of short-term investments (111,872) (388,800) Maturities of short-term investments 294,057 515,000 Net cash provided by (used in) investing activities (6,788) (396,201) Cash flows from financing activities Issuance of common stock, net of offering costs 9,564 351,960 Payment of deferred financing costs (561) - Dividends paid to common stockholders (202,711) (183,943) Dividends paid to preferred stockholders (1,352) (1,352) Taxes paid related to net share settlement of equity awards (568) (2,441) Net cash provided by (used in) financing activities (195,628) 164,224 Net increase (decrease) in cash, cash equivalents and restricted cash 53,127 2,153 Cash, cash equivalents and restricted cash, beginning of period 88,572 86,419 Cash, cash equivalents and restricted cash, end of period $141,699 $88,572 Supplemental disclosure of cash flow information: Cash paid during the year for interest, net of interest capitalized $16,125 $17,247 Supplemental disclosure of non-cash investing and financing activities: Accrual for current-year additions to real estate $8,385 $29,376 Deposits applied for acquisitions 250 25 Accrual for common and preferred stock dividends declared 51,827 50,840 Exchange of Exchangeable Senior Notes for common stock 2,000 26,682 Operating lease liability for obtaining right of use asset - 1,017 Statements of Cash Flows
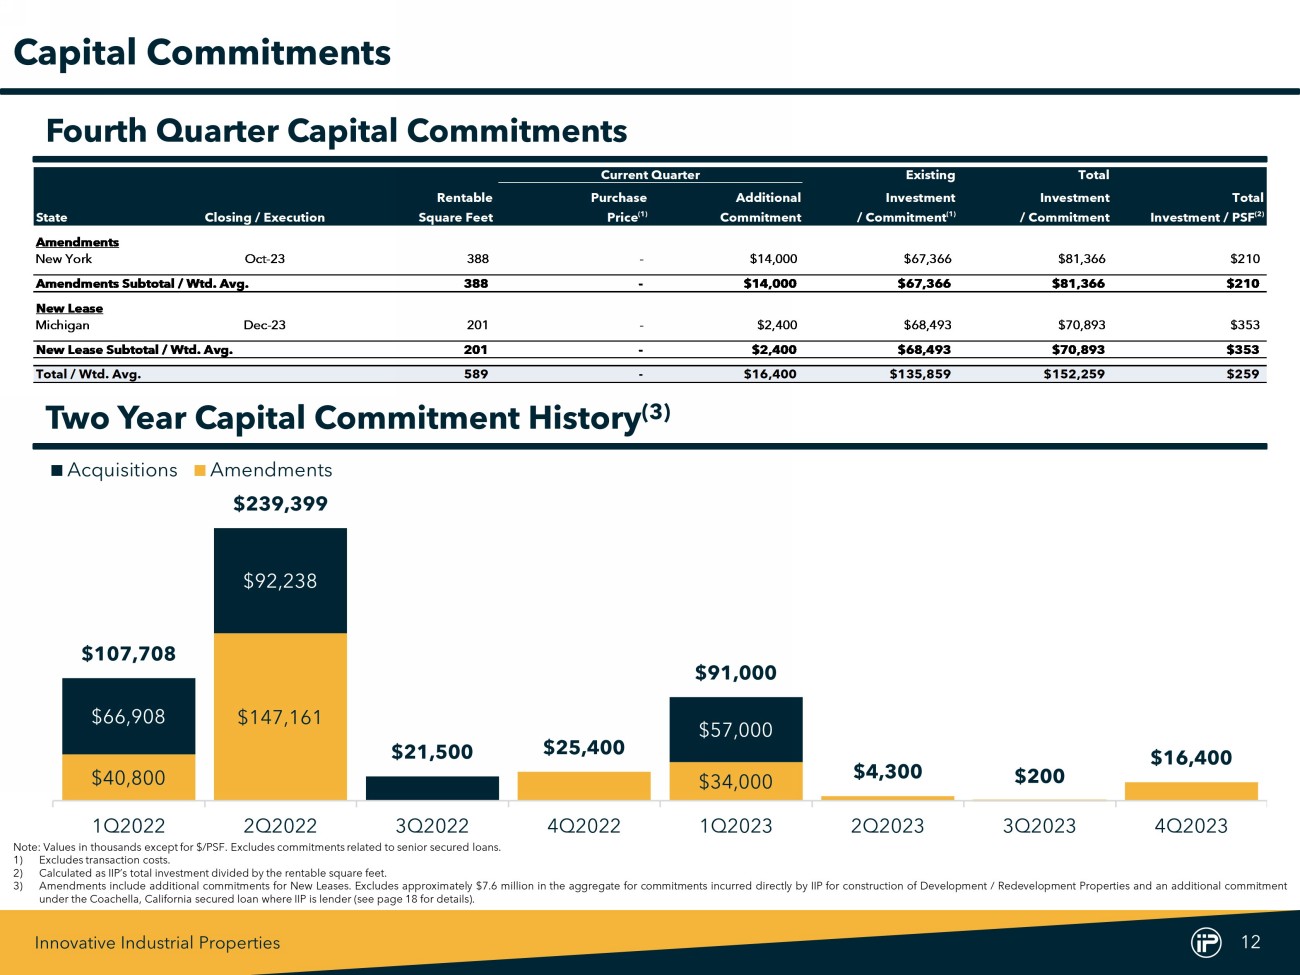
Innovative Industrial Properties 12 Current Quarter Existing Total Rentable Purchase Additional Investment Investment Total State Closing / Execution Square Feet Price (1) Commitment / Commitment (1) / Commitment Investment / PSF (2) Amendments New York Oct-23 388 - $14,000 $67,366 $81,366 $210 Amendments Subtotal / Wtd. Avg. 388 - $14,000 $67,366 $81,366 $210 New Lease Michigan Dec-23 201 - $2,400 $68,493 $70,893 $353 New Lease Subtotal / Wtd. Avg. 201 - $2,400 $68,493 $70,893 $353 Total / Wtd. Avg. 589 - $16,400 $135,859 $152,259 $259 Capital Commitments Note : Values in thousands except for $ /PSF . Excludes commitments related to senior secured loans . 1) Excludes transaction costs . 2) Calculated as IIP’s total investment divided by the rentable square feet . 3) Amendments include additional commitments for New Leases . Excludes approximately $ 7 . 6 million in the aggregate for commitments incurred directly by IIP for construction of Development / Redevelopment Properties and an additional commitment under the Coachella, California secured loan where IIP is lender (see page 18 for details) . $40,800 $147,161 $34,000 $66,908 $92,238 $57,000 $107,708 $239,399 $21,500 $25,400 $91,000 $4,300 $200 $16,400 1Q2022 2Q2022 3Q2022 4Q2022 1Q2023 2Q2023 3Q2023 4Q2023 Acquisitions Amendments Fourth Quarter Capital Commitments Two Year Capital Commitment History (3)
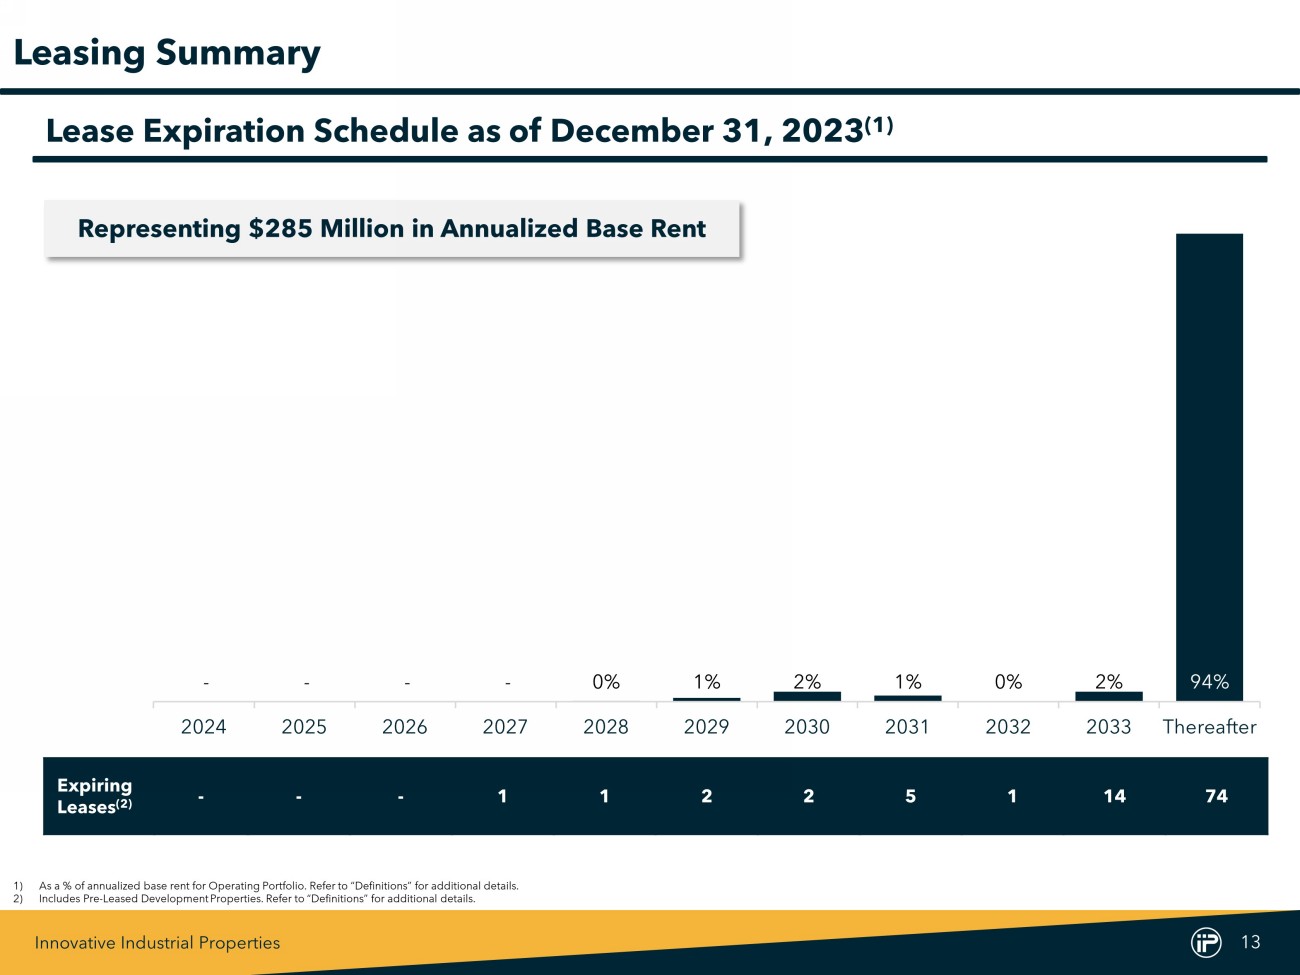
Innovative Industrial Properties 13 1) As a % of annualized base rent for Operating Portfolio . Refer to “Definitions” for additional details . 2) Includes Pre - Leased Development Properties . Refer to “Definitions” for additional details . Leasing Summary Lease Expiration Schedule as of December 31, 2023 (1) - - - - 0% 1% 2% 1% 0% 2% 94% 2024 2025 2026 2027 2028 2029 2030 2031 2032 2033 Thereafter Representing $285 Million in A nnualized Base R ent Expiring Leases (2) - - - 1 1 2 2 5 1 14 74
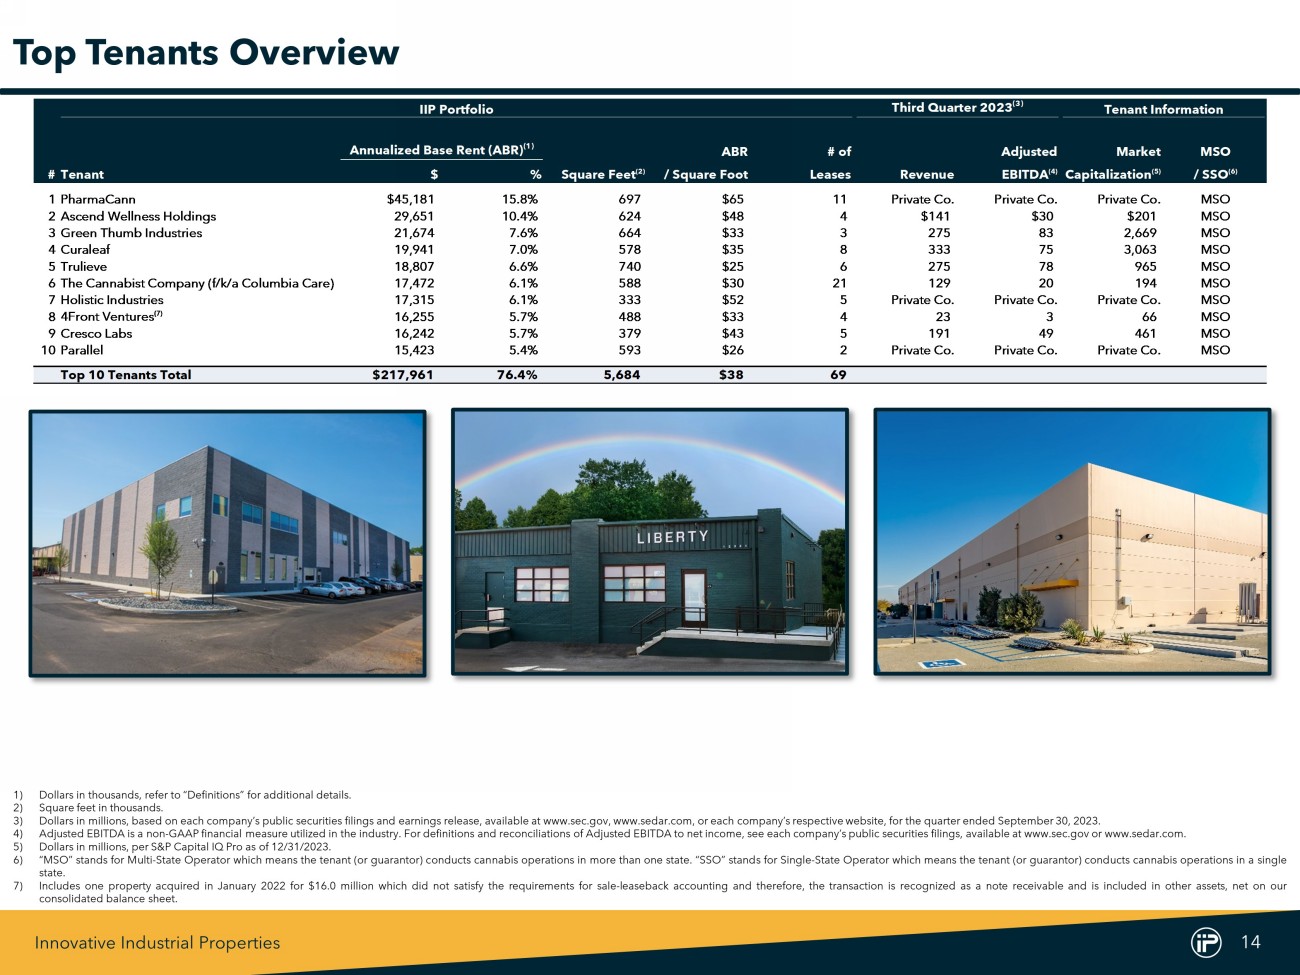
Innovative Industrial Properties 14 IIP Portfolio Third Quarter 2023 (3) Tenant Information Annualized Base Rent (ABR) (1) ABR # of Adjusted Market MSO #Tenant $ % Square Feet (2) / Square Foot Leases Revenue EBITDA (4) Capitalization (5) / SSO (6) 1PharmaCann $45,181 15.8% 697 $65 11 Private Co. Private Co. Private Co. MSO 2Ascend Wellness Holdings 29,651 10.4% 624 $48 4 $141 $30 $201 MSO 3Green Thumb Industries 21,674 7.6% 664 $33 3 275 83 2,669 MSO 4Curaleaf 19,941 7.0% 578 $35 8 333 75 3,063 MSO 5Trulieve 18,807 6.6% 740 $25 6 275 78 965 MSO 6The Cannabist Company (f/k/a Columbia Care) 17,472 6.1% 588 $30 21 129 20 194 MSO 7Holistic Industries 17,315 6.1% 333 $52 5 Private Co. Private Co. Private Co. MSO 8 4Front Ventures (7) 16,255 5.7% 488 $33 4 23 3 66 MSO 9Cresco Labs 16,242 5.7% 379 $43 5 191 49 461 MSO 10Parallel 15,423 5.4% 593 $26 2 Private Co. Private Co. Private Co. MSO Top 10 Tenants Total $217,961 76.4% 5,684 $38 69 Top Tenants Overview 1) Dollars in thousands, r efer to “Definitions” for additional details . 2) Square feet in thousands . 3) Dollars in millions, based on each company’s public securities filings and earnings release, available at www . sec . gov, www . sedar . com, or each company’s respective website, for the quarter ended September 30 , 2023 . 4) Adjusted EBITDA is a non - GAAP financial measure utilized in the industry . For definitions and reconciliations of Adjusted EBITDA to net income, see each company’s public securities filings, available at www . sec . gov or www . sedar . com . 5) Dollars in millions, per S&P Capital IQ Pro as of 12 / 31 / 2023 . 6) “MSO” stands for Multi - State Operator which means the tenant (or guarantor) conducts cannabis operations in more than one state . “SSO” stands for Single - State O perator which means the tenant (or guarantor) conducts cannabis operations in a single state . 7) Includes one property acquired in January 2022 for $ 16 . 0 million which did not satisfy the requirements for sale - leaseback accounting and therefore, the transaction is recognized as a note receivable and is included in other assets, net on our consolidated balance sheet .
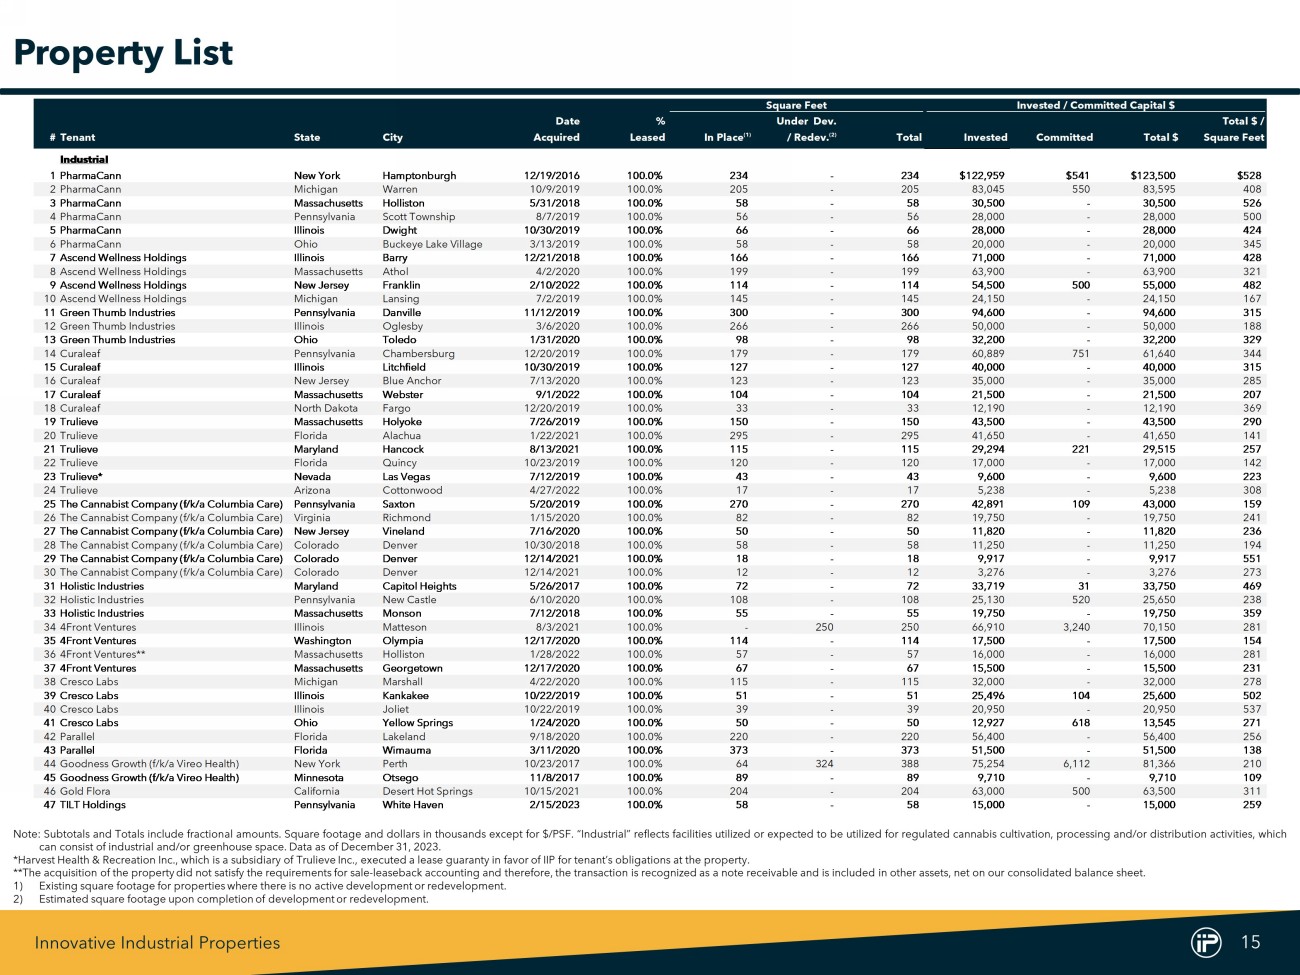
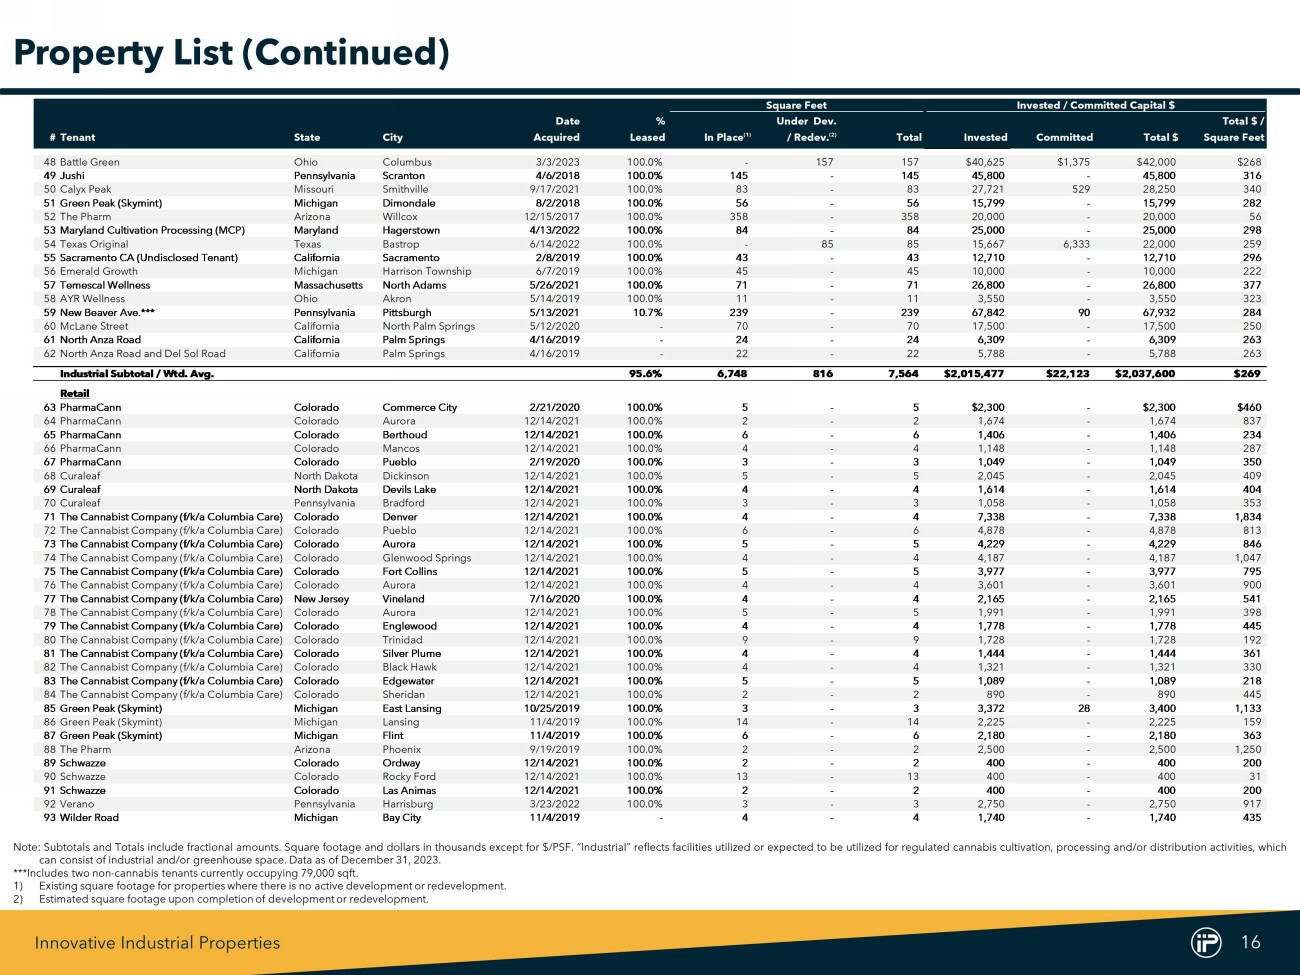
Innovative Industrial Properties 15 Square Feet Invested / Committed Capital $ Date % Under Dev. Total $ / #Tenant State City Acquired Leased In Place (1) / Redev. (2) Total Invested Committed Total $ Square Feet Industrial 1PharmaCann New York Hamptonburgh 12/19/2016 100.0% 234 - 234 $122,959 $541 $123,500 $528 2PharmaCann Michigan Warren 10/9/2019 100.0% 205 - 205 83,045 550 83,595 408 3PharmaCann Massachusetts Holliston 5/31/2018 100.0% 58 - 58 30,500 - 30,500 526 4PharmaCann Pennsylvania Scott Township 8/7/2019 100.0% 56 - 56 28,000 - 28,000 500 5PharmaCann Illinois Dwight 10/30/2019 100.0% 66 - 66 28,000 - 28,000 424 6PharmaCann Ohio Buckeye Lake Village 3/13/2019 100.0% 58 - 58 20,000 - 20,000 345 7Ascend Wellness Holdings Illinois Barry 12/21/2018 100.0% 166 - 166 71,000 - 71,000 428 8Ascend Wellness Holdings Massachusetts Athol 4/2/2020 100.0% 199 - 199 63,900 - 63,900 321 9Ascend Wellness Holdings New Jersey Franklin 2/10/2022 100.0% 114 - 114 54,500 500 55,000 482 10Ascend Wellness Holdings Michigan Lansing 7/2/2019 100.0% 145 - 145 24,150 - 24,150 167 11Green Thumb Industries Pennsylvania Danville 11/12/2019 100.0% 300 - 300 94,600 - 94,600 315 12Green Thumb Industries Illinois Oglesby 3/6/2020 100.0% 266 - 266 50,000 - 50,000 188 13Green Thumb Industries Ohio Toledo 1/31/2020 100.0% 98 - 98 32,200 - 32,200 329 14Curaleaf Pennsylvania Chambersburg 12/20/2019 100.0% 179 - 179 60,889 751 61,640 344 15Curaleaf Illinois Litchfield 10/30/2019 100.0% 127 - 127 40,000 - 40,000 315 16Curaleaf New Jersey Blue Anchor 7/13/2020 100.0% 123 - 123 35,000 - 35,000 285 17Curaleaf Massachusetts Webster 9/1/2022 100.0% 104 - 104 21,500 - 21,500 207 18Curaleaf North Dakota Fargo 12/20/2019 100.0% 33 - 33 12,190 - 12,190 369 19Trulieve Massachusetts Holyoke 7/26/2019 100.0% 150 - 150 43,500 - 43,500 290 20Trulieve Florida Alachua 1/22/2021 100.0% 295 - 295 41,650 - 41,650 141 21Trulieve Maryland Hancock 8/13/2021 100.0% 115 - 115 29,294 221 29,515 257 22Trulieve Florida Quincy 10/23/2019 100.0% 120 - 120 17,000 - 17,000 142 23Trulieve* Nevada Las Vegas 7/12/2019 100.0% 43 - 43 9,600 - 9,600 223 24Trulieve Arizona Cottonwood 4/27/2022 100.0% 17 - 17 5,238 - 5,238 308 25The Cannabist Company (f/k/a Columbia Care) Pennsylvania Saxton 5/20/2019 100.0% 270 - 270 42,891 109 43,000 159 26The Cannabist Company (f/k/a Columbia Care) Virginia Richmond 1/15/2020 100.0% 82 - 82 19,750 - 19,750 241 27The Cannabist Company (f/k/a Columbia Care) New Jersey Vineland 7/16/2020 100.0% 50 - 50 11,820 - 11,820 236 28The Cannabist Company (f/k/a Columbia Care) Colorado Denver 10/30/2018 100.0% 58 - 58 11,250 - 11,250 194 29The Cannabist Company (f/k/a Columbia Care) Colorado Denver 12/14/2021 100.0% 18 - 18 9,917 - 9,917 551 30The Cannabist Company (f/k/a Columbia Care) Colorado Denver 12/14/2021 100.0% 12 - 12 3,276 - 3,276 273 31Holistic Industries Maryland Capitol Heights 5/26/2017 100.0% 72 - 72 33,719 31 33,750 469 32Holistic Industries Pennsylvania New Castle 6/10/2020 100.0% 108 - 108 25,130 520 25,650 238 33Holistic Industries Massachusetts Monson 7/12/2018 100.0% 55 - 55 19,750 - 19,750 359 344Front Ventures Illinois Matteson 8/3/2021 100.0% - 250 250 66,910 3,240 70,150 281 354Front Ventures Washington Olympia 12/17/2020 100.0% 114 - 114 17,500 - 17,500 154 364Front Ventures** Massachusetts Holliston 1/28/2022 100.0% 57 - 57 16,000 - 16,000 281 374Front Ventures Massachusetts Georgetown 12/17/2020 100.0% 67 - 67 15,500 - 15,500 231 38Cresco Labs Michigan Marshall 4/22/2020 100.0% 115 - 115 32,000 - 32,000 278 39Cresco Labs Illinois Kankakee 10/22/2019 100.0% 51 - 51 25,496 104 25,600 502 40Cresco Labs Illinois Joliet 10/22/2019 100.0% 39 - 39 20,950 - 20,950 537 41Cresco Labs Ohio Yellow Springs 1/24/2020 100.0% 50 - 50 12,927 618 13,545 271 42Parallel Florida Lakeland 9/18/2020 100.0% 220 - 220 56,400 - 56,400 256 43Parallel Florida Wimauma 3/11/2020 100.0% 373 - 373 51,500 - 51,500 138 44Goodness Growth (f/k/a Vireo Health) New York Perth 10/23/2017 100.0% 64 324 388 75,254 6,112 81,366 210 45Goodness Growth (f/k/a Vireo Health) Minnesota Otsego 11/8/2017 100.0% 89 - 89 9,710 - 9,710 109 46Gold Flora California Desert Hot Springs 10/15/2021 100.0% 204 - 204 63,000 500 63,500 311 47TILT Holdings Pennsylvania White Haven 2/15/2023 100.0% 58 - 58 15,000 - 15,000 259 Note : Subtotals and Totals include fractional amounts . Square footage and dollars in thousands except for $ /PSF . “Industrial” reflects facilities utilized or expected to be utilized for regulated cannabis cultivation, processing and/or distribution activities, which can consist of industrial and/or greenhouse space . Data as of December 31 , 2023 . * Harvest Health & Recreation Inc . , which is a subsidiary of Trulieve Inc . , executed a lease guaranty in favor of IIP for tenant’s obligations at the property . **The acquisition of the property did not satisfy the requirements for sale - leaseback accounting and therefore, the transaction is recognized as a note receivable and is included in other assets, net on our consolidated balance sheet . 1) Existing square footage for properties where there is no active development or redevelopment . 2) Estimated square footage upon completion of development or redevelopment . Property List
Innovative Industrial Properties 16 Square Feet Invested / Committed Capital $ Date % Under Dev. Total $ / #Tenant State City Acquired Leased In Place (1) / Redev. (2) Total Invested Committed Total $ Square Feet 48Battle Green Ohio Columbus 3/3/2023 100.0% - 157 157 $40,625 $1,375 $42,000 $268 49Jushi Pennsylvania Scranton 4/6/2018 100.0% 145 - 145 45,800 - 45,800 316 50Calyx Peak Missouri Smithville 9/17/2021 100.0% 83 - 83 27,721 529 28,250 340 51Green Peak (Skymint) Michigan Dimondale 8/2/2018 100.0% 56 - 56 15,799 - 15,799 282 52The Pharm Arizona Willcox 12/15/2017 100.0% 358 - 358 20,000 - 20,000 56 53Maryland Cultivation Processing (MCP) Maryland Hagerstown 4/13/2022 100.0% 84 - 84 25,000 - 25,000 298 54Texas Original Texas Bastrop 6/14/2022 100.0% - 85 85 15,667 6,333 22,000 259 55Sacramento CA (Undisclosed Tenant) California Sacramento 2/8/2019 100.0% 43 - 43 12,710 - 12,710 296 56Emerald Growth Michigan Harrison Township 6/7/2019 100.0% 45 - 45 10,000 - 10,000 222 57Temescal Wellness Massachusetts North Adams 5/26/2021 100.0% 71 - 71 26,800 - 26,800 377 58AYR Wellness Ohio Akron 5/14/2019 100.0% 11 - 11 3,550 - 3,550 323 59New Beaver Ave.*** Pennsylvania Pittsburgh 5/13/2021 10.7% 239 - 239 67,842 90 67,932 284 60McLane Street California North Palm Springs 5/12/2020 - 70 - 70 17,500 - 17,500 250 61North Anza Road California Palm Springs 4/16/2019 - 24 - 24 6,309 - 6,309 263 62North Anza Road and Del Sol Road California Palm Springs 4/16/2019 - 22 - 22 5,788 - 5,788 263 Industrial Subtotal / Wtd. Avg. 95.6% 6,748 816 7,564 $2,015,477 $22,123 $2,037,600 $269 Retail 63PharmaCann Colorado Commerce City 2/21/2020 100.0% 5 - 5 $2,300 - $2,300 $460 64PharmaCann Colorado Aurora 12/14/2021 100.0% 2 - 2 1,674 - 1,674 837 65PharmaCann Colorado Berthoud 12/14/2021 100.0% 6 - 6 1,406 - 1,406 234 66PharmaCann Colorado Mancos 12/14/2021 100.0% 4 - 4 1,148 - 1,148 287 67PharmaCann Colorado Pueblo 2/19/2020 100.0% 3 - 3 1,049 - 1,049 350 68Curaleaf North Dakota Dickinson 12/14/2021 100.0% 5 - 5 2,045 - 2,045 409 69Curaleaf North Dakota Devils Lake 12/14/2021 100.0% 4 - 4 1,614 - 1,614 404 70Curaleaf Pennsylvania Bradford 12/14/2021 100.0% 3 - 3 1,058 - 1,058 353 71The Cannabist Company (f/k/a Columbia Care) Colorado Denver 12/14/2021 100.0% 4 - 4 7,338 - 7,338 1,834 72The Cannabist Company (f/k/a Columbia Care) Colorado Pueblo 12/14/2021 100.0% 6 - 6 4,878 - 4,878 813 73The Cannabist Company (f/k/a Columbia Care) Colorado Aurora 12/14/2021 100.0% 5 - 5 4,229 - 4,229 846 74The Cannabist Company (f/k/a Columbia Care) Colorado Glenwood Springs 12/14/2021 100.0% 4 - 4 4,187 - 4,187 1,047 75The Cannabist Company (f/k/a Columbia Care) Colorado Fort Collins 12/14/2021 100.0% 5 - 5 3,977 - 3,977 795 76The Cannabist Company (f/k/a Columbia Care) Colorado Aurora 12/14/2021 100.0% 4 - 4 3,601 - 3,601 900 77The Cannabist Company (f/k/a Columbia Care) New Jersey Vineland 7/16/2020 100.0% 4 - 4 2,165 - 2,165 541 78The Cannabist Company (f/k/a Columbia Care) Colorado Aurora 12/14/2021 100.0% 5 - 5 1,991 - 1,991 398 79The Cannabist Company (f/k/a Columbia Care) Colorado Englewood 12/14/2021 100.0% 4 - 4 1,778 - 1,778 445 80The Cannabist Company (f/k/a Columbia Care) Colorado Trinidad 12/14/2021 100.0% 9 - 9 1,728 - 1,728 192 81The Cannabist Company (f/k/a Columbia Care) Colorado Silver Plume 12/14/2021 100.0% 4 - 4 1,444 - 1,444 361 82The Cannabist Company (f/k/a Columbia Care) Colorado Black Hawk 12/14/2021 100.0% 4 - 4 1,321 - 1,321 330 83The Cannabist Company (f/k/a Columbia Care) Colorado Edgewater 12/14/2021 100.0% 5 - 5 1,089 - 1,089 218 84The Cannabist Company (f/k/a Columbia Care) Colorado Sheridan 12/14/2021 100.0% 2 - 2 890 - 890 445 85Green Peak (Skymint) Michigan East Lansing 10/25/2019 100.0% 3 - 3 3,372 28 3,400 1,133 86Green Peak (Skymint) Michigan Lansing 11/4/2019 100.0% 14 - 14 2,225 - 2,225 159 87Green Peak (Skymint) Michigan Flint 11/4/2019 100.0% 6 - 6 2,180 - 2,180 363 88The Pharm Arizona Phoenix 9/19/2019 100.0% 2 - 2 2,500 - 2,500 1,250 89Schwazze Colorado Ordway 12/14/2021 100.0% 2 - 2 400 - 400 200 90Schwazze Colorado Rocky Ford 12/14/2021 100.0% 13 - 13 400 - 400 31 91Schwazze Colorado Las Animas 12/14/2021 100.0% 2 - 2 400 - 400 200 92Verano Pennsylvania Harrisburg 3/23/2022 100.0% 3 - 3 2,750 - 2,750 917 93Wilder Road Michigan Bay City 11/4/2019 - 4 - 4 1,740 - 1,740 435 Property List (Continued) Note : Subtotals and Totals include fractional amounts . Square footage and dollars in thousands except for $ /PSF . “Industrial” reflects facilities utilized or expected to be utilized for regulated cannabis cultivation, processing and/or distribution activities, which can consist of industrial and/or greenhouse space . Data as of December 31 , 2023 . ***Includes two non - cannabis tenants currently occupying 79 , 000 sqft . 1) Existing square footage for properties where there is no active development or redevelopment . 2) Estimated square footage upon completion of development or redevelopment .
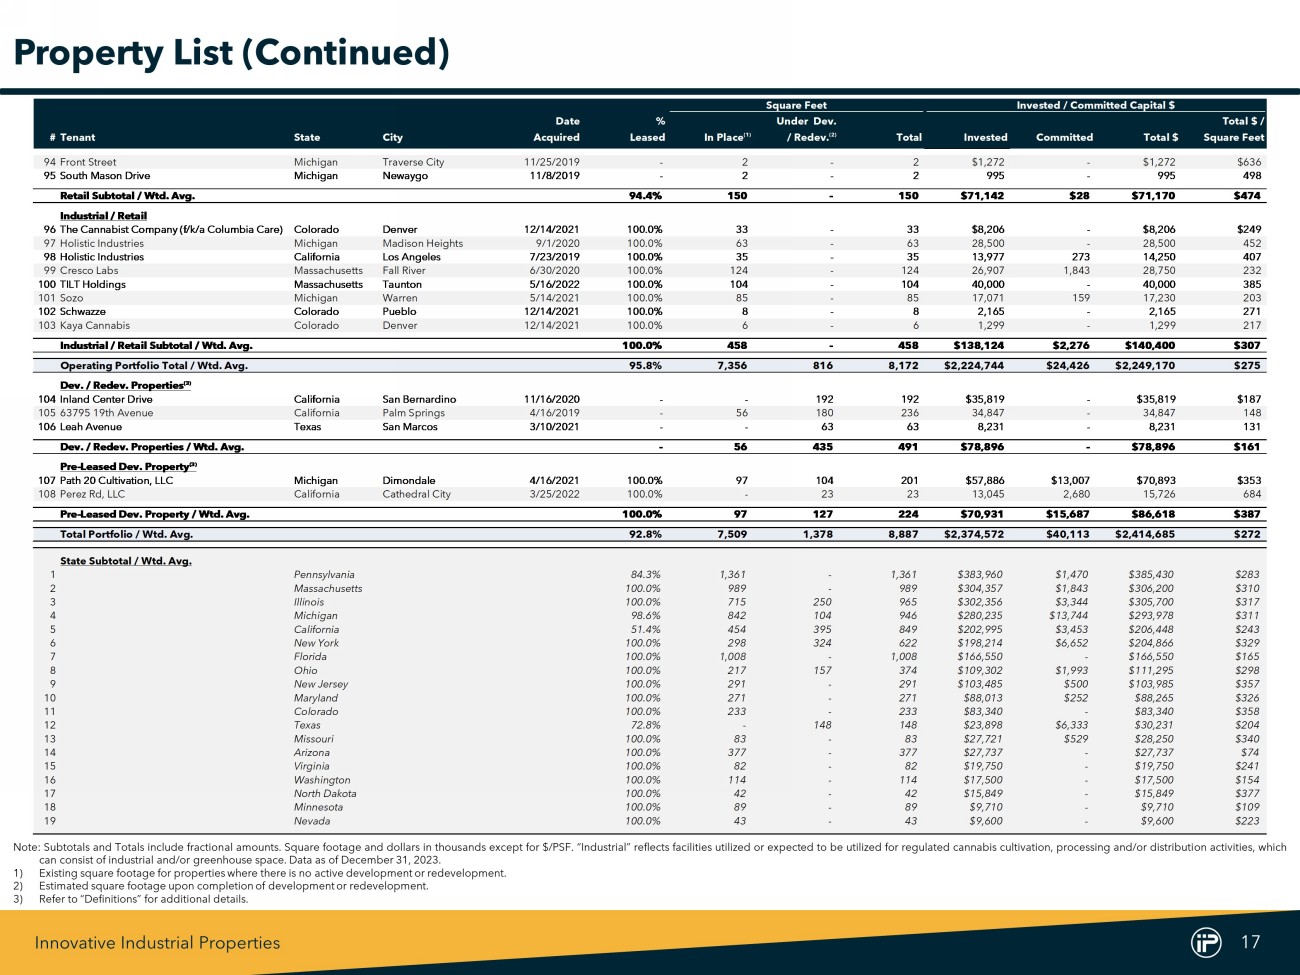
Innovative Industrial Properties 17 Square Feet Invested / Committed Capital $ Date % Under Dev. Total $ / #Tenant State City Acquired Leased In Place (1) / Redev. (2) Total Invested Committed Total $ Square Feet 94Front Street Michigan Traverse City 11/25/2019 - 2 - 2 $1,272 - $1,272 $636 95South Mason Drive Michigan Newaygo 11/8/2019 - 2 - 2 995 - 995 498 Retail Subtotal / Wtd. Avg. 94.4% 150 - 150 $71,142 $28 $71,170 $474 Industrial / Retail 96The Cannabist Company (f/k/a Columbia Care) Colorado Denver 12/14/2021 100.0% 33 - 33 $8,206 - $8,206 $249 97Holistic Industries Michigan Madison Heights 9/1/2020 100.0% 63 - 63 28,500 - 28,500 452 98Holistic Industries California Los Angeles 7/23/2019 100.0% 35 - 35 13,977 273 14,250 407 99Cresco Labs Massachusetts Fall River 6/30/2020 100.0% 124 - 124 26,907 1,843 28,750 232 100 TILT Holdings Massachusetts Taunton 5/16/2022 100.0% 104 - 104 40,000 - 40,000 385 101 Sozo Michigan Warren 5/14/2021 100.0% 85 - 85 17,071 159 17,230 203 102 Schwazze Colorado Pueblo 12/14/2021 100.0% 8 - 8 2,165 - 2,165 271 103 Kaya Cannabis Colorado Denver 12/14/2021 100.0% 6 - 6 1,299 - 1,299 217 Industrial / Retail Subtotal / Wtd. Avg. 100.0% 458 - 458 $138,124 $2,276 $140,400 $307 Operating Portfolio Total / Wtd. Avg. 95.8% 7,356 816 8,172 $2,224,744 $24,426 $2,249,170 $275 Dev. / Redev. Properties (3) 104 Inland Center Drive California San Bernardino 11/16/2020 - - 192 192 $35,819 - $35,819 $187 105 63795 19th Avenue California Palm Springs 4/16/2019 - 56 180 236 34,847 - 34,847 148 106 Leah Avenue Texas San Marcos 3/10/2021 - - 63 63 8,231 - 8,231 131 Dev. / Redev. Properties / Wtd. Avg. - 56 435 491 $78,896 - $78,896 $161 Pre-Leased Dev. Property (3) 107 Path 20 Cultivation, LLC Michigan Dimondale 4/16/2021 100.0% 97 104 201 $57,886 $13,007 $70,893 $353 108 Perez Rd, LLC California Cathedral City 3/25/2022 100.0% - 23 23 13,045 2,680 15,726 684 Pre-Leased Dev. Property / Wtd. Avg. 100.0% 97 127 224 $70,931 $15,687 $86,618 $387 Total Portfolio / Wtd. Avg. 92.8% 7,509 1,378 8,887 $2,374,572 $40,113 $2,414,685 $272 State Subtotal / Wtd. Avg. 1 Pennsylvania 84.3% 1,361 - 1,361 $383,960 $1,470 $385,430 $283 2 Massachusetts 100.0% 989 - 989 $304,357 $1,843 $306,200 $310 3 Illinois 100.0% 715 250 965 $302,356 $3,344 $305,700 $317 4 Michigan 98.6% 842 104 946 $280,235 $13,744 $293,978 $311 5 California 51.4% 454 395 849 $202,995 $3,453 $206,448 $243 6 New York 100.0% 298 324 622 $198,214 $6,652 $204,866 $329 7 Florida 100.0% 1,008 - 1,008 $166,550 - $166,550 $165 8 Ohio 100.0% 217 157 374 $109,302 $1,993 $111,295 $298 9 New Jersey 100.0% 291 - 291 $103,485 $500 $103,985 $357 10 Maryland 100.0% 271 - 271 $88,013 $252 $88,265 $326 11 Colorado 100.0% 233 - 233 $83,340 - $83,340 $358 12 Texas 72.8% - 148 148 $23,898 $6,333 $30,231 $204 13 Missouri 100.0% 83 - 83 $27,721 $529 $28,250 $340 14 Arizona 100.0% 377 - 377 $27,737 - $27,737 $74 15 Virginia 100.0% 82 - 82 $19,750 - $19,750 $241 16 Washington 100.0% 114 - 114 $17,500 - $17,500 $154 17 North Dakota 100.0% 42 - 42 $15,849 - $15,849 $377 18 Minnesota 100.0% 89 - 89 $9,710 - $9,710 $109 19 Nevada 100.0% 43 - 43 $9,600 - $9,600 $223 Property List (Continued) Note : Subtotals and Totals include fractional amounts . Square footage and dollars in thousands except for $ /PSF . “Industrial” reflects facilities utilized or expected to be utilized for regulated cannabis cultivation, processing and/or distribution activities, which can consist of industrial and/or greenhouse space . Data as of December 31 , 2023 . 1) Existing square footage for properties where there is no active development or redevelopment . 2) Estimated square footage upon completion of development or redevelopment . 3) Refer to “Definitions” for additional details .
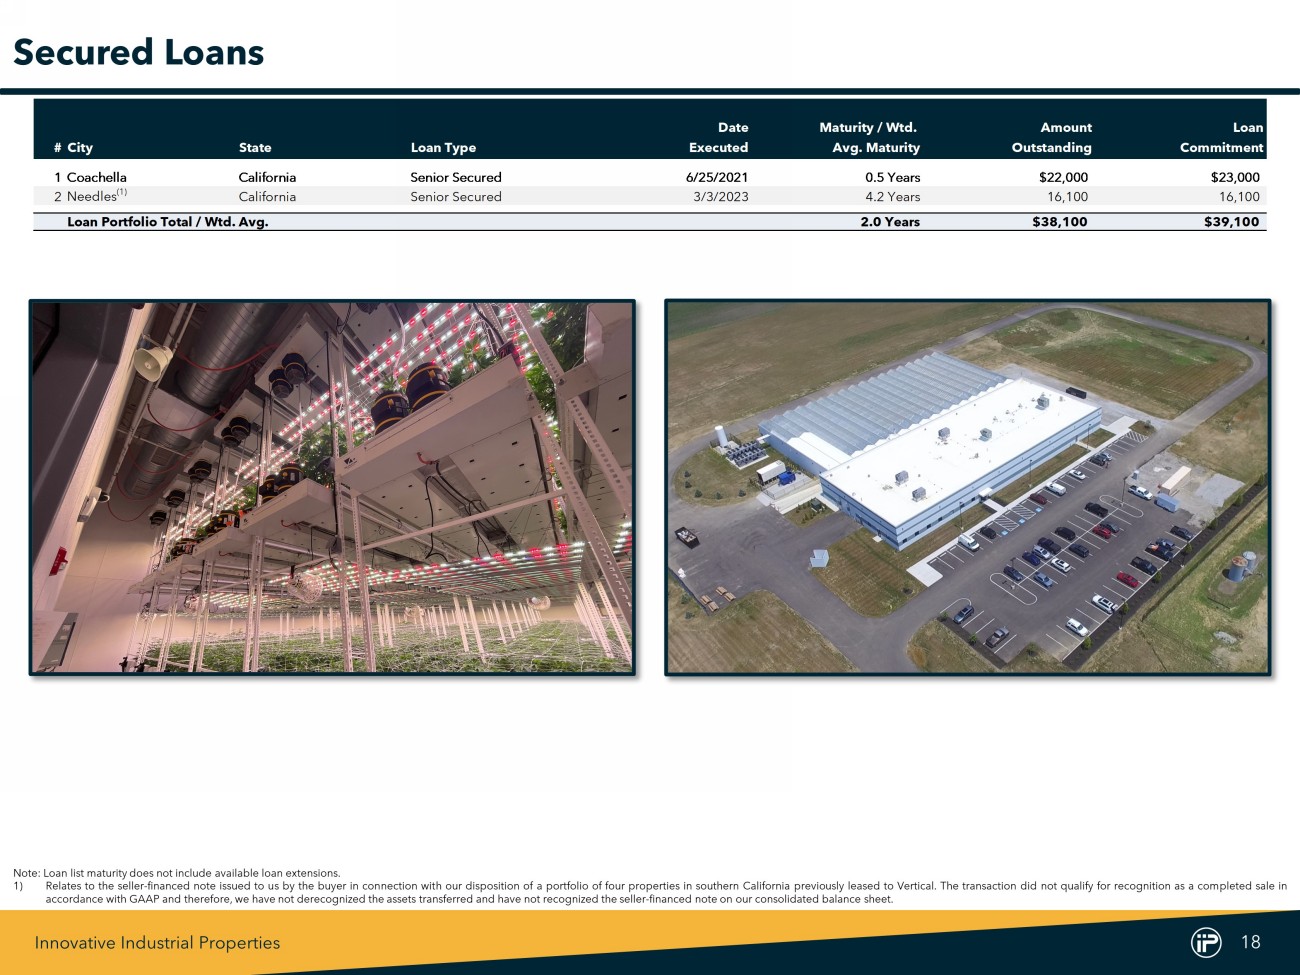
Innovative Industrial Properties 18 Date Maturity / Wtd. Amount Loan #City State Loan Type Executed Avg. Maturity Outstanding Commitment 1Coachella California Senior Secured 6/25/2021 0.5 Years $22,000 $23,000 2 Needles (1) California Senior Secured 3/3/2023 4.2 Years 16,100 16,100 Loan Portfolio Total / Wtd. Avg. 2.0 Years $38,100 $39,100 Secured Loans Note : Loan list maturity does not include available loan extensions . 1) Relates to the seller - financed note issued to us by the buyer in connection with our disposition of a portfolio of four properties in southern California previously leased to Vertical . The transaction did not qualify for recognition as a completed sale in accordance with GAAP and therefore, we have not derecognized the assets transferred and have not recognized the seller - financed note on our consolidated balance sheet .
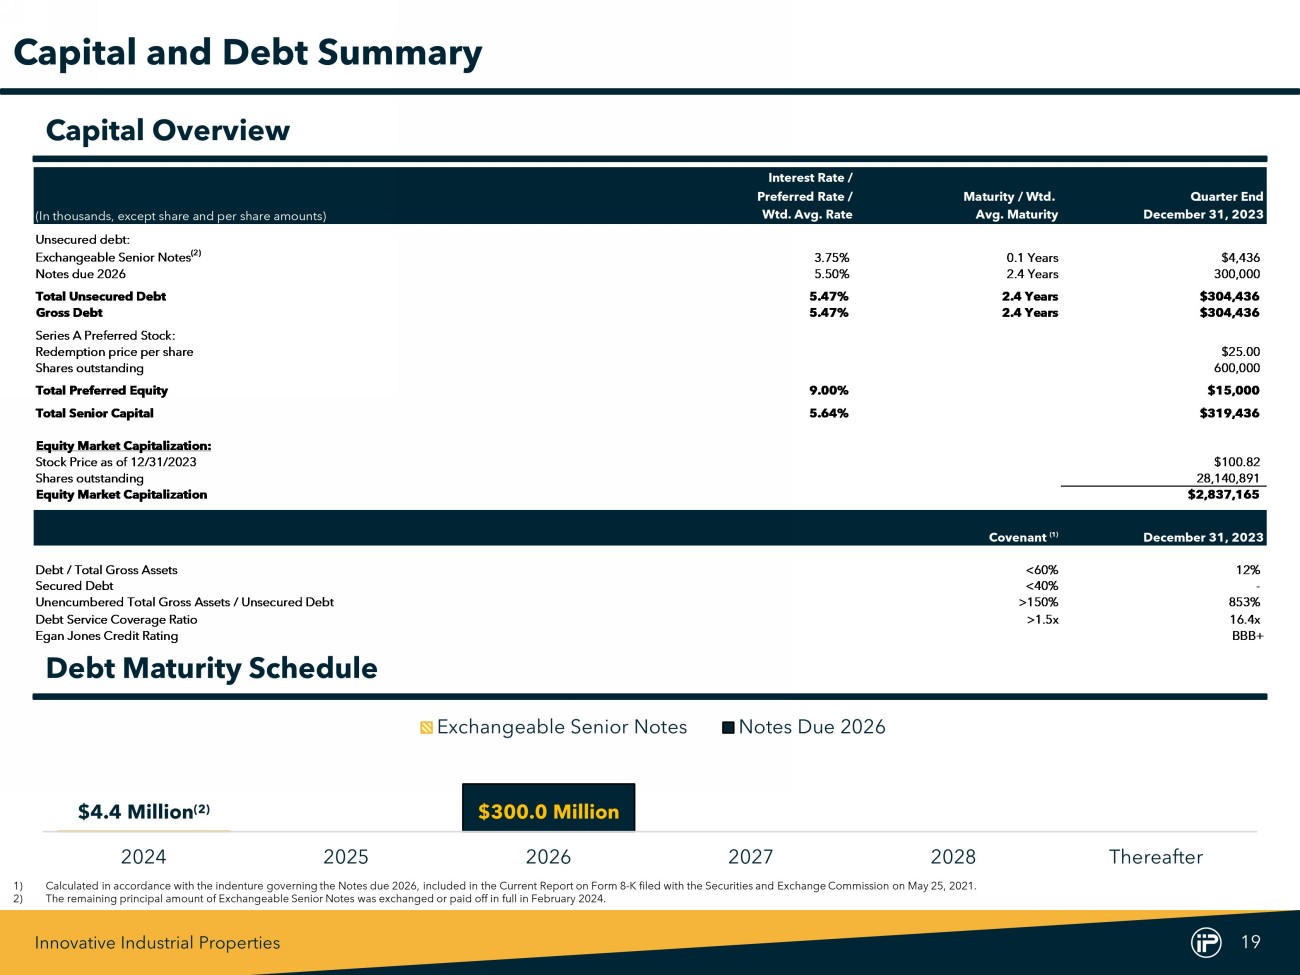
Innovative Industrial Properties 19 Interest Rate / Preferred Rate / Maturity / Wtd. Quarter End (In thousands, except share and per share amounts) Wtd. Avg. Rate Avg. Maturity December 31, 2023 Unsecured debt: Exchangeable Senior Notes (2) 3.75% 0.1 Years $4,436 Notes due 2026 5.50% 2.4 Years 300,000 Total Unsecured Debt 5.47% 2.4 Years $304,436 Gross Debt 5.47% 2.4 Years $304,436 Series A Preferred Stock: Redemption price per share $25.00 Shares outstanding 600,000 Total Preferred Equity 9.00% $15,000 Total Senior Capital 5.64% $319,436 Equity Market Capitalization: Stock Price as of 12/31/2023 $100.82 Shares outstanding 28,140,891 Equity Market Capitalization $2,837,165 Covenant (1) December 31, 2023 Debt / Total Gross Assets <60% 12% Secured Debt <40% - Unencumbered Total Gross Assets / Unsecured Debt >150% 853% Debt Service Coverage Ratio >1.5x 16.4x Egan Jones Credit Rating BBB+ Debt Maturity Schedule Capital and Debt Summary $4.4 Million (2) $300.0 Million 2024 2025 2026 2027 2028 Thereafter Exchangeable Senior Notes Notes Due 2026 Capital Overview 1) Calculated in accordance with the indenture governing the Notes due 2026 , included in the Current Report on Form 8 - K filed with the Securities and Exchange Commission on May 25 , 2021 . 2) The remaining principal amount of Exchangeable Senior Notes was exchanged or paid off in full in February 2024 .
Innovative Industrial Properties 20 Definitions • Adjusted Funds From Operations (“AFFO”): Management believes that AFFO and AFFO per share are appropriate supplemental measures of a REIT’s operating performance. We calculate AFFO by adjusting Normalized FFO for certain cash and non - cash items. • Annualized Base Rent (“ABR”): ABR is calculated by multiplying the sum of contractually due base rents and property management fees for the last month in the quarter, by twelve. • Development / Redevelopment (“Dev. / Redev.”) Properties: Defined as non - operating assets under development that are not leased and not ready for their intended use. • Exchangeable Senior Notes: 3.75% E xchangeable Senior Notes due 2024. • Funds From Operations (“FFO”): FFO and FFO per share are operating performance measures adopted by the National Association of Real Estate Investment Trusts, Inc. (“NAREIT”). NAREIT defines FFO as the most commonly accepted and reported measure of a REIT’s ope rating performance equal to net income (computed in accordance with GAAP), excluding gains (or losses) from sales of property, depre cia tion, amortization and impairment related to real estate properties, and after adjustments for unconsolidated partnerships and join t v entures. Management believes that net income, as defined by GAAP, is the most appropriate earnings measurement. However, management be lie ves FFO and FFO per share to be supplemental measures of a REIT’s performance because they provide an understanding of the operat ing performance of our properties without giving effect to certain significant non - cash items, primarily depreciation expense. Histo rical cost accounting for real estate assets in accordance with GAAP assumes that the value of real estate assets diminishes predictably ov er time. However, real estate values instead have historically risen or fallen with market conditions. We believe that by excluding the effect of depreciation, FFO and FFO per share can facilitate comparisons of operating performance between periods. We report FFO and FFO per share because th ese measures are observed by management to also be the predominant measures used by the REIT industry and by industry analysts to ev aluate REITs and because FFO per share is consistently reported, discussed, and compared by research analysts in their notes and pub lic ations about REITs. For these reasons, management has deemed it appropriate to disclose and discuss FFO and FFO per share. • GAAP: Accounting principles generally accepted in the United States. • Gross Debt: Calculated as the sum of the principal amount outstanding of the Notes due 2026 and Exchangeable Senior Notes. • Normalized Funds From Operations (“Normalized FFO”): We compute normalized funds from operations (“Normalized FFO”) by adjusting FFO, as defined by NAREIT, to exclude certain GAAP income and expense amounts that we believe are infrequent and unusual in n atu re and/or not related to our core real estate operations. Exclusion of these items from similar FFO - type metrics is common within the equi ty REIT industry, and management believes that presentation of Normalized FFO and Normalized FFO per share provides investors with a metric to ass ist in their evaluation of our operating performance across multiple periods and in comparison to the operating performance of other compa nie s, because it removes the effect of unusual items that are not expected to impact our operating performance on an ongoing basis. Normali zed FFO is used by management in evaluating the performance of our core business operations. Items included in calculating FFO that may be ex clu ded in calculating Normalized FFO include certain transaction - related gains, losses, income or expense or other non - core amounts as the y occur.
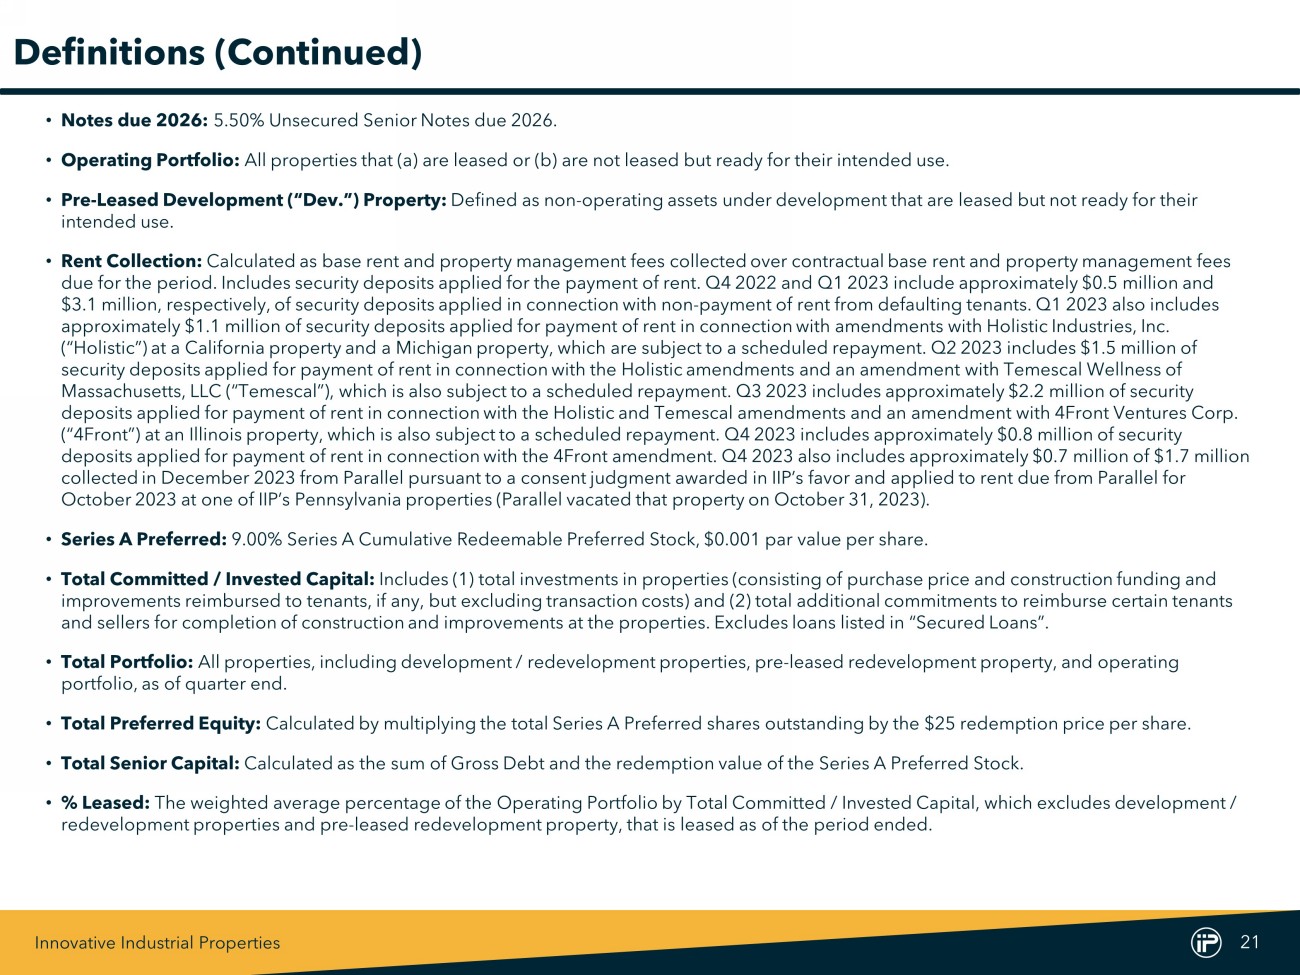
Innovative Industrial Properties 21 Definitions (Continued) • Notes due 2026 : 5.50% Unsecured Senior Notes due 2026. • Operating Portfolio: All properties that (a) are leased or (b) are not leased but ready for their intended use. • Pre - Leased Development (“Dev.”) Property: Defined as non - operating assets under development that are leased but not ready for their intended use. • Rent Collection: Calculated as base rent and property management fees collected over contractual base rent and property management fees due for the period. Includes security deposits applied for the payment of rent. Q4 2022 and Q1 2023 include approximately $0. 5 m illion and $3.1 million, respectively, of security deposits applied in connection with non - payment of rent from defaulting tenants. Q1 2023 also includes approximately $1.1 million of security deposits applied for payment of rent in connection with amendments with Holistic Indus tri es, Inc. (“Holistic”) at a California property and a Michigan property, which are subject to a scheduled repayment. Q2 2023 includes $ 1.5 million of security deposits applied for payment of rent in connection with the Holistic amendments and an amendment with Temescal Welln ess of Massachusetts, LLC (“Temescal”), which is also subject to a scheduled repayment. Q3 2023 includes approximately $2.2 million of security deposits applied for payment of rent in connection with the Holistic and Temescal amendments and an amendment with 4Front Ven tur es Corp. (“4Front”) at an Illinois property, which is also subject to a scheduled repayment. Q4 2023 includes approximately $0.8 milli on of security deposits applied for payment of rent in connection with the 4Front amendment. Q4 2023 also includes approximately $0.7 millio n o f $1.7 million collected in December 2023 from Parallel pursuant to a consent judgment awarded in IIP’s favor and applied to rent due from P ara llel for October 2023 at one of IIP’s Pennsylvania properties (Parallel vacated that property on October 31, 2023). • Series A Preferred: 9.00% Series A Cumulative Redeemable Preferred Stock, $0.001 par value per share. • Total Committed / Invested Capital: Includes (1) total investments in properties (consisting of purchase price and construction funding and improvements reimbursed to tenants, if any, but excluding transaction costs) and (2) total additional commitments to reimburs e c ertain tenants and sellers for completion of construction and improvements at the properties. Excludes loans listed in “Secured Loans”. • Total Portfolio: All properties, including development / redevelopment properties, pre - leased redevelopment property, and operating portfolio, as of quarter end. • Total Preferred Equity: Calculated by multiplying the total Series A Preferred shares outstanding by the $25 redemption price per share. • Total Senior Capital: Calculated as the sum of Gross Debt and the redemption value of the Series A Preferred Stock. • % Leased: The weighted average percentage of the Operating Portfolio by Total Committed / Invested Capital, which excludes development / redevelopment properties and pre - leased redevelopment property, that is leased as of the period ended.
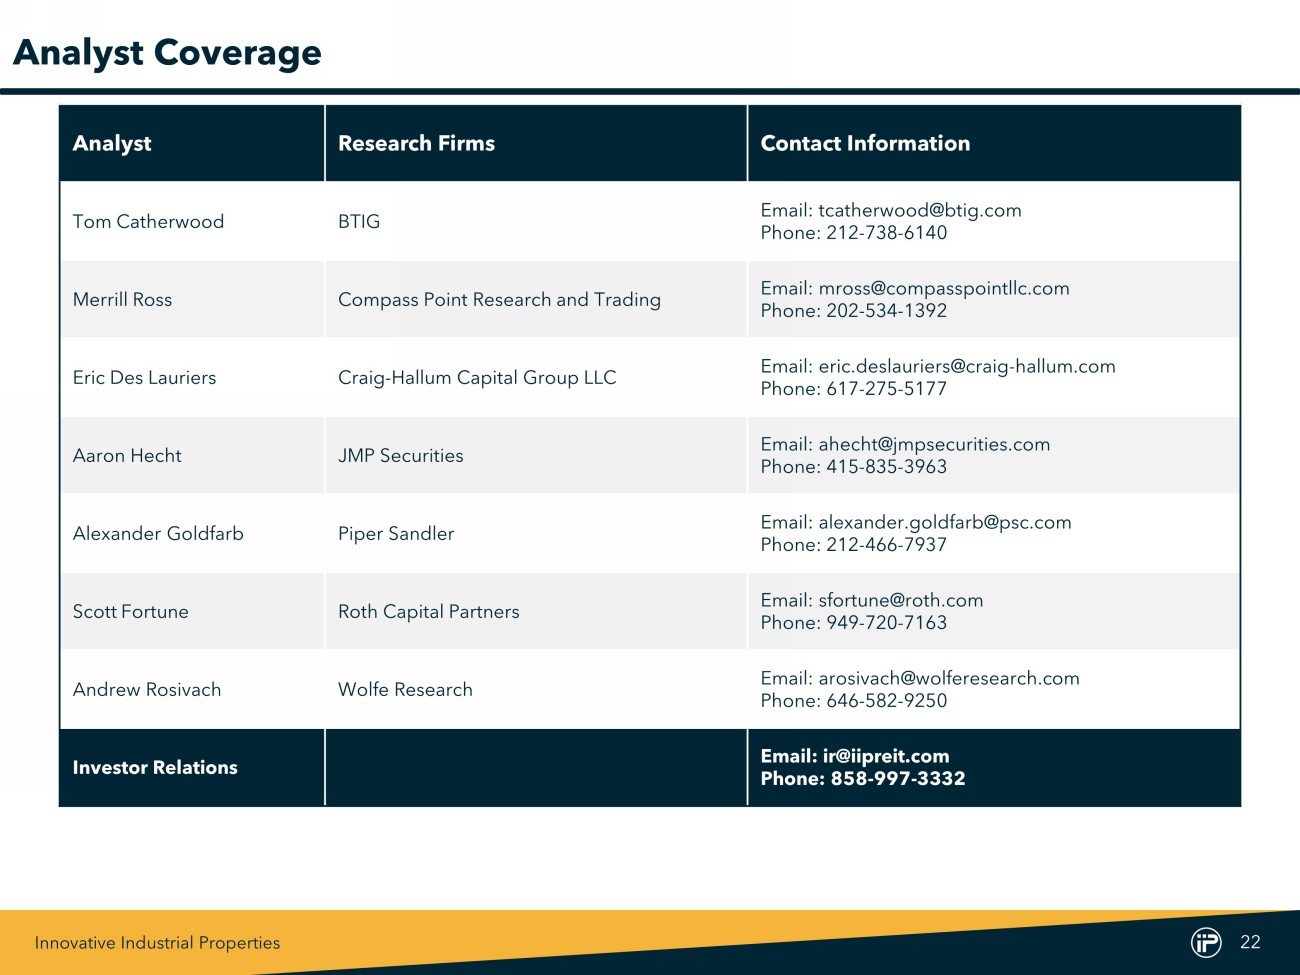
Innovative Industrial Properties 22 Analyst Coverage Analyst Research Firms Contact Information Tom Catherwood BTIG Email: tcatherwood@btig.com Phone: 212 - 738 - 6140 Merrill Ross Compass Point Research and Trading Email: mross@compasspointllc.com Phone: 202 - 534 - 1392 Eric Des Lauriers Craig - Hallum Capital Group LLC Email: eric.deslauriers@craig - hallum.com Phone: 617 - 275 - 5177 Aaron Hecht JMP Securities Email: ahecht@jmpsecurities.com Phone: 415 - 835 - 3963 Alexander Goldfarb Piper Sandler Email: alexander.goldfarb@psc.com Phone: 212 - 466 - 7937 Scott Fortune Roth Capital Partners Email: sfortune@roth.com Phone: 949 - 720 - 7163 Andrew Rosivach Wolfe Research Email: arosivach@wolferesearch.com Phone: 646 - 582 - 9250 Investor Relations Email: ir@iipreit.com Phone: 858 - 997 - 3332

Innovative Industrial Properties 23 Senior Management Team and Board of Directors Senior Management Name Title Alan Gold Executive Chairman Paul Smithers President, Chief Executive Officer and Director David Smith Chief Financial Officer and Treasurer Catherine Hastings Chief Operating Officer Ben Regin Chief Investment Officer Brian Wolfe Vice President, General Counsel and Secretary Andy Bui Vice President, Chief Accounting Officer Tracie Hager Vice President, Asset Management Kelly Spicher Vice President, Real Estate Counsel Board of Directors Name Title Alan Gold Executive Chairman Paul Smithers President, Chief Executive Officer and Director Gary Kreitzer Vice Chairman (Independent) David Stecher Director (Independent) Scott Shoemaker, MD Director (Independent) Mary Allis Curran Director (Independent)
v3.24.0.1
Cover
|
Feb. 26, 2024 |
| Document Information [Line Items] |
|
| Document Type |
8-K
|
| Amendment Flag |
false
|
| Document Period End Date |
Feb. 26, 2024
|
| Entity File Number |
001-37949
|
| Entity Registrant Name |
Innovative Industrial
Properties, Inc.
|
| Entity Central Index Key |
0001677576
|
| Entity Tax Identification Number |
81-2963381
|
| Entity Incorporation, State or Country Code |
MD
|
| Entity Address, Address Line One |
1389 Center
Drive
|
| Entity Address, Address Line Two |
Suite 200
|
| Entity Address, City or Town |
Park City
|
| Entity Address, State or Province |
UT
|
| Entity Address, Postal Zip Code |
84098
|
| City Area Code |
858
|
| Local Phone Number |
997-3332
|
| Written Communications |
false
|
| Soliciting Material |
false
|
| Pre-commencement Tender Offer |
false
|
| Pre-commencement Issuer Tender Offer |
false
|
| Entity Emerging Growth Company |
false
|
| Common Stock [Member] |
|
| Document Information [Line Items] |
|
| Title of 12(b) Security |
Common Stock, par value $0.001 per share
|
| Trading Symbol |
IIPR
|
| Security Exchange Name |
NYSE
|
| Series A Preferred Stock [Member] |
|
| Document Information [Line Items] |
|
| Title of 12(b) Security |
Series A Preferred Stock, par value $0.001 per share
|
| Trading Symbol |
IIPR-PA
|
| Security Exchange Name |
NYSE
|
| X |
- DefinitionBoolean flag that is true when the XBRL content amends previously-filed or accepted submission.
| Name: |
dei_AmendmentFlag |
| Namespace Prefix: |
dei_ |
| Data Type: |
xbrli:booleanItemType |
| Balance Type: |
na |
| Period Type: |
duration |
|
| X |
- DefinitionFor the EDGAR submission types of Form 8-K: the date of the report, the date of the earliest event reported; for the EDGAR submission types of Form N-1A: the filing date; for all other submission types: the end of the reporting or transition period. The format of the date is YYYY-MM-DD.
| Name: |
dei_DocumentPeriodEndDate |
| Namespace Prefix: |
dei_ |
| Data Type: |
xbrli:dateItemType |
| Balance Type: |
na |
| Period Type: |
duration |
|
| X |
- DefinitionThe type of document being provided (such as 10-K, 10-Q, 485BPOS, etc). The document type is limited to the same value as the supporting SEC submission type, or the word 'Other'.
| Name: |
dei_DocumentType |
| Namespace Prefix: |
dei_ |
| Data Type: |
dei:submissionTypeItemType |
| Balance Type: |
na |
| Period Type: |
duration |
|
| X |
- DefinitionAddress Line 1 such as Attn, Building Name, Street Name
| Name: |
dei_EntityAddressAddressLine1 |
| Namespace Prefix: |
dei_ |
| Data Type: |
xbrli:normalizedStringItemType |
| Balance Type: |
na |
| Period Type: |
duration |
|
| X |
- DefinitionAddress Line 2 such as Street or Suite number
| Name: |
dei_EntityAddressAddressLine2 |
| Namespace Prefix: |
dei_ |
| Data Type: |
xbrli:normalizedStringItemType |
| Balance Type: |
na |
| Period Type: |
duration |
|
| X |
- Definition
+ References
+ Details
| Name: |
dei_EntityAddressCityOrTown |
| Namespace Prefix: |
dei_ |
| Data Type: |
xbrli:normalizedStringItemType |
| Balance Type: |
na |
| Period Type: |
duration |
|
| X |
- DefinitionCode for the postal or zip code
| Name: |
dei_EntityAddressPostalZipCode |
| Namespace Prefix: |
dei_ |
| Data Type: |
xbrli:normalizedStringItemType |
| Balance Type: |
na |
| Period Type: |
duration |
|
| X |
- DefinitionName of the state or province.
| Name: |
dei_EntityAddressStateOrProvince |
| Namespace Prefix: |
dei_ |
| Data Type: |
dei:stateOrProvinceItemType |
| Balance Type: |
na |
| Period Type: |
duration |
|
| X |
- DefinitionA unique 10-digit SEC-issued value to identify entities that have filed disclosures with the SEC. It is commonly abbreviated as CIK. Reference 1: http://www.xbrl.org/2003/role/presentationRef
-Publisher SEC
-Name Exchange Act
-Number 240
-Section 12
-Subsection b-2
| Name: |
dei_EntityCentralIndexKey |
| Namespace Prefix: |
dei_ |
| Data Type: |
dei:centralIndexKeyItemType |
| Balance Type: |
na |
| Period Type: |
duration |
|
| X |
- DefinitionIndicate if registrant meets the emerging growth company criteria. Reference 1: http://www.xbrl.org/2003/role/presentationRef
-Publisher SEC
-Name Exchange Act
-Number 240
-Section 12
-Subsection b-2
| Name: |
dei_EntityEmergingGrowthCompany |
| Namespace Prefix: |
dei_ |
| Data Type: |
xbrli:booleanItemType |
| Balance Type: |
na |
| Period Type: |
duration |
|
| X |
- DefinitionCommission file number. The field allows up to 17 characters. The prefix may contain 1-3 digits, the sequence number may contain 1-8 digits, the optional suffix may contain 1-4 characters, and the fields are separated with a hyphen.
| Name: |
dei_EntityFileNumber |
| Namespace Prefix: |
dei_ |
| Data Type: |
dei:fileNumberItemType |
| Balance Type: |
na |
| Period Type: |
duration |
|
| X |
- DefinitionTwo-character EDGAR code representing the state or country of incorporation.
| Name: |
dei_EntityIncorporationStateCountryCode |
| Namespace Prefix: |
dei_ |
| Data Type: |
dei:edgarStateCountryItemType |
| Balance Type: |
na |
| Period Type: |
duration |
|
| X |
- DefinitionThe exact name of the entity filing the report as specified in its charter, which is required by forms filed with the SEC. Reference 1: http://www.xbrl.org/2003/role/presentationRef
-Publisher SEC
-Name Exchange Act
-Number 240
-Section 12
-Subsection b-2
| Name: |
dei_EntityRegistrantName |
| Namespace Prefix: |
dei_ |
| Data Type: |
xbrli:normalizedStringItemType |
| Balance Type: |
na |
| Period Type: |
duration |
|
| X |
- DefinitionThe Tax Identification Number (TIN), also known as an Employer Identification Number (EIN), is a unique 9-digit value assigned by the IRS. Reference 1: http://www.xbrl.org/2003/role/presentationRef
-Publisher SEC
-Name Exchange Act
-Number 240
-Section 12
-Subsection b-2
| Name: |
dei_EntityTaxIdentificationNumber |
| Namespace Prefix: |
dei_ |
| Data Type: |
dei:employerIdItemType |
| Balance Type: |
na |
| Period Type: |
duration |
|
| X |
- DefinitionLocal phone number for entity.
| Name: |
dei_LocalPhoneNumber |
| Namespace Prefix: |
dei_ |
| Data Type: |
xbrli:normalizedStringItemType |
| Balance Type: |
na |
| Period Type: |
duration |
|
| X |
- DefinitionBoolean flag that is true when the Form 8-K filing is intended to satisfy the filing obligation of the registrant as pre-commencement communications pursuant to Rule 13e-4(c) under the Exchange Act. Reference 1: http://www.xbrl.org/2003/role/presentationRef
-Publisher SEC
-Name Exchange Act
-Number 240
-Section 13e
-Subsection 4c
| Name: |
dei_PreCommencementIssuerTenderOffer |
| Namespace Prefix: |
dei_ |
| Data Type: |
xbrli:booleanItemType |
| Balance Type: |
na |
| Period Type: |
duration |
|
| X |
- DefinitionBoolean flag that is true when the Form 8-K filing is intended to satisfy the filing obligation of the registrant as pre-commencement communications pursuant to Rule 14d-2(b) under the Exchange Act. Reference 1: http://www.xbrl.org/2003/role/presentationRef
-Publisher SEC
-Name Exchange Act
-Number 240
-Section 14d
-Subsection 2b
| Name: |
dei_PreCommencementTenderOffer |
| Namespace Prefix: |
dei_ |
| Data Type: |
xbrli:booleanItemType |
| Balance Type: |
na |
| Period Type: |
duration |
|
| X |
- DefinitionTitle of a 12(b) registered security. Reference 1: http://www.xbrl.org/2003/role/presentationRef
-Publisher SEC
-Name Exchange Act
-Number 240
-Section 12
-Subsection b
| Name: |
dei_Security12bTitle |
| Namespace Prefix: |
dei_ |
| Data Type: |
dei:securityTitleItemType |
| Balance Type: |
na |
| Period Type: |
duration |
|
| X |
- DefinitionName of the Exchange on which a security is registered. Reference 1: http://www.xbrl.org/2003/role/presentationRef
-Publisher SEC
-Name Exchange Act
-Number 240
-Section 12
-Subsection d1-1
| Name: |
dei_SecurityExchangeName |
| Namespace Prefix: |
dei_ |
| Data Type: |
dei:edgarExchangeCodeItemType |
| Balance Type: |
na |
| Period Type: |
duration |
|
| X |
- DefinitionBoolean flag that is true when the Form 8-K filing is intended to satisfy the filing obligation of the registrant as soliciting material pursuant to Rule 14a-12 under the Exchange Act. Reference 1: http://www.xbrl.org/2003/role/presentationRef
-Publisher SEC
-Name Exchange Act
-Section 14a
-Number 240
-Subsection 12
| Name: |
dei_SolicitingMaterial |
| Namespace Prefix: |
dei_ |
| Data Type: |
xbrli:booleanItemType |
| Balance Type: |
na |
| Period Type: |
duration |
|
| X |
- DefinitionTrading symbol of an instrument as listed on an exchange.
| Name: |
dei_TradingSymbol |
| Namespace Prefix: |
dei_ |
| Data Type: |
dei:tradingSymbolItemType |
| Balance Type: |
na |
| Period Type: |
duration |
|
| X |
- DefinitionBoolean flag that is true when the Form 8-K filing is intended to satisfy the filing obligation of the registrant as written communications pursuant to Rule 425 under the Securities Act. Reference 1: http://www.xbrl.org/2003/role/presentationRef
-Publisher SEC
-Name Securities Act
-Number 230
-Section 425
| Name: |
dei_WrittenCommunications |
| Namespace Prefix: |
dei_ |
| Data Type: |
xbrli:booleanItemType |
| Balance Type: |
na |
| Period Type: |
duration |
|
| X |
- Details
| Name: |
us-gaap_StatementClassOfStockAxis=us-gaap_CommonStockMember |
| Namespace Prefix: |
|
| Data Type: |
na |
| Balance Type: |
|
| Period Type: |
|
|
| X |
- Details
| Name: |
us-gaap_StatementClassOfStockAxis=us-gaap_SeriesAPreferredStockMember |
| Namespace Prefix: |
|
| Data Type: |
na |
| Balance Type: |
|
| Period Type: |
|
|
Innovative Industrial Pr... (NYSE:IIPR)
Historical Stock Chart
From Mar 2024 to Apr 2024

Innovative Industrial Pr... (NYSE:IIPR)
Historical Stock Chart
From Apr 2023 to Apr 2024
