UNITED
STATES
SECURITIES
AND EXCHANGE COMMISSION
Washington,
D.C. 20549
FORM
8-K
CURRENT
REPORT
Pursuant
to Section 13 or 15(d) of the
Securities
Exchange Act of 1934
Date
of Report (Date of earliest event reported): January 30, 2024
SOUTHERN
CALIFORNIA BANCORP
(Exact
name of registrant as specified in its charter)
| California |
|
001-41684 |
|
84-3288397 |
(State
or other jurisdiction
of
incorporation) |
|
(Commission
File
Number) |
|
(IRS
Employer
Identification
Number) |
| 12265
El Camino Real, Suite 210 |
|
|
| San
Diego, California |
|
92310 |
| (Address
of Principal Executive Offices) |
|
(Zip
Code) |
(844)
265-7622
(Registrant’s
Telephone Number, Including Area Code)
N/A
(Former
name or former address, if changed since last report.)
Check
the appropriate box below if the Form 8-K filing is intended to simultaneously satisfy the filing obligation of the registrant under
any of the following provisions:
| ☒ |
Written
communications pursuant to Rule 425 under the Securities Act (17 CFR 230.425) |
| |
|
| ☐ |
Soliciting
material pursuant to Rule 14a-12 under the Exchange Act (17 CFR 240.14a-12) |
| |
|
| ☐ |
Pre-commencement
communications pursuant to Rule 14d-2(b) under the Exchange Act (17 CFR 240.14d-2(b)) |
| |
|
| ☐ |
Pre-commencement
communications pursuant to Rule 13e-4(c) under the Exchange Act (17 CFR 240.13e-4(c)) |
Securities
registered pursuant to Section 12(b) of the Act:
| Title
of each class |
|
Trading
Symbol(s) |
|
Name
of each exchange on which registered |
| Common
Stock |
|
BCAL |
|
The
Nasdaq Stock Market LLC |
Indicate
by check mark whether the registrant is an emerging growth company as defined in Rule 405 of the Securities Act of 1933 (§230.405
of this chapter) or Rule 12b-2 of the Securities Exchange Act of 1934 (§240.12b-2 of this chapter).
Emerging
growth company ☒
If
an emerging growth company, indicate by check mark if the registrant has elected not to use the extended transition period for complying
with any new or revised financial accounting standards provided pursuant to Section 13(a) of the Exchange Act. ☒
| Item 2.02 |
Results of Operations and Financial Condition |
On
January 30, 2024, Southern California Bancorp (the “Company”) issued an earnings release reporting its consolidated financial
results as of and for the fourth quarter and the full year of 2023. A copy of that earnings release is furnished as Exhibit 99.1 hereto.
| Item 7.01 | Regulation FD Disclosure |
A
copy of a slide presentation that the Company may use for upcoming meetings with investors and other interested parties is furnished
as Exhibit 99.2 hereto. Additionally, the Company has posted the slide presentation in the Investor Relations section of its website
at https://investor.banksocal.com. Information obtained or linked to the foregoing website shall not be deemed to be included in this
Current Report on Form 8-K.
In
accordance with General Instruction B.2 of Form 8-K, the information contained in this Current Report on Form 8-K, including Exhibit
99.1 and Exhibit 99.2, is being furnished and shall not be deemed “filed” for purposes of Section 18 of the Securities Exchange
Act of 1934, as amended (the “Exchange Act”), nor shall such information be deemed incorporated by reference into any filing
under the Securities Act of 1933, as amended, or the Exchange Act, except as shall be expressly set forth by specific reference in such
filing..
| Item 9.01 | Financial Statements and Exhibits. |
SIGNATURES
Pursuant
to the requirements of the Securities Exchange Act of 1934, the registrant has duly caused this report to be signed on its behalf by
the undersigned hereunto duly authorized.
| |
SOUTHERN
CALIFORNIA BANCORP |
| |
|
| Date:
January 30, 2024 |
By: |
/s/
DAVID I. RAINER |
| |
|
David
I. Rainer |
| |
|
Chief
Executive Officer |
Exhibit
99.1

SOUTHERN
CALIFORNIA BANCORP REPORTS NET INCOME OF
$4.4 MILLION FOR THE FOURTH QUARTER AND $25.9 MILLION FOR THE FULL YEAR OF 2023
—
The Company Also Announced in a Separate Release that it has Entered into a Merger Agreement
with California BanCorp
San
Diego, Calif., January 30, 2024 – Southern California Bancorp (“us,” “we,” “our,” or the
“Company”) (NASDAQ: BCAL), the holding company for Bank of Southern California, N.A. (the “Bank”) announces its
consolidated financial results for the fourth quarter and full year of 2023.
Southern
California Bancorp reported net income of $4.4 million for the fourth quarter of 2023, or $0.24 per diluted share, compared to net income
of $8.5 million, or $0.46 per diluted share in the fourth quarter of 2022, and net income of $6.6 million, or $0.35 per diluted share
in the third quarter of 2023. The Company reported net income of $25.9 million for the full year of 2023, or $1.39 per diluted share,
compared to net income of $16.1 million, or $0.88 per diluted share for the full year of 2022.
“I’m
pleased to report our 2023 full year results show strong growth over 2022, with 2023 net income of $25.9 million increasing $9.8 million
or 61% from the prior year, and earnings per share of $1.39 increasing 57% over the prior year,” said David Rainer, Chairman and
CEO of Southern California Bancorp and Bank of Southern California. “Our return on average assets of 1.12% grew significantly from
0.70% in the prior year and our net interest margin expanded to 4.33% from 4.06%, despite pressure from the industry-wide increase in
the cost of funds, the effects of which were somewhat offset by the Bank’s increased loan yield of 5.94% for 2023, up from 5.02%
for the prior year.
“The
highlights of our fourth quarter results include total loan growth of $29.4 million and an increase in tangible book value per share
(non-GAAP1) of $0.48 to $13.56, an increase of 3.7% from the prior quarter. Our fourth quarter results were impacted by a
$1 million pre-tax loss on the sale of securities yielding 2.4%, the proceeds of which were redeployed into securities yielding 4.7%,
which will add to future interest income and provide some protection if interest rates decrease. The fourth quarter was also impacted
by a $1.3 million charge-off for a nonaccrual loan we reported in the prior quarter, which was the result of a new appraisal of the collateral
backing the loan.
“We
are very excited about the merger with California BanCorp and California Bank of Commerce, which was jointly announced this morning.
We believe it will be beneficial for both companies’ shareholders, as well as our clients and employees, and I look forward to
working with California BanCorp Chief Executive Officer Steven Shelton and his team as we integrate our operations into one organization.”
Fourth
Quarter 2023 Highlights
| ● | Net
income of $4.4 million, compared with $6.6 million in the prior quarter |
| ● | Diluted
earnings per share of $0.24, compared with $0.35 in the prior quarter |
| ● | Net
interest margin of 4.05%, compared with 4.23% in the prior quarter; average loan yield
of 6.08% compared with 5.97% in the prior quarter |
| ● | Return
on average assets of 0.75%, compared with 1.12% in the prior quarter |
1
Reconciliations of the non–U.S. generally accepted accounting principles (“GAAP”) measures are set forth at the
end of this press release.
| ● | Return
on average common equity of 6.21%, compared with 9.38% in the prior quarter |
| ● | Efficiency
ratio (non-GAAP1) of 68.3%, compared with 61.4% in the prior quarter |
| ● | Tangible
book value per common share (“TBV”) (non-GAAP1) of $13.56 at December
31, 2023, up $0.48 from $13.08 at September 30, 2023 |
| ● | Total
assets of $2.36 billion at December 31, 2023, compared with $2.31 billion at September
30, 2023 |
| ● | Total
loans, including loans held for sale of $1.96 billion at December 31, 2023, compared
with $1.94 billion at September 30, 2023 |
| ● | Nonperforming
assets to total assets ratio of 0.55% at December 31, 2023, compared with 0.62% at September
30, 2023 |
| ● | Total
deposits of $1.94 billion at December 31, 2023, decreased $40.3 million or 2.0%, compared
with $1.98 billion at September 30, 2023 |
| ● | Noninterest-bearing
demand deposits were $675.1 million at December 31, 2023, representing 34.7% of total
deposits, compared with $736.0 million, or 37.1% of total deposits at September 30, 2023 |
| ● | Cost
of deposits was 1.81%, compared with 1.56% in the prior quarter |
| ● | Cost
of funds was 1.95%, compared with 1.62% in the prior quarter |
| ● | Bank’s
capital exceeds minimums to be “well-capitalized,” the highest regulatory
capital category |
Full
Year 2023 Highlights
| ● | Net
income increased to $25.9 million, up $9.8 million, or 60.8% from the prior year |
| ● | Diluted
earnings per share of $1.39, up $0.51, or 57.2% from the prior year |
| ● | Total
loan interest income increased to $114.0 million, up $27.6 million or 31.9% from the
prior year |
| ● | Net
interest margin of 4.33% for 2023, compared with 4.06% in the prior year; average loan
yield was 5.94%, up from 5.02% in the prior year |
| ● | Efficiency
ratio (non-GAAP1) of 61.3%, improved from 69.5% in the prior year |
| ● | Provision
for credit losses of $915 thousand under the Current Expected Credit Loss (“CECL”)
model, the provision was $6.0 million under the incurred loss model for the year ended December
31, 2022 |
| ● | Total
assets of $2.36 billion, up $76.3 million or 3.3% from December 31, 2022 |
| ● | Total
loans, including loans held for sale, increased to $1.96 billion, up $58.0 million from
December 31, 2022 |
| ● | Total
deposits of $1.94 billion, up $11.7 million from December 31, 2022 |
| ● | Noninterest
bearing demand deposits were $675.1 million, representing 34.7% of total deposits, compared
to $923.9 million, or 47.8% of total deposits at December 31, 2022 |
| ● | Cost
of deposits was 1.37%, up from 0.23% in the prior year |
| ● | Tangible
book value per common share (“TBV”) (non-GAAP1) of $13.56 at December
31, 2023, up $1.24 from December 31, 2022 |
Fourth
Quarter Operating Results
Net
Income
Net
income for the fourth quarter of 2023 was $4.4 million, or $0.24 per diluted share, compared with net income of $6.6 million, or $0.35
per diluted share in the third quarter of 2023. Pre-tax, pre-provision income (non-GAAP) for the fourth quarter was $7.1 million, a decrease
of $2.2 million or 23.4% from the prior quarter.
Net
Interest Income and Net Interest Margin
Net
interest income for the fourth quarter of 2023 was $22.6 million, compared to $23.3 million in the prior quarter. The decrease in net
interest income was primarily due to a $1.8 million increase in total interest expense, partially offset by a $1.1 million increase in
total interest and dividend income in the fourth quarter of 2023 as compared to the prior quarter. During the fourth quarter of 2023,
loan interest income increased $1.0 million, total debt securities income increased $43 thousand, and interest and dividend income from
other financial institutions increased $51 thousand. The increase in interest income was due to a number of factors: a higher average
total loan balance from organic loan growth; a change in the interest-earning asset mix; and higher loan yields resulting from the benefit
of variable rate interest-earning loans repricing for the first time since the start of the rising interest rate environment. Additionally,
in the prior quarter we recorded a reversal of a non-accrual loan’s interest income of $264 thousand for which there was no significant
reversal of interest income in the current quarter. Average interest-earning assets increased $25.5 million, the result of a $30.0 million
increase in average total loans, a $5.9 million increase in average deposits in other financial institutions, a $1.1 million increase
in average total debt securities, and a $29 thousand increase in average restricted stock investments and other bank stock, partially
offset by a $11.6 million decrease in average Fed funds sold/resale agreements. The increase in interest expense for the fourth quarter
of 2023 was primarily due to a $639 thousand increase in interest expense on Federal Home Loan Bank (FHLB) borrowings, and a $1.1 million
increase in interest expense on interest-bearing deposits, the result of a $27.6 million increase in average interest-bearing deposits,
coupled with a 31 basis point increase in interest-bearing deposit costs.
Net
interest margin for the fourth quarter of 2023 was 4.05%, compared with 4.23% in the prior quarter. The decrease was primarily related
to a 33 basis point increase in the cost of funds, partially offset by a 13 basis point increase in the total interest-earning assets
yield, which was the result of higher market interest rates and a change in the Bank’s average interest-earning asset mix. The
yield on total average earning assets in the fourth quarter of 2023 was 5.85%, compared with 5.72% in the prior quarter. The yield on
average total loans in the fourth quarter of 2023 was 6.08%, an increase of 11 basis points from 5.97% in the prior quarter. The yield
on average total loans in the prior quarter included the impact of the reversal of a non-accrual loan’s interest, which decreased
the overall loan yield by 5 basis points. There was no significant reversal of interest income in the fourth quarter of 2023.
Cost
of funds for the fourth quarter of 2023 was 195 basis points, an increase of 33 basis points from 162 basis points in the prior quarter.
The increase was primarily driven by a 31 basis point increase in the cost of interest-bearing deposits, a 13 basis point increase in
the cost of FHLB borrowings, an increase in average interest-bearing deposits, and a decrease in average noninterest-bearing deposits.
Average noninterest-bearing demand deposits decreased $47.0 million to $721.2 million and represented 36.8% of total average deposits
for the fourth quarter of 2023, compared with $768.1 million and 38.8%, respectively, in the prior quarter; average interest-bearing
deposits increased $27.6 million to $1.24 billion during the fourth quarter of 2023. The total cost of deposits in the fourth quarter
of 2023 was 181 basis points, an increase of 25 basis points from 156 basis points in the prior quarter.
Average
total borrowings increased $44.7 million to $74.2 million for the fourth quarter of 2023, primarily due to an increase of $44.6 million
in average FHLB borrowings during the quarter. The average cost of total borrowings was 5.73% for the fourth quarter of 2023, down from
5.82% in the prior quarter.
Provision
for Credit Losses
The
Company recorded a provision for credit losses of $824 thousand in the fourth quarter of 2023, compared to a reversal of provision for
credit losses of $96 thousand in the prior quarter. The provision for credit losses in the fourth quarter of 2023 included a $307 thousand
negative provision for unfunded loan commitments primarily due to lower unfunded loan commitments. Total unfunded loan commitments decreased
$79.6 million to $410.8 million at December 31, 2023, from $490.4 million at September 30, 2023. The provision for credit losses for
the loan portfolio in the fourth quarter of 2023 was $1.1 million, an increase of $929 thousand from $202 thousand in the prior quarter.
The increase was driven primarily by an increase in net charge-offs, loan growth, an increase in substandard accruing loans and changes
in the portfolio mix, partially offset by an improvement in the reasonable and supportable forecast, primarily related to the economic
outlook from the Federal Reserve’s actions to control inflation, and a decrease in special mention loans. The Company’s management
continues to monitor macroeconomic variables related to increasing interest rates, inflation and the concerns of an economic downturn,
and believes it is appropriately provisioned for the current environment.
Noninterest
(Loss) Income
The
Company recorded a loss on noninterest income of $102 thousand in the fourth quarter of 2023, a decrease of $917 thousand compared to
total noninterest income of $815 thousand in the third quarter of 2023. In the fourth quarter of 2023, the Company recorded a loss on
sale of available-for-sale debt securities of $1.0 million in order to redeploy the proceeds into higher-yielding available-for-sale
debt securities, for which there was no comparable transaction in the third quarter of 2023. There was no gain on SBA 7A loan sales in
the fourth quarter and third quarter of 2023 primarily due to unattractive pricing in the secondary market.
Noninterest
Expense
Total
noninterest expense for the fourth quarter of 2023 was $15.3 million, an increase of $558 thousand from total noninterest expense of
$14.8 million in the prior quarter. In the fourth quarter of 2023, occupancy and equipment expenses increased by $99 thousand, legal,
audit and professional fees increased by $563 thousand, and other expenses increased by $125 thousand, partially offset by decreases
in salaries and employee benefits of $138 thousand.
The
$99 thousand increase in occupancy and equipment expenses was due primarily to an impairment charge related to the right-of-use asset
associated with a Company lease. The $563 thousand increase in legal, audit and professional fees was due primarily to an increase in
legal expenses and consulting expenses related to compliance projects and loan review projects. The $125 thousand increase in other expense
was due primarily to the increase in loan related expense. The $138 thousand decrease in salaries and benefits was due primarily to a
decrease in stock-based compensation expense resulting from the forfeitures for employee separation, partially offset by a decrease in
the deferred loan origination costs in the fourth quarter of 2023.
Efficiency
ratio (non-GAAP1) for the fourth quarter of 2023 was 68.3%, compared to 61.4% in the prior quarter.
Income
Tax
In
the fourth quarter of 2023, the Company’s income tax expense was $1.9 million, compared with $2.8 million in the third quarter
of 2023. The effective rate was 29.9% for the fourth quarter of 2023 and 30.2% for the third quarter of 2023. The effective rate was
29.7% for the year ended December 31, 2023. The decrease in the effective tax rate for the fourth quarter of 2023 was primarily attributable
to the impact of the vesting and exercise of equity awards combined with changes in the Company’s stock price over time, and other
deferred tax related adjustments.
Balance
Sheet
Assets
Total
assets at December 31, 2023 were $2.36 billion, an increase of $46.6 million or 2.0% from September 30, 2023. The increase in total assets
from the prior quarter was primarily related to a $29.4 million increase in total loans, including loans held for sale, a $18.2 million
increase in available-for-sale debt securities, and a $9.9 million increase in income tax receivable recorded in accrued interest and
other assets, partially offset by a $8.3 million decrease in cash and cash equivalents, and a $1.4 million decrease in deferred taxes,
net.
Loans
Total
loans held for investment were $1.96 billion at December 31, 2023, compared to $1.93 billion at September 30, 2023, with fourth quarter
of 2023 new originations of $34.0 million and net advances of $40.1 million, partially offset by payoffs of $45.9 million, and a charge-off
of $1.3 million. Total loans secured by real estate increased by $16.1 million, with construction and land development loans increasing
by $6.2 million, commercial real estate and other loans increasing by $4.6 million, and multifamily loans increasing by $3.1 million,
1-4 family residential loans increasing by $2.2 million, and consumer loans increasing by $1.6 million. The Company had $7.3 million
in SBA 7A loans held for sale at December 31, 2023, compared to $4.8 million at September 30, 2023.
Deposits
Total
deposits at December 31, 2023 were $1.94 billion, a decrease of $40.3 million from September 30, 2023. Noninterest-bearing demand deposits
at December 31, 2023, were $675.1 million, or 34.7% of total deposits, compared with $736.0 million, or 37.1% of total deposits at September
30, 2023. At December 31, 2023, total interest-bearing deposits were $1.27 billion, compared to $1.25 billion at September 30, 2023.
At December 31, 2023, total brokered time deposits were $107.8 million, compared to $84.5 million at September 30, 2023. Given the nature
of the Company’s commercial banking model, at December 31, 2023, approximately 42% of total deposits exceeded the FDIC insurance
limits. The Company offers the Insured Cash Sweep (ICS) product, providing customers with FDIC insurance coverage at ICS network institutions.
At December 31, 2023, ICS deposits were $274.1 million, or 14.1% of total deposits, compared to $252.7 million, or 12.7% of total deposits
at September 30, 2023.
Federal
Home Loan Bank (“FHLB”) and Liquidity
At
December 31, 2023, the Company had overnight FHLB borrowings of $85.0 million, a $77.0 million increase from September 30, 2023. There
were no outstanding Federal Reserve Discount Window borrowings at December 31, 2023 or September 30, 2023, and the Company has not participated
in the Federal Reserve Bank Term Funding Program.
At
December 31, 2023, the Company had available borrowing capacity from the FHLB secured line of credit of approximately $339.2 million
and available borrowing capacity from the Federal Reserve Discount Window of approximately $141.6 million. The Company also had available
borrowing capacity from three unsecured credit lines from correspondent banks of approximately $75.0 million at December 31, 2023, with
no outstanding borrowings. Total available borrowing capacity was $555.8 million at December 31, 2023. Additionally, the Company had
unpledged liquid securities at fair value of approximately $130.0 million and cash and cash equivalents of $86.8 million at December
31, 2023.
Asset
Quality
Total
non-performing assets decreased to $13.0 million, or 0.55% of total assets at December 31, 2023, compared with $14.3 million, or 0.62%
of total assets at September 30, 2023. The decrease from September 30, 2023, was primarily due to a $1.3 million charge-off for a non-accrual
multifamily loan with a net carrying value before charge-off of $14.3 million during the fourth quarter of 2023. The non-accrual multifamily
loan added to non-accrual loans during the third quarter of 2023 is collateralized by three investment multifamily properties located
in the city of Santa Monica, California. A court appointed receiver is in place and the Company is aggressively pursuing the resolution
of this matter. During the fourth quarter of 2023, the Company received the updated appraisals for the three multifamily properties;
the combined “As-Is” collateral value, after accounting for estimated selling costs, the estimated net collateral value was
$1.3 million lower than the subject loan’s net carrying value resulting in a partial charge-off in the fourth quarter of 2023.
Special mention loans decreased by $289 thousand during the fourth quarter of 2023 to $3.0 million at December 31, 2023, due mostly to
two commercial and industrial loans from one relationship with a net carrying value of $425 thousand that were upgraded from special
mention loans to pass loans. Substandard accruing loans increased by $3.0 million during the fourth quarter of 2023 to $6.5 million at
December 31, 2023 due mostly to a commercial and industrial loan from one relationship with a net carrying value of $3.1 million that
was downgraded from a pass loan, partially offset by payoffs and net paydowns.
The
Company had no loans over 90 days past due that were accruing interest at December 31, 2023, and September 30, 2023.
There
were $19 thousand of loan delinquencies (30-89 days past due) related to a Paycheck Protection Program loan at December 31, 2023, compared
to $96 thousand loan delinquencies (30-89 days past due) at September 30, 2023.
The
allowance for credit losses, which is comprised of allowance for loan losses (ALL) and reserve for unfunded loan commitments, totaled
$23.5 million, or 1.20% of total loans held for investment at December 31, 2023, compared to $23.9 million, or 1.24% at September 30,
2023. The $443 thousand decrease in the allowance included a $1.1 million provision for credit losses for the loan portfolio, partially
offset by a net charge-off of $1.3 million, and a $307 thousand negative credit provision for unfunded loan commitments for the quarter
ended December 31, 2023.
The
allowance for loan losses was $22.6 million, or 1.15% of total loans held for investment at December 31, 2023, compared to $22.7 million,
or 1.18% at September 30, 2023.
Capital
Tangible
book value (non-GAAP) per common share at December 31, 2023, was $13.56, compared with $13.08 at September 30, 2023. In the fourth quarter
of 2023, tangible book value was primarily impacted by net income, stock-based compensation expense, and a decrease in net of tax unrealized
losses on available-for-sale debt securities. Other comprehensive losses related to unrealized losses, net of taxes, on available-for-sale
debt securities decreased by $4.7 million to $4.5 million at December 31, 2023 from $9.2 million at September 30, 2023. The decrease
in the unrealized losses, net of taxes, on available-for-sale debt securities was primarily attributable to factors other than credit
related, including changes in interest rates driven by the Federal Reserve’s policy to fight inflation, and general volatility
in credit market conditions. Tangible common equity (non-GAAP) as a percent of total tangible assets (non-GAAP) at December 31, 2023
increased to 10.73% from 10.53% in the prior quarter, and unrealized losses as a percent of tangible common equity (non-GAAP) at December
31, 2023 decreased to 1.8% from 3.9% in the prior quarter.
The
Bank’s leverage capital ratio and total risk-based capital ratio were 11.65% and 13.51%, respectively, at December 31, 2023. The
Bank elected the three-year phase-in period under the regulatory capital rules, which allow a phase-in of the Day 1 CECL transition adjustment
to the regulatory capital at 25% per year over a three-year transition period.
ABOUT
SOUTHERN CALIFORNIA BANCORP AND BANK OF SOUTHERN CALIFORNIA, N.A.
Southern
California Bancorp (NASDAQ: BCAL) is a registered bank holding company headquartered in San Diego, California. Bank of Southern California,
N.A., a national banking association chartered under the laws of the United States (the “Bank”) and regulated by the Office
of Comptroller of the Currency, is a wholly owned subsidiary of Southern California Bancorp. Established in 2001 and headquartered in
San Diego, California, the Bank offers a range of financial products and services to individuals, professionals, and small- to medium-sized
businesses through its 13 branch offices serving Orange, Los Angeles, Riverside, San Diego, and Ventura counties, as well as the Inland
Empire. The Bank’s solutions-driven, relationship-based approach to banking provides accessibility to decision makers and enhances
value through strong partnerships with its clients. Additional information is available at www.banksocal.com.
CAUTIONARY
NOTE REGARDING FORWARD-LOOKING STATEMENTS
In
addition to historical information, this release includes forward-looking statements within the meaning of the Private Securities Litigation
Reform Act of 1995. Forward-looking statements relate to expectations, beliefs, projections, future plans and strategies, anticipated
events or trends and other matters that are not historical facts. Examples of forward-looking statements include, among others, statements
regarding expectations, plans or objectives for future operations, products or services, loan recoveries and the proposed merger (the
“Merger”) of the Company and California
BanCorp
(“CBC”), as well as forecasts relating to financial and operating results or other measures of economic performance. Forward-looking
statements reflect management’s current view about future events and involve risks and uncertainties that may cause actual results
to differ from those expressed in the forward-looking statement or historical results. Forward-looking statements can be identified by
the fact that they do not relate strictly to historical or current facts and often include the words or phrases such as “aim,”
“can,” “may,” “could,” “predict,” “should,” “will,” “would,”
“believe,” “anticipate,” “estimate,” “expect,” “hope,” “intend,”
“plan,” “potential,” “project,” “will likely result,” “continue,” “seek,”
“shall,” “possible,” “projection,” “optimistic,” and “outlook,” and variations
of these words and similar expressions.
Some
factors that could cause actual results to differ materially from historical or expected results include, among others: the risk
factors discussed in the Company’s Registration Statement on Form 10, as amended, filed with the Securities and Exchange
Commission (“SEC”); changes in real estate markets and general economic conditions, either nationally or locally in the
areas in which the Company conducts business; the impact on financial markets from geopolitical conflicts; inflation, interest rate,
market and monetary fluctuations; increases in competitive pressures among financial institutions and businesses offering similar
products and services; higher than anticipated defaults in the Company’s loan portfolio; changes in management’s
estimate of the adequacy of the allowance for credit losses; legislative or regulatory changes or changes in accounting principles,
policies or guidelines; the impacts of recent bank failures; the occurrence of any event, change or other circumstances that could
give rise to the right of the Company or CBC to terminate their agreement with respect to the Merger; the outcome of any legal
proceedings that may be instituted against the Company or CBC; delays in completing the Merger; the failure to obtain necessary
regulatory approvals (and the risk that such approvals impose conditions that could adversely affect the combined company or the
expected benefits of the Merger); the failure to obtain shareholder approvals or to satisfy any of the other conditions to the
Merger on a timely basis or at all; the ability to complete the Merger and integration of the Company and CBC successfully; costs
being greater than anticipated; cost savings being less than anticipated; the risk that the Merger disrupts the business of the
Company, CBC or both; difficulties in retaining senior management, employees or customers; and other factors that may affect the
future results of the Company and CBC.
Additional
information regarding these and other risks and uncertainties to which our business and future financial performance are subject is contained
in the Company’s Registration Statement on Form 10, as amended and other documents the Company files with the SEC from time to
time.
Any
forward-looking statement made in this release is based only on information currently available to management and speaks only as of the
date on which it is made. The Company does not undertake, and specifically disclaims any obligation, to update any forward-looking statements
to reflect occurrences or unanticipated events or circumstances after the date of such statements or to conform such forward-looking
statements to actual results or to changes in its opinions or expectations, except as required by law.
ADDITIONAL
INFORMATION AND WHERE TO FIND IT
In
connection with the Merger, the Company will file with the SEC a Registration Statement on Form S-4 that will include a joint proxy statement
of the Company and CBC and a prospectus of the Company, as well as other relevant documents concerning the proposed transaction. Certain
matters in respect of the Merger will be submitted to the Company’s and CBC’s shareholders for their consideration. This
communication does not constitute an offer to sell or the solicitation of an offer to buy any securities or a solicitation of any vote
or approval, nor shall there be any sale of securities, in any jurisdiction in which such offer, solicitation or sale would be unlawful
prior to registration or qualification under the securities laws of any such jurisdiction.
INVESTORS
AND SHAREHOLDERS ARE URGED TO READ THE REGISTRATION STATEMENT AND THE JOINT PROXY STATEMENT/PROSPECTUS REGARDING THE MERGER WHEN THEY
BECOME AVAILABLE AND ANY OTHER RELEVANT DOCUMENTS FILED WITH THE SEC IN CONNECTION WITH THE MERGER BECAUSE THEY WILL CONTAIN IMPORTANT
INFORMATION.
Investors
will be able to obtain a free copy of the definitive joint proxy statement/prospectus, as well as other filings containing information
about the Company and CBC, without charge, at the SEC’s website, www.sec.gov. Copies of the joint proxy statement/prospectus and
the filings with the SEC that will be incorporated by reference in the joint proxy statement/prospectus can also be obtained, without
charge, in the “Investor Relations” section of the Company’s website at www.banksocal.com (for the Company’s
filings) and in the “Investor Relations” section of CBC’s website, www.californiabankofcommerce.com (for CBC’s
filings).
PARTICIPANTS
IN THE SOLICITATION
The
Company, CBC and certain of their respective directors and executive officers may be deemed to be participants in the solicitation of
proxies from the shareholders of the Company and CBC in connection with the Merger. Information regarding the Company’s directors
and executive officers and their ownership of Company common stock is available in the Company’s definitive proxy statement for
its 2023 annual meeting of shareholders filed with the SEC on June 13, 2023 and other documents filed by the Company with the SEC. Information
regarding CBC’s directors and executive officers and their ownership of CBC common stock is available in CBC’s definitive
proxy statement for its 2023 annual meeting of shareholders filed with the SEC on April 20, 2023 and other documents filed by CBC with
the SEC. Other information regarding the participants in the proxy solicitation and their ownership of common stock will be contained
in the joint proxy statement/prospectus relating to the Merger. Free copies of these documents may be obtained as described in the preceding
paragraph.
Southern
California Bancorp and Subsidiary
Financial
Highlights (Unaudited)
| | |
At
or for the Three
Months Ended | | |
At
or for the Year
Ended | |
| | |
December
31,
2023 | | |
September
30,
2023 | | |
December
31,
2022 | | |
December
31,
2023 | | |
December
31,
2022 | |
| |
($
in thousands except share and per share data) | |
| EARNINGS | |
| |
| Net
interest income | |
$ | 22,559 | | |
$ | 23,261 | | |
$ | 25,269 | | |
$ | 94,138 | | |
$ | 87,786 | |
| Provision
for (reversal of) credit losses | |
$ | 824 | | |
$ | (96 | ) | |
$ | 750 | | |
$ | 915 | | |
$ | 5,956 | |
| Noninterest
(loss) income | |
$ | (102 | ) | |
$ | 815 | | |
$ | 188 | | |
$ | 3,379 | | |
$ | 3,675 | |
| Noninterest
expense | |
$ | 15,339 | | |
$ | 14,781 | | |
$ | 13,112 | | |
$ | 59,746 | | |
$ | 63,522 | |
| Income
tax expense | |
$ | 1,882 | | |
$ | 2,835 | | |
$ | 3,121 | | |
$ | 10,946 | | |
$ | 5,870 | |
| Net
income | |
$ | 4,412 | | |
$ | 6,556 | | |
$ | 8,474 | | |
$ | 25,910 | | |
$ | 16,113 | |
| Pre-tax
pre-provision income (1) | |
$ | 7,118 | | |
$ | 9,295 | | |
$ | 12,345 | | |
$ | 37,771 | | |
$ | 27,939 | |
| Adjusted
pre-tax pre-provision income (1) | |
$ | 7,118 | | |
$ | 9,295 | | |
$ | 12,337 | | |
$ | 37,771 | | |
$ | 34,416 | |
| Diluted
earnings per share | |
$ | 0.24 | | |
$ | 0.35 | | |
$ | 0.46 | | |
$ | 1.39 | | |
$ | 0.88 | |
| Shares
outstanding at period end | |
| 18,369,115 | | |
| 18,309,282 | | |
| 17,940,283 | | |
| 18,369,115 | | |
| 17,940,283 | |
| | |
| | | |
| | | |
| | | |
| | | |
| | |
| PERFORMANCE
RATIOS | |
| | | |
| | | |
| | | |
| | | |
| | |
| Return
on average assets | |
| 0.75 | % | |
| 1.12 | % | |
| 1.46 | % | |
| 1.12 | % | |
| 0.70 | % |
| Adjusted
return on average assets (1) | |
| 0.75 | % | |
| 1.12 | % | |
| 1.45 | % | |
| 1.12 | % | |
| 0.90 | % |
| Return
on average common equity | |
| 6.21 | % | |
| 9.38 | % | |
| 13.21 | % | |
| 9.48 | % | |
| 6.44 | % |
| Adjusted
return on average common equity (1) | |
| 6.21 | % | |
| 9.38 | % | |
| 13.20 | % | |
| 9.48 | % | |
| 8.28 | % |
| Yield
on total loans | |
| 6.08 | % | |
| 5.97 | % | |
| 5.47 | % | |
| 5.94 | % | |
| 5.02 | % |
| Yield
on interest earning assets | |
| 5.85 | % | |
| 5.72 | % | |
| 5.14 | % | |
| 5.69 | % | |
| 4.33 | % |
| Cost
of deposits | |
| 1.81 | % | |
| 1.56 | % | |
| 0.51 | % | |
| 1.37 | % | |
| 0.23 | % |
| Cost
of funds | |
| 1.95 | % | |
| 1.62 | % | |
| 0.56 | % | |
| 1.46 | % | |
| 0.29 | % |
| Net
interest margin | |
| 4.05 | % | |
| 4.23 | % | |
| 4.62 | % | |
| 4.33 | % | |
| 4.06 | % |
| Efficiency
ratio (1) | |
| 68.30 | % | |
| 61.39 | % | |
| 51.51 | % | |
| 61.27 | % | |
| 69.45 | % |
| Adjusted
efficiency ratio (1) | |
| 68.30 | % | |
| 61.39 | % | |
| 51.54 | % | |
| 61.27 | % | |
| 62.37 | % |
| | |
As
of | |
| | |
December
31,
2023 | | |
September
30,
2023 | | |
December
31,
2022 | |
| |
| ($
in thousands except share and per share data) | |
| CAPITAL | |
| | |
| Tangible
equity to tangible assets (1) | |
| 10.73 | % | |
| 10.53 | % | |
| 9.84 | % |
| Book
value (BV) per common share | |
$ | 15.69 | | |
$ | 15.21 | | |
$ | 14.51 | |
| Tangible
BV per common share (1) | |
$ | 13.56 | | |
$ | 13.08 | | |
$ | 12.32 | |
| | |
| | | |
| | | |
| | |
| ASSET
QUALITY | |
| | | |
| | | |
| | |
| Allowance
for loan losses (ALL) | |
$ | 22,569 | | |
$ | 22,705 | | |
$ | 17,099 | |
| Reserve
for unfunded loan commitments | |
$ | 933 | | |
$ | 1,240 | | |
$ | 1,310 | |
| Allowance
for credit losses (ACL) | |
$ | 23,502 | | |
$ | 23,945 | | |
$ | 18,409 | |
| ALL
to total loans held for investment | |
| 1.15 | % | |
| 1.18 | % | |
| 0.90 | % |
| ACL
to total loans held for investment | |
| 1.20 | % | |
| 1.24 | % | |
| 0.97 | % |
| Nonperforming
loans | |
$ | 13,004 | | |
$ | 14,272 | | |
$ | 41 | |
| Other
real estate owned | |
$ | — | | |
$ | — | | |
$ | — | |
| Nonperforming
assets to total assets | |
| 0.55 | % | |
| 0.62 | % | |
| — | % |
| | |
| | | |
| | | |
| | |
| END
OF PERIOD BALANCES | |
| | | |
| | | |
| | |
| Total
loans, including loans held for sale | |
$ | 1,964,791 | | |
$ | 1,935,364 | | |
$ | 1,906,800 | |
| Total
assets | |
$ | 2,360,252 | | |
$ | 2,313,649 | | |
$ | 2,283,927 | |
| Deposits | |
$ | 1,943,556 | | |
$ | 1,983,857 | | |
$ | 1,931,905 | |
| Loans
to deposits | |
| 101.1 | % | |
| 97.6 | % | |
| 98.7 | % |
| Shareholders’
equity | |
$ | 288,152 | | |
$ | 278,550 | | |
$ | 260,355 | |
| (1) |
Non-GAAP measure. See – GAAP to Non-GAAP reconciliation |
| | |
At
or for the Three
Months Ended | | |
At
or for the Year
Ended | |
| ALLOWANCE
for CREDIT LOSSES | |
December
31,
2023 | | |
September
30,
2023 | | |
December
31,
2022 | | |
December
31,
2023 | | |
December
31,
2022 | |
| | |
($
in thousands) | |
| Allowance
for loan losses | |
| | | |
| | | |
| | | |
| | | |
| | |
| Balance
at beginning of period | |
$ | 22,705 | | |
$ | 22,502 | | |
$ | 16,436 | | |
$ | 17,099 | | |
$ | 11,657 | |
| Adoption
of ASU 2016-13 (1) | |
| — | | |
| — | | |
| — | | |
| 5,027 | | |
| — | |
| Provision
for credit losses | |
| 1,131 | | |
| 202 | | |
| 650 | | |
| 1,731 | | |
| 5,450 | |
| Charge-offs | |
| (1,267 | ) | |
| — | | |
| — | | |
| (1,303 | ) | |
| (21 | ) |
| Recoveries | |
| — | | |
| 1 | | |
| 13 | | |
| 15 | | |
| 13 | |
| Net
(charge-offs) recoveries | |
| (1,267 | ) | |
| 1 | | |
| 13 | | |
| (1,288 | ) | |
| (8 | ) |
| Balance,
end of period | |
$ | 22,569 | | |
$ | 22,705 | | |
$ | 17,099 | | |
$ | 22,569 | | |
$ | 17,099 | |
| Reserve
for unfunded loan commitments | |
| | | |
| | | |
| | | |
| | | |
| | |
| Balance,
beginning of period | |
$ | 1,240 | | |
$ | 1,538 | | |
$ | 1,210 | | |
$ | 1,310 | | |
$ | 804 | |
| Adoption
of ASU 2016-13 (1) | |
| — | | |
| — | | |
| — | | |
| 439 | | |
| — | |
| (Reversal
of) provision for credit losses | |
| (307 | ) | |
| (298 | ) | |
| 100 | | |
| (816 | ) | |
| 506 | |
| Balance,
end of period | |
| 933 | | |
| 1,240 | | |
| 1,310 | | |
| 933 | | |
| 1,310 | |
| Allowance
for credit losses | |
$ | 23,502 | | |
$ | 23,945 | | |
$ | 18,409 | | |
$ | 23,502 | | |
$ | 18,409 | |
| | |
| | | |
| | | |
| | | |
| | | |
| | |
| ALL
to total loans held for investment | |
| 1.15 | % | |
| 1.18 | % | |
| 0.90 | % | |
| 1.15 | % | |
| 0.90 | % |
| ACL
to total loans held for investment | |
| 1.20 | % | |
| 1.24 | % | |
| 0.97 | % | |
| 1.20 | % | |
| 0.97 | % |
| (1) |
Represents
the impact of adopting ASU 2016-13, Financial Instruments - Credit Losses on January 1, 2023. As a result of adopting ASU 2016-13,
our methodology to compute our allowance for credit losses is based on a current expected credit loss methodology, rather than the
previously applied incurred loss methodology. |
Southern
California Bancorp and Subsidiary
Balance
Sheets (Unaudited)
| | |
December
31,
2023 | | |
September
30,
2023 | | |
December
31,
2022 | |
| |
| ($
in thousands) | | |
| ASSETS | |
| | | |
| Cash
and due from banks | |
$ | 33,008 | | |
$ | 33,517 | | |
$ | 60,295 | |
| Federal
funds sold & interest-bearing balances | |
| 53,785 | | |
| 61,604 | | |
| 26,465 | |
| Total
cash and cash equivalents | |
| 86,793 | | |
| 95,121 | | |
| 86,760 | |
| | |
| | | |
| | | |
| | |
| Securities
available-for-sale, at fair value | |
| 130,035 | | |
| 111,840 | | |
| 112,580 | |
| Securities
held-to-maturity, at cost (fair value of $50,432 at December 31, 2023; $45,224 at September 30, 2023; and $47,906 at December 31,
2022) | |
| 53,616 | | |
| 53,699 | | |
| 53,946 | |
| Loans
held for sale | |
| 7,349 | | |
| 4,813 | | |
| 9,027 | |
| Loans
held for investment: | |
| | | |
| | | |
| | |
| Construction
& land development | |
| 243,521 | | |
| 237,320 | | |
| 239,067 | |
| 1-4
family residential | |
| 143,903 | | |
| 141,668 | | |
| 144,322 | |
| Multifamily | |
| 221,247 | | |
| 218,170 | | |
| 218,606 | |
| Other
commercial real estate | |
| 1,024,243 | | |
| 1,019,647 | | |
| 958,676 | |
| Commercial
& industrial | |
| 320,142 | | |
| 310,990 | | |
| 331,644 | |
| Other
consumer | |
| 4,386 | | |
| 2,756 | | |
| 5,458 | |
| Total
loans held for investment | |
| 1,957,442 | | |
| 1,930,551 | | |
| 1,897,773 | |
| Allowance
for credit losses - loans | |
| (22,569 | ) | |
| (22,705 | ) | |
| (17,099 | ) |
| Total
loans held for investment, net | |
| 1,934,873 | | |
| 1,907,846 | | |
| 1,880,674 | |
| | |
| | | |
| | | |
| | |
| Restricted
stock at cost | |
| 16,055 | | |
| 16,027 | | |
| 14,543 | |
| Premises
and equipment | |
| 13,270 | | |
| 13,565 | | |
| 14,334 | |
| Right
of use asset | |
| 9,291 | | |
| 10,007 | | |
| 8,607 | |
| Goodwill | |
| 37,803 | | |
| 37,803 | | |
| 37,803 | |
| Core
deposit intangible | |
| 1,195 | | |
| 1,275 | | |
| 1,584 | |
| Bank
owned life insurance | |
| 38,918 | | |
| 38,665 | | |
| 37,972 | |
| Deferred
taxes, net | |
| 11,137 | | |
| 12,542 | | |
| 10,699 | |
| Accrued
interest and other assets | |
| 19,917 | | |
| 10,446 | | |
| 15,398 | |
| Total
assets | |
$ | 2,360,252 | | |
$ | 2,313,649 | | |
$ | 2,283,927 | |
| | |
| | | |
| | | |
| | |
| LIABILITIES
AND SHAREHOLDERS’ EQUITY | |
| | | |
| | | |
| | |
| Deposits: | |
| | | |
| | | |
| | |
| Noninterest-bearing
demand | |
$ | 675,098 | | |
$ | 735,979 | | |
$ | 923,899 | |
| Interest-bearing
NOW accounts | |
| 381,943 | | |
| 354,489 | | |
| 209,625 | |
| Money
market and savings accounts | |
| 636,685 | | |
| 699,942 | | |
| 668,602 | |
| Time
deposits | |
| 249,830 | | |
| 193,447 | | |
| 129,779 | |
| Total
deposits | |
| 1,943,556 | | |
| 1,983,857 | | |
| 1,931,905 | |
| | |
| | | |
| | | |
| | |
| Borrowings | |
| 102,865 | | |
| 25,842 | | |
| 67,770 | |
| Operating
lease liability | |
| 12,117 | | |
| 12,657 | | |
| 11,055 | |
| Accrued
interest and other liabilities | |
| 13,562 | | |
| 12,743 | | |
| 12,842 | |
| Total
liabilities | |
| 2,072,100 | | |
| 2,035,099 | | |
| 2,023,572 | |
| | |
| | | |
| | | |
| | |
| Shareholders’
Equity: | |
| | | |
| | | |
| | |
| Common
stock - 50,000,000 shares authorized, no par value; issued and outstanding 18,369,115 at December 31, 2023; 18,309,282 at September
30, 2023 and 17,940,283 at December 31, 2022) | |
| 222,036 | | |
| 221,632 | | |
| 218,280 | |
| Retained
earnings | |
| 70,575 | | |
| 66,163 | | |
| 48,516 | |
| Accumulated
other comprehensive loss - net of taxes | |
| (4,459 | ) | |
| (9,245 | ) | |
| (6,441 | ) |
| Total
shareholders’ equity | |
| 288,152 | | |
| 278,550 | | |
| 260,355 | |
| Total
liabilities and shareholders’ equity | |
$ | 2,360,252 | | |
$ | 2,313,649 | | |
$ | 2,283,927 | |
Southern
California Bancorp and Subsidiary
Income
Statements - Quarterly and Year-to-Date (Unaudited)
| | |
Three
Months Ended | | |
Year
Ended | |
| | |
December
31,
2023 | | |
September
30,
2023 | | |
December
31,
2022 | | |
December
31,
2023 | | |
December
31,
2022 | |
| | |
($
in thousands except share and per share data) | |
| INTEREST
AND DIVIDEND INCOME | |
| | | |
| | | |
| | | |
| | | |
| | |
| Interest
and fees on loans | |
$ | 29,968 | | |
$ | 28,977 | | |
$ | 25,781 | | |
$ | 113,951 | | |
$ | 86,366 | |
| Interest
on debt securities | |
| 991 | | |
| 942 | | |
| 647 | | |
| 3,497 | | |
| 2,013 | |
| Interest
on tax-exempted debt securities | |
| 353 | | |
| 359 | | |
| 488 | | |
| 1,655 | | |
| 1,372 | |
| Interest
and dividends from other institutions | |
| 1,257 | | |
| 1,206 | | |
| 1,227 | | |
| 4,419 | | |
| 3,824 | |
| Total
interest and dividend income | |
| 32,569 | | |
| 31,484 | | |
| 28,143 | | |
| 123,522 | | |
| 93,575 | |
| | |
| | | |
| | | |
| | | |
| | | |
| | |
| INTEREST
EXPENSE | |
| | | |
| | | |
| | | |
| | | |
| | |
| Interest
on NOW, savings, and money market accounts | |
| 6,606 | | |
| 5,922 | | |
| 2,096 | | |
| 20,161 | | |
| 3,793 | |
| Interest
on time deposits | |
| 2,331 | | |
| 1,867 | | |
| 463 | | |
| 6,704 | | |
| 797 | |
| Interest
on borrowings | |
| 1,073 | | |
| 434 | | |
| 315 | | |
| 2,519 | | |
| 1,199 | |
| Total
interest expense | |
| 10,010 | | |
| 8,223 | | |
| 2,874 | | |
| 29,384 | | |
| 5,789 | |
| Net
interest income | |
| 22,559 | | |
| 23,261 | | |
| 25,269 | | |
| 94,138 | | |
| 87,786 | |
| | |
| | | |
| | | |
| | | |
| | | |
| | |
| Provision
for (reversal of) credit losses (1) | |
| 824 | | |
| (96 | ) | |
| 750 | | |
| 915 | | |
| 5,956 | |
| Net
interest income after provision for credit losses | |
| 21,735 | | |
| 23,357 | | |
| 24,519 | | |
| 93,223 | | |
| 81,830 | |
| | |
| | | |
| | | |
| | | |
| | | |
| | |
| NONINTEREST
(LOSS) INCOME | |
| | | |
| | | |
| | | |
| | | |
| | |
| Service
charges and fees on deposit accounts | |
| 507 | | |
| 470 | | |
| 456 | | |
| 1,946 | | |
| 1,796 | |
| (Loss)
gain on sale of loans | |
| — | | |
| (54 | ) | |
| 293 | | |
| 831 | | |
| 1,349 | |
| Bank
owned life insurance income | |
| 253 | | |
| 238 | | |
| 221 | | |
| 946 | | |
| 1,490 | |
| Servicing
and related income on loans | |
| 17 | | |
| 61 | | |
| 53 | | |
| 240 | | |
| 192 | |
| Loss
on sale of debt securities | |
| (1,008 | ) | |
| — | | |
| (994 | ) | |
| (974 | ) | |
| (994 | ) |
| Loss
on sale of building and related fixed assets | |
| — | | |
| — | | |
| — | | |
| — | | |
| (768 | ) |
| Other
charges and fees | |
| 129 | | |
| 100 | | |
| 159 | | |
| 390 | | |
| 610 | |
| Total
noninterest (loss) income | |
| (102 | ) | |
| 815 | | |
| 188 | | |
| 3,379 | | |
| 3,675 | |
| | |
| | | |
| | | |
| | | |
| | | |
| | |
| NONINTEREST
EXPENSE | |
| | | |
| | | |
| | | |
| | | |
| | |
| Salaries
and employee benefits | |
| 9,598 | | |
| 9,736 | | |
| 8,634 | | |
| 39,249 | | |
| 37,069 | |
| Occupancy
and equipment expenses | |
| 1,678 | | |
| 1,579 | | |
| 1,458 | | |
| 6,231 | | |
| 6,210 | |
| Data
processing | |
| 1,158 | | |
| 1,144 | | |
| 1,089 | | |
| 4,534 | | |
| 4,609 | |
| Legal,
audit and professional | |
| 1,161 | | |
| 598 | | |
| 487 | | |
| 3,211 | | |
| 2,597 | |
| Regulatory
assessments | |
| 320 | | |
| 369 | | |
| 345 | | |
| 1,508 | | |
| 1,550 | |
| Director
and shareholder expenses | |
| 207 | | |
| 215 | | |
| 219 | | |
| 849 | | |
| 946 | |
| Merger
and related (income) expenses | |
| — | | |
| — | | |
| (8 | ) | |
| — | | |
| 1,177 | |
| Core
deposit intangible amortization | |
| 80 | | |
| 128 | | |
| 140 | | |
| 389 | | |
| 438 | |
| Litigation
settlements, net | |
| — | | |
| — | | |
| — | | |
| — | | |
| 5,525 | |
| Other
expense | |
| 1,137 | | |
| 1,012 | | |
| 748 | | |
| 3,775 | | |
| 3,401 | |
| Total
noninterest expense | |
| 15,339 | | |
| 14,781 | | |
| 13,112 | | |
| 59,746 | | |
| 63,522 | |
| Income
before income taxes | |
| 6,294 | | |
| 9,391 | | |
| 11,595 | | |
| 36,856 | | |
| 21,983 | |
| Income
tax expense | |
| 1,882 | | |
| 2,835 | | |
| 3,121 | | |
| 10,946 | | |
| 5,870 | |
| Net
income | |
$ | 4,412 | | |
$ | 6,556 | | |
$ | 8,474 | | |
$ | 25,910 | | |
$ | 16,113 | |
| | |
| | | |
| | | |
| | | |
| | | |
| | |
| Net
income per share - basic | |
$ | 0.24 | | |
$ | 0.36 | | |
$ | 0.47 | | |
$ | 1.42 | | |
$ | 0.90 | |
| Net
income per share - diluted | |
$ | 0.24 | | |
$ | 0.35 | | |
$ | 0.46 | | |
$ | 1.39 | | |
$ | 0.88 | |
| Weighted
average common share-diluted | |
| 18,727,519 | | |
| 18,672,132 | | |
| 18,359,781 | | |
| 18,656,742 | | |
| 18,228,287 | |
| Pre-tax,
pre-provision income (2) | |
$ | 7,118 | | |
$ | 9,295 | | |
$ | 12,345 | | |
$ | 37,771 | | |
$ | 27,939 | |
| (1) |
Included (reversal of) provision for unfunded commitments
of $(307) thousand, $(298) thousand and $100 thousand for the three months ended December 31, 2023, September 30, 2023 and December 31,
2022, respectively; and $(816) thousand and $506 thousand for the year ended December 31, 2023 and December 31, 2022, respectively. |
| (2) |
Non-GAAP measure. See – GAAP to Non-GAAP reconciliation. |
Southern
California Bancorp and Subsidiary
Average
Balance Sheets and Yield Analysis
(Unaudited)
| | |
Three
Months Ended | |
| | |
December
31, 2023 | | |
September
30, 2023 | | |
December
31, 2022 | |
| | |
Average
Balance | | |
Income/ Expense | | |
Yield/ Cost | | |
Average
Balance | | |
Income/ Expense | | |
Yield/ Cost | | |
Average
Balance | | |
Income/ Expense | | |
Yield/ Cost | |
| |
($
in thousands) | |
| Assets | |
| |
| Interest-earning
assets: | |
| | | |
| | | |
| | | |
| | | |
| | | |
| | | |
| | | |
| | | |
| | |
| Total
loans | |
$ | 1,954,396 | | |
$ | 29,968 | | |
| 6.08 | % | |
$ | 1,924,384 | | |
$ | 28,977 | | |
| 5.97 | % | |
$ | 1,870,705 | | |
$ | 25,781 | | |
| 5.47 | % |
| Taxable
debt securities | |
| 113,375 | | |
| 991 | | |
| 3.47 | % | |
| 111,254 | | |
| 942 | | |
| 3.36 | % | |
| 102,205 | | |
| 647 | | |
| 2.51 | % |
| Tax-exempt
debt securities (1) | |
| 58,644 | | |
| 353 | | |
| 3.02 | % | |
| 59,630 | | |
| 359 | | |
| 3.02 | % | |
| 73,166 | | |
| 488 | | |
| 3.35 | % |
| Deposits
in other financial institutions | |
| 56,313 | | |
| 759 | | |
| 5.35 | % | |
| 50,367 | | |
| 681 | | |
| 5.36 | % | |
| 40,781 | | |
| 347 | | |
| 3.38 | % |
| Fed
funds sold/resale agreements | |
| 9,008 | | |
| 125 | | |
| 5.51 | % | |
| 20,653 | | |
| 283 | | |
| 5.44 | % | |
| 68,437 | | |
| 636 | | |
| 3.69 | % |
| Restricted
stock investments and other bank stock | |
| 16,394 | | |
| 373 | | |
| 9.03 | % | |
| 16,365 | | |
| 242 | | |
| 5.87 | % | |
| 14,883 | | |
| 244 | | |
| 6.50 | % |
| Total
interest-earning assets | |
| 2,208,130 | | |
| 32,569 | | |
| 5.85 | % | |
| 2,182,653 | | |
| 31,484 | | |
| 5.72 | % | |
| 2,170,177 | | |
| 28,143 | | |
| 5.14 | % |
| Total
noninterest-earning assets | |
| 137,193 | | |
| | | |
| | | |
| 131,288 | | |
| | | |
| | | |
| 139,205 | | |
| | | |
| | |
| Total
assets | |
$ | 2,345,323 | | |
| | | |
| | | |
$ | 2,313,941 | | |
| | | |
| | | |
$ | 2,309,382 | | |
| | | |
| | |
| | |
| | | |
| | | |
| | | |
| | | |
| | | |
| | | |
| | | |
| | | |
| | |
| Liabilities
and Shareholders’ Equity | |
| | | |
| | | |
| | | |
| | | |
| | | |
| | | |
| | | |
| | | |
| | |
| Interest-bearing
liabilities: | |
| | | |
| | | |
| | | |
| | | |
| | | |
| | | |
| | | |
| | | |
| | |
| Interest-bearing
NOW accounts | |
$ | 362,579 | | |
$ | 1,860 | | |
| 2.04 | % | |
$ | 353,714 | | |
$ | 1,706 | | |
| 1.91 | % | |
$ | 215,272 | | |
$ | 121 | | |
| 0.22 | % |
| Money
market and savings accounts | |
| 669,391 | | |
| 4,746 | | |
| 2.81 | % | |
| 675,609 | | |
| 4,216 | | |
| 2.48 | % | |
| 700,544 | | |
| 1,975 | | |
| 1.12 | % |
| Time
deposits | |
| 208,700 | | |
| 2,331 | | |
| 4.43 | % | |
| 183,745 | | |
| 1,867 | | |
| 4.03 | % | |
| 123,524 | | |
| 463 | | |
| 1.49 | % |
| Total
interest-bearing deposits | |
| 1,240,670 | | |
| 8,937 | | |
| 2.86 | % | |
| 1,213,068 | | |
| 7,789 | | |
| 2.55 | % | |
| 1,039,340 | | |
| 2,559 | | |
| 0.98 | % |
| Borrowings: | |
| | | |
| | | |
| | | |
| | | |
| | | |
| | | |
| | | |
| | | |
| | |
| FHLB
advances | |
| 56,380 | | |
| 802 | | |
| 5.64 | % | |
| 11,731 | | |
| 163 | | |
| 5.51 | % | |
| 3,696 | | |
| 44 | | |
| 4.72 | % |
| Subordinated
debt | |
| 17,854 | | |
| 271 | | |
| 6.02 | % | |
| 17,830 | | |
| 271 | | |
| 6.03 | % | |
| 17,759 | | |
| 271 | | |
| 6.05 | % |
| Total
borrowings | |
| 74,234 | | |
| 1,073 | | |
| 5.73 | % | |
| 29,561 | | |
| 434 | | |
| 5.82 | % | |
| 21,455 | | |
| 315 | | |
| 5.82 | % |
| Total
interest-bearing liabilities | |
| 1,314,904 | | |
| 10,010 | | |
| 3.02 | % | |
| 1,242,629 | | |
| 8,223 | | |
| 2.63 | % | |
| 1,060,795 | | |
| 2,874 | | |
| 1.07 | % |
| | |
| | | |
| | | |
| | | |
| | | |
| | | |
| | | |
| | | |
| | | |
| | |
| Noninterest-bearing
liabilities: | |
| | | |
| | | |
| | | |
| | | |
| | | |
| | | |
| | | |
| | | |
| | |
| Noninterest-bearing
deposits (2) | |
| 721,169 | | |
| | | |
| | | |
| 768,148 | | |
| | | |
| | | |
| 970,908 | | |
| | | |
| | |
| Other
liabilities | |
| 27,178 | | |
| | | |
| | | |
| 25,722 | | |
| | | |
| | | |
| 23,199 | | |
| | | |
| | |
| Shareholders’
equity | |
| 282,072 | | |
| | | |
| | | |
| 277,442 | | |
| | | |
| | | |
| 254,480 | | |
| | | |
| | |
| Total
Liabilities and Shareholders’ Equity | |
$ | 2,345,323 | | |
| | | |
| | | |
$ | 2,313,941 | | |
| | | |
| | | |
$ | 2,309,382 | | |
| | | |
| | |
| | |
| | | |
| | | |
| | | |
| | | |
| | | |
| | | |
| | | |
| | | |
| | |
| Net
interest spread | |
| | | |
| | | |
| 2.83 | % | |
| | | |
| | | |
| 3.09 | % | |
| | | |
| | | |
| 4.07 | % |
| Net
interest income and margin | |
| | | |
$ | 22,559 | | |
| 4.05 | % | |
| | | |
$ | 23,261 | | |
| 4.23 | % | |
| | | |
$ | 25,269 | | |
| 4.62 | % |
| Cost
of deposits | |
| | | |
| | | |
| 1.81 | % | |
| | | |
| | | |
| 1.56 | % | |
| | | |
| | | |
| 0.51 | % |
| Cost
of funds | |
| | | |
| | | |
| 1.95 | % | |
| | | |
| | | |
| 1.62 | % | |
| | | |
| | | |
| 0.56 | % |
| (1) |
Tax-exempt debt securities yields are presented on a tax
equivalent basis using a 21% tax rate. |
| (2) |
Average noninterest-bearing deposits represent 36.76%, 38.77%
and 48.30% of average total deposits for the three months ended December 31, 2023, September 30, 2023 and December 31, 2022, respectively. |
Southern
California Bancorp and Subsidiary
Average
Balance Sheets and Yield Analysis
(Unaudited)
| | |
Year
Ended | |
| | |
December
31, 2023 | | |
December
31, 2022 | |
| | |
Average
Balance | | |
Income/ Expense | | |
Yield/ Cost | | |
Average
Balance | | |
Income/ Expense | | |
Yield/ Cost | |
| |
($
in thousands) | |
| Assets | |
| |
| Interest-earning
assets: | |
| | | |
| | | |
| | | |
| | | |
| | | |
| | |
| Total
loans | |
$ | 1,918,443 | | |
$ | 113,951 | | |
| 5.94 | % | |
$ | 1,720,560 | | |
$ | 86,366 | | |
| 5.02 | % |
| Taxable
debt securities | |
| 107,021 | | |
| 3,497 | | |
| 3.27 | % | |
| 96,357 | | |
| 2,013 | | |
| 2.09 | % |
| Tax-exempt
debt securities (1) | |
| 65,674 | | |
| 1,655 | | |
| 3.19 | % | |
| 54,744 | | |
| 1,372 | | |
| 3.17 | % |
| Deposits
in other financial institutions | |
| 46,826 | | |
| 2,434 | | |
| 5.20 | % | |
| 210,467 | | |
| 1,508 | | |
| 0.72 | % |
| Fed
funds sold/resale agreements | |
| 18,114 | | |
| 923 | | |
| 5.10 | % | |
| 65,172 | | |
| 1,388 | | |
| 2.13 | % |
| Restricted
stock investments and other bank stock | |
| 15,930 | | |
| 1,062 | | |
| 6.67 | % | |
| 14,668 | | |
| 928 | | |
| 6.33 | % |
| Total
interest-earning assets | |
| 2,172,008 | | |
| 123,522 | | |
| 5.69 | % | |
| 2,161,968 | | |
| 93,575 | | |
| 4.33 | % |
| Total
noninterest-earning assets | |
| 134,225 | | |
| | | |
| | | |
| 139,450 | | |
| | | |
| | |
| Total
assets | |
$ | 2,306,233 | | |
| | | |
| | | |
$ | 2,301,418 | | |
| | | |
| | |
| | |
| | | |
| | | |
| | | |
| | | |
| | | |
| | |
| Liabilities
and Shareholders’ Equity | |
| | | |
| | | |
| | | |
| | | |
| | | |
| | |
| Interest-bearing
liabilities: | |
| | | |
| | | |
| | | |
| | | |
| | | |
| | |
| Interest-bearing
NOW accounts | |
$ | 308,537 | | |
$ | 5,161 | | |
| 1.67 | % | |
$ | 211,075 | | |
$ | 312 | | |
| 0.15 | % |
| Money
market and savings accounts | |
| 673,176 | | |
| 15,000 | | |
| 2.23 | % | |
| 690,830 | | |
| 3,481 | | |
| 0.50 | % |
| Time
deposits | |
| 180,219 | | |
| 6,704 | | |
| 3.72 | % | |
| 100,746 | | |
| 797 | | |
| 0.79 | % |
| Total
interest-bearing deposits | |
| 1,161,932 | | |
| 26,865 | | |
| 2.31 | % | |
| 1,002,651 | | |
| 4,590 | | |
| 0.46 | % |
| Borrowings: | |
| | | |
| | | |
| | | |
| | | |
| | | |
| | |
| FHLB
advances | |
| 26,390 | | |
| 1,434 | | |
| 5.43 | % | |
| 932 | | |
| 43 | | |
| 4.61 | % |
| Subordinated
debt | |
| 17,818 | | |
| 1,085 | | |
| 6.09 | % | |
| 17,723 | | |
| 1,086 | | |
| 6.13 | % |
| TruPS | |
| — | | |
| — | | |
| — | % | |
| 1,239 | | |
| 70 | | |
| 5.65 | % |
| Total
borrowings | |
| 44,208 | | |
| 2,519 | | |
| 5.70 | % | |
| 19,894 | | |
| 1,199 | | |
| 6.03 | % |
| Total
interest-bearing liabilities | |
| 1,206,140 | | |
| 29,384 | | |
| 2.44 | % | |
| 1,022,545 | | |
| 5,789 | | |
| 0.57 | % |
| | |
| | | |
| | | |
| | | |
| | | |
| | | |
| | |
| Noninterest-bearing
liabilities: | |
| | | |
| | | |
| | | |
| | | |
| | | |
| | |
| Noninterest-bearing
deposits (2) | |
| 801,882 | | |
| | | |
| | | |
| 1,006,795 | | |
| | | |
| | |
| Other
liabilities | |
| 24,865 | | |
| | | |
| | | |
| 22,024 | | |
| | | |
| | |
| Shareholders’
equity | |
| 273,346 | | |
| | | |
| | | |
| 250,054 | | |
| | | |
| | |
| | |
| | | |
| | | |
| | | |
| | | |
| | | |
| | |
| Total
Liabilities and Shareholders’ Equity | |
$ | 2,306,233 | | |
| | | |
| | | |
$ | 2,301,418 | | |
| | | |
| | |
| | |
| | | |
| | | |
| | | |
| | | |
| | | |
| | |
| Net
interest spread | |
| | | |
| | | |
| 3.25 | % | |
| | | |
| | | |
| 3.76 | % |
| Net
interest income and margin | |
| | | |
$ | 94,138 | | |
| 4.33 | % | |
| | | |
$ | 87,786 | | |
| 4.06 | % |
| Cost
of deposits | |
| | | |
| | | |
| 1.37 | % | |
| | | |
| | | |
| 0.23 | % |
| Cost
of funds | |
| | | |
| | | |
| 1.46 | % | |
| | | |
| | | |
| 0.29 | % |
| (1) |
Tax-exempt
debt securities yields are presented on a tax equivalent basis using a 21% tax rate. |
| (2) |
Average
noninterest-bearing deposits represent 40.83%, and 50.10% of average total deposits for the year ended December 31, 2023 and December
31, 2022, respectively. |
Southern
California Bancorp and Subsidiary
GAAP
to Non-GAAP Reconciliation
(Unaudited)
The
following tables present a reconciliation of non-GAAP financial measures to GAAP measures for: (1) adjusted net income, (2) efficiency
ratio, (3) adjusted efficiency ratio, (4) pre-tax pre-provision income, (5) adjusted pre-tax pre-provision income, (6) average tangible
common equity, (7) adjusted return on average assets, (8) adjusted return on average equity, (9) return on average tangible common equity,
(10) adjusted return on average tangible common equity, (11) tangible common equity, (12) tangible assets, (13) tangible common equity
to tangible asset ratio, and (14) tangible book value per share. We believe the presentation of certain non-GAAP financial measures provides
useful information to assess our consolidated financial condition and consolidated results of operations and to assist investors in evaluating
our financial results relative to our peers. These non-GAAP financial measures complement our GAAP reporting and are presented below
to provide investors and others with information that we use to manage the business each period. Because not all companies use identical
calculations, the presentation of these non-GAAP financial measures may not be comparable to other similarly titled measures used by
other companies. These non-GAAP measures should be taken together with the corresponding GAAP measures and should not be considered a
substitute of the GAAP measures.
| | |
Three
Months Ended | | |
Year
Ended | |
| | |
December
31,
2023 | | |
September
30,
2023 | | |
December
31,
2022 | | |
December
31,
2023 | | |
December
31,
2022 | |
| | |
($
in thousands) | |
| Adjusted
net income | |
| | | |
| | | |
| | | |
| | | |
| | |
| Net
income | |
$ | 4,412 | | |
$ | 6,556 | | |
$ | 8,474 | | |
$ | 25,910 | | |
$ | 16,113 | |
| (Deduct)
add: After-tax merger and related (income) expenses (1) | |
| — | | |
| — | | |
| (6 | ) | |
| — | | |
| 846 | |
| Add:
After-tax litigation settlements, net (1) | |
| — | | |
| — | | |
| — | | |
| — | | |
| 3,734 | |
| Adjusted
net income (non-GAAP) | |
$ | 4,412 | | |
$ | 6,556 | | |
$ | 8,468 | | |
$ | 25,910 | | |
$ | 20,693 | |
| | |
| | | |
| | | |
| | | |
| | | |
| | |
| Efficiency
Ratio | |
| | | |
| | | |
| | | |
| | | |
| | |
| Noninterest
expense | |
$ | 15,339 | | |
$ | 14,781 | | |
$ | 13,112 | | |
$ | 59,746 | | |
$ | 63,522 | |
| (Add)
deduct: Merger and related (income) expenses | |
| — | | |
| — | | |
| (8 | ) | |
| — | | |
| 1,177 | |
| Deduct:
Litigation settlements, net | |
| — | | |
| — | | |
| — | | |
| — | | |
| 5,300 | |
| Adjusted
noninterest expense | |
| 15,339 | | |
| 14,781 | | |
| 13,120 | | |
| 59,746 | | |
| 57,045 | |
| | |
| | | |
| | | |
| | | |
| | | |
| | |
| Net
interest income | |
| 22,559 | | |
| 23,261 | | |
| 25,269 | | |
| 94,138 | | |
| 87,786 | |
| Noninterest
(loss) income | |
| (102 | ) | |
| 815 | | |
| 188 | | |
| 3,379 | | |
| 3,675 | |
| Total
net interest income and noninterest (loss) income | |
$ | 22,457 | | |
$ | 24,076 | | |
$ | 25,457 | | |
$ | 97,517 | | |
$ | 91,461 | |
| Efficiency
ratio (non-GAAP) | |
| 68.3 | % | |
| 61.4 | % | |
| 51.5 | % | |
| 61.3 | % | |
| 69.5 | % |
| Adjusted
efficiency ratio (non-GAAP) | |
| 68.3 | % | |
| 61.4 | % | |
| 51.5 | % | |
| 61.3 | % | |
| 62.4 | % |
| | |
| | | |
| | | |
| | | |
| | | |
| | |
| Pre-tax
pre-provision income | |
| | | |
| | | |
| | | |
| | | |
| | |
| Net
interest income | |
$ | 22,559 | | |
$ | 23,261 | | |
$ | 25,269 | | |
$ | 94,138 | | |
$ | 87,786 | |
| Noninterest
(loss) income | |
| (102 | ) | |
| 815 | | |
| 188 | | |
| 3,379 | | |
| 3,675 | |
| Total
net interest income and noninterest (loss) income | |
| 22,457 | | |
| 24,076 | | |
| 25,457 | | |
| 97,517 | | |
| 91,461 | |
| Less:
Noninterest expense | |
| 15,339 | | |
| 14,781 | | |
| 13,112 | | |
| 59,746 | | |
| 63,522 | |
| Pre-tax
pre-provision income (non-GAAP) | |
| 7,118 | | |
| 9,295 | | |
| 12,345 | | |
| 37,771 | | |
| 27,939 | |
| (Deduct)
add: Merger and related (income) expenses | |
| — | | |
| — | | |
| (8 | ) | |
| — | | |
| 1,177 | |
| Add:
Litigation settlements, net | |
| — | | |
| — | | |
| — | | |
| — | | |
| 5,300 | |
| Adjusted
pre-tax pre-provision income (non-GAAP) | |
$ | 7,118 | | |
$ | 9,295 | | |
$ | 12,337 | | |
$ | 37,771 | | |
$ | 34,416 | |
| (1) |
After-tax
merger and related expenses and litigation settlements, net are presented using a 29.56% tax rate. |
| | |
Three
Months Ended | | |
Year
Ended | |
| | |
December
31,
2023 | | |
September
30,
2023 | | |
December
31,
2022 | | |
December
31,
2023 | | |
December
31,
2022 | |
| Return
on Average Assets, Equity, and Tangible Equity | |
($
in thousands) |
| Net
income | |
$ | 4,412 | | |
$ | 6,556 | | |
$ | 8,474 | | |
$ | 25,910 | | |
$ | 16,113 | |
| Adjusted
net income (non-GAAP) | |
$ | 4,412 | | |
$ | 6,556 | | |
$ | 8,468 | | |
$ | 25,910 | | |
$ | 20,693 | |
| | |
| | | |
| | | |
| | | |
| | | |
| | |
| Average
assets | |
$ | 2,345,323 | | |
$ | 2,313,941 | | |
$ | 2,309,382 | | |
$ | 2,306,233 | | |
$ | 2,301,418 | |
| Average
shareholders’ equity | |
| 282,072 | | |
| 277,442 | | |
| 254,480 | | |
| 273,346 | | |
| 250,054 | |
| Less:
Average intangible assets | |
| 39,035 | | |
| 39,158 | | |
| 39,475 | | |
| 39,195 | | |
| 38,960 | |
| Average
tangible common equity (non-GAAP) | |
$ | 243,037 | | |
$ | 238,284 | | |
$ | 215,005 | | |
$ | 234,151 | | |
$ | 211,094 | |
| | |
| | | |
| | | |
| | | |
| | | |
| | |
| Return
on average assets | |
| 0.75 | % | |
| 1.12 | % | |
| 1.46 | % | |
| 1.12 | % | |
| 0.70 | % |
| Adjusted
return on average assets (non-GAAP) | |
| 0.75 | % | |
| 1.12 | % | |
| 1.45 | % | |
| 1.12 | % | |
| 0.90 | % |
| Return
on average equity | |
| 6.21 | % | |
| 9.38 | % | |
| 13.21 | % | |
| 9.48 | % | |
| 6.44 | % |
| Adjusted
return on average equity (non-GAAP) | |
| 6.21 | % | |
| 9.38 | % | |
| 13.20 | % | |
| 9.48 | % | |
| 8.28 | % |
| Return
on average tangible common equity (non-GAAP) | |
| 7.20 | % | |
| 10.92 | % | |
| 15.64 | % | |
| 11.07 | % | |
| 7.63 | % |
| Adjusted
return on average tangible common equity (non-GAAP) | |
| 7.20 | % | |
| 10.92 | % | |
| 15.63 | % | |
| 11.07 | % | |
| 9.80 | % |
| | |
December
31,
2023 | | |
September
30,
2023 | | |
December
31,
2022 | |
| | |
($
in thousands except share and per share data) | |
| Tangible
Common Equity Ratio/Tangible Book Value Per Share | |
| | | |
| | | |
| | |
| Shareholders’
equity | |
$ | 288,152 | | |
$ | 278,550 | | |
$ | 260,355 | |
| Less:
Intangible assets | |
| 38,998 | | |
| 39,078 | | |
| 39,387 | |
| Tangible
common equity (non-GAAP) | |
$ | 249,154 | | |
$ | 239,472 | | |
$ | 220,968 | |
| | |
| | | |
| | | |
| | |
| Total
assets | |
$ | 2,360,252 | | |
$ | 2,313,649 | | |
$ | 2,283,927 | |
| Less:
Intangible assets | |
| 38,998 | | |
| 39,078 | | |
| 39,387 | |
| Tangible
assets (non-GAAP) | |
$ | 2,321,254 | | |
$ | 2,274,571 | | |
$ | 2,244,540 | |
| | |
| | | |
| | | |
| | |
| Equity
to asset ratio | |
| 12.21 | % | |
| 12.04 | % | |
| 11.40 | % |
| Tangible
common equity to tangible asset ratio (non-GAAP) | |
| 10.73 | % | |
| 10.53 | % | |
| 9.84 | % |
| Book
value per share | |
$ | 15.69 | | |
$ | 15.21 | | |
$ | 14.51 | |
| Tangible
book value per share (non-GAAP) | |
$ | 13.56 | | |
$ | 13.08 | | |
$ | 12.32 | |
| Shares
outstanding | |
| 18,369,115 | | |
| 18,309,282 | | |
| 17,940,283 | |
INVESTOR
RELATIONS CONTACT
Kevin
Mc Cabe
Bank
of Southern California
kmccabe@banksocal.com
818.637.7065
Exhibit 99.2


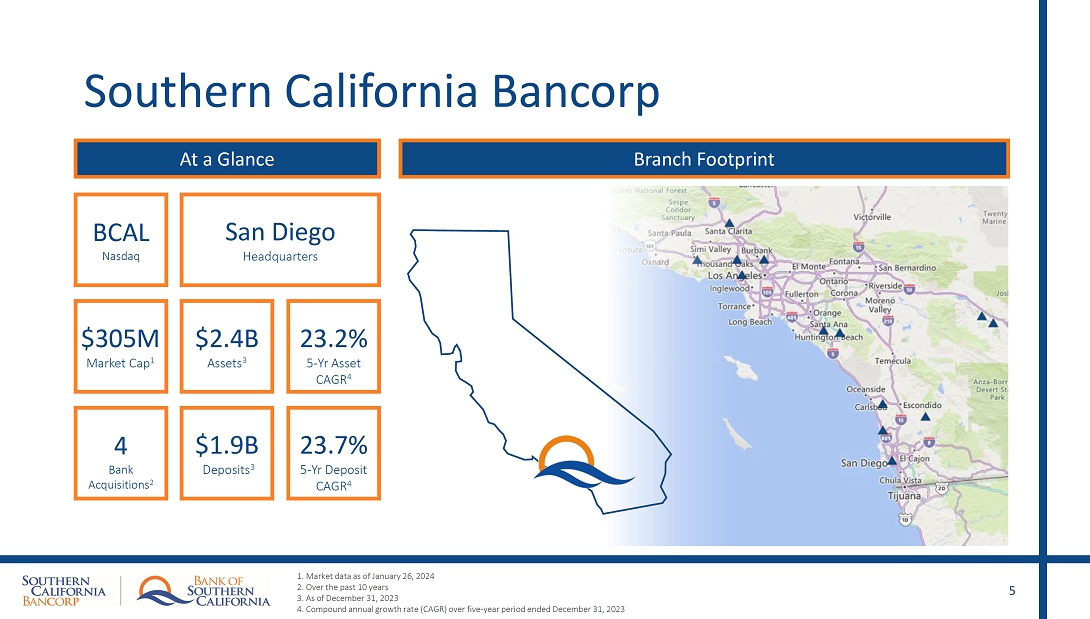


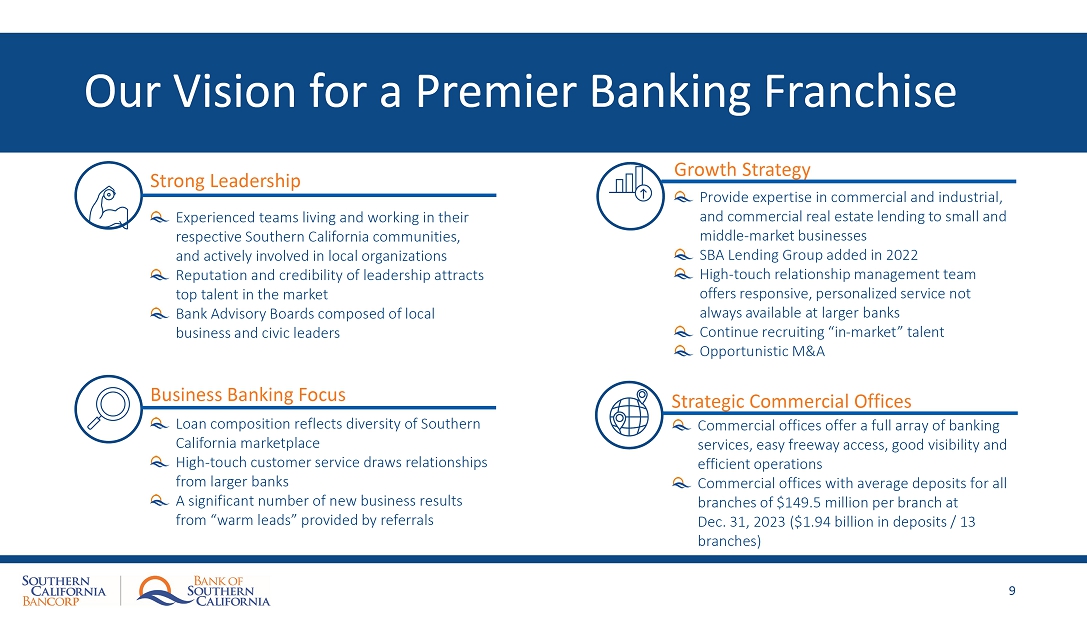


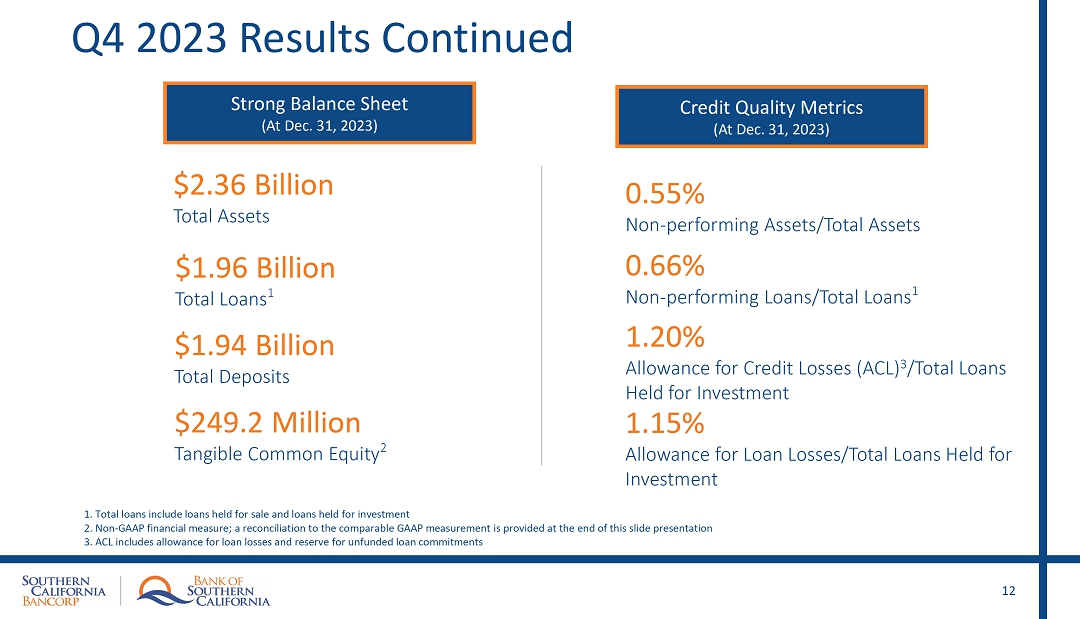


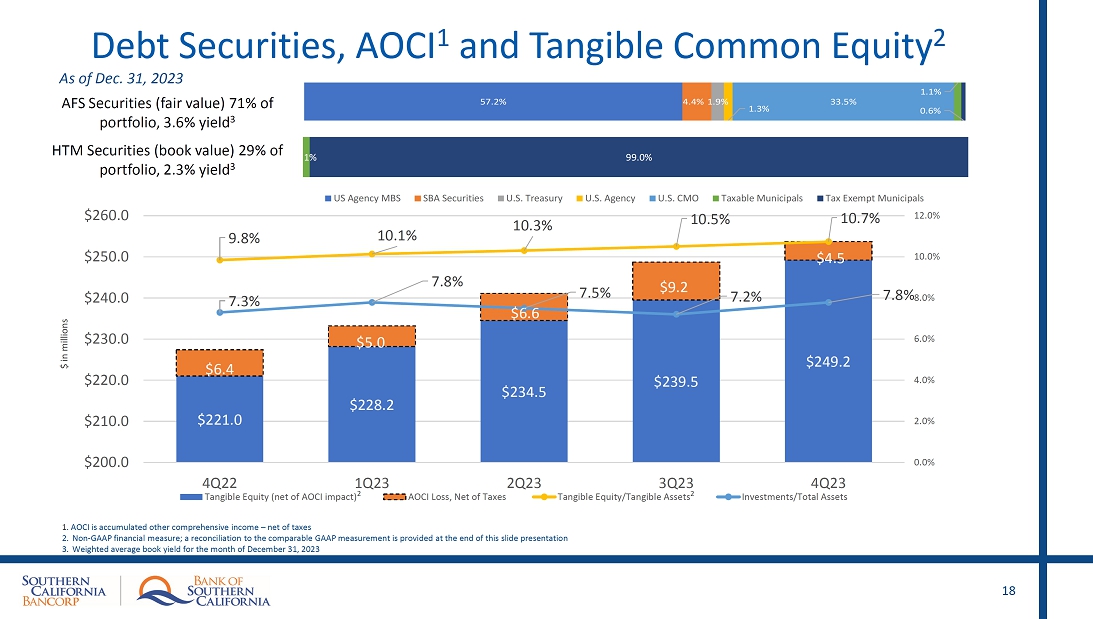

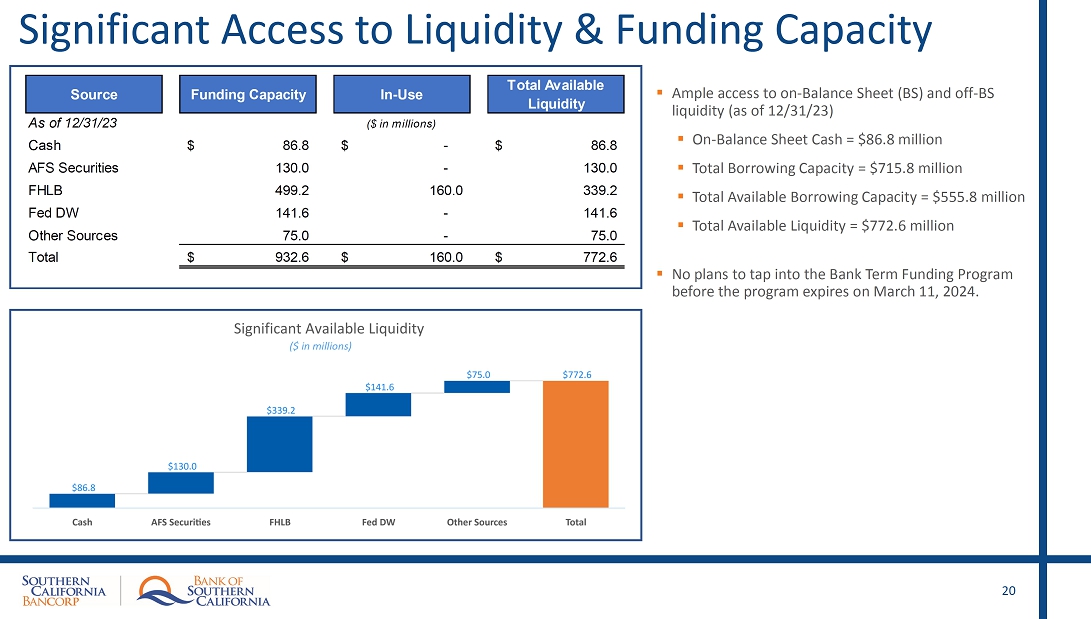


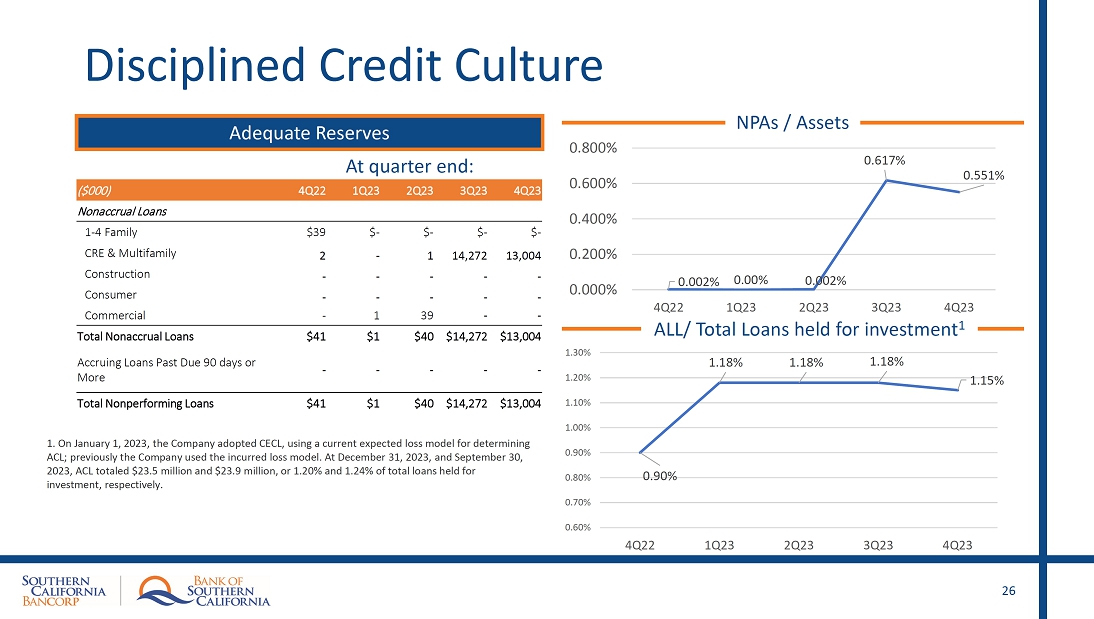
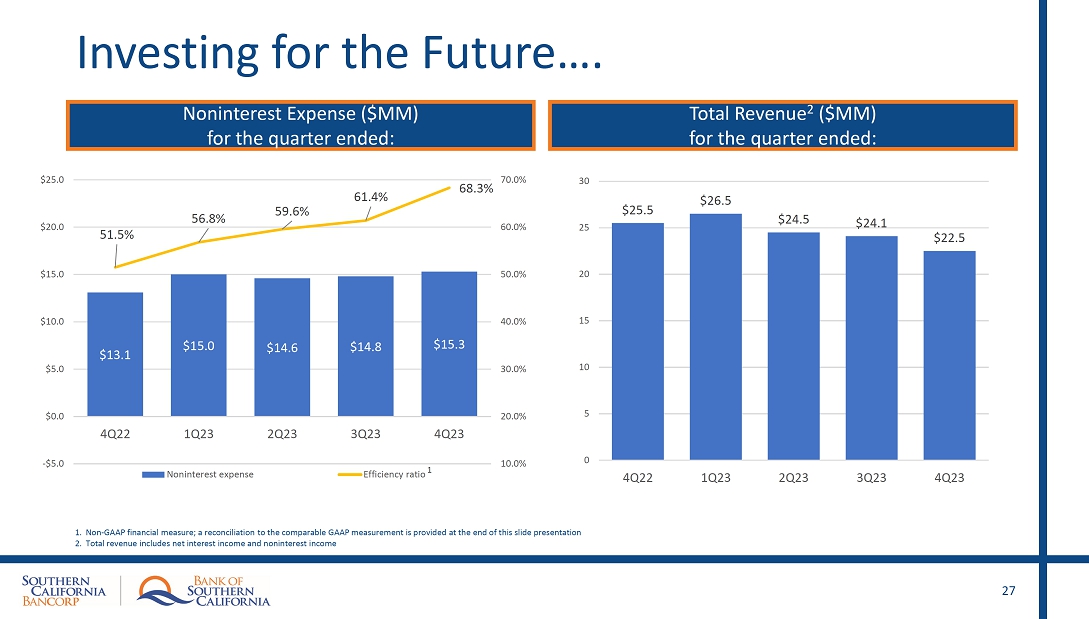
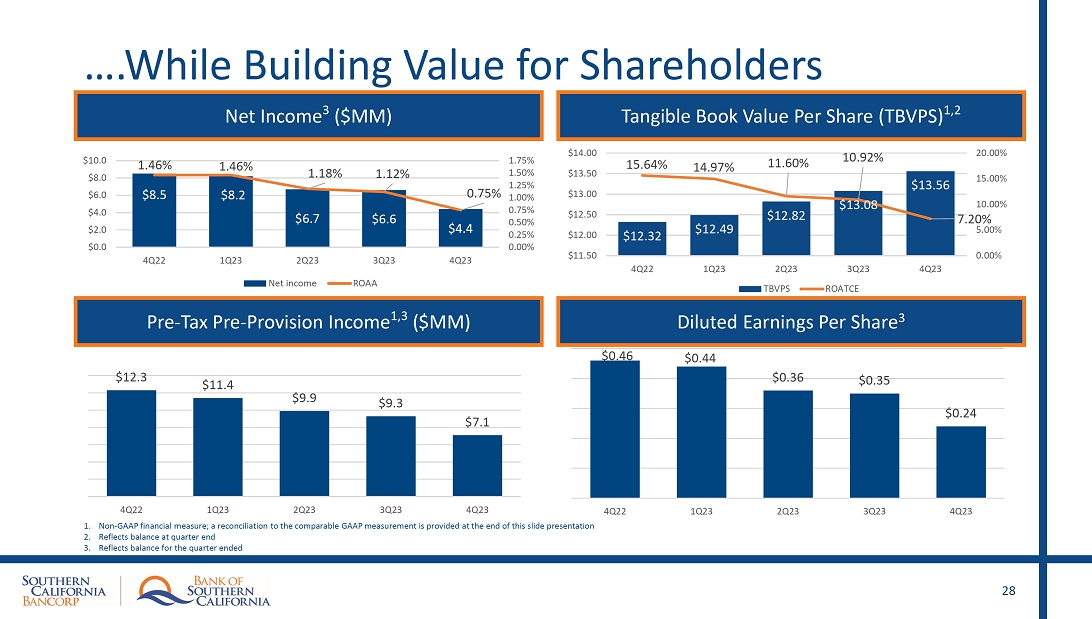


California BanCorp (NASDAQ:CALB)
Historical Stock Chart
From Apr 2024 to May 2024

California BanCorp (NASDAQ:CALB)
Historical Stock Chart
From May 2023 to May 2024
