0001406666FALSE00014066662022-07-152022-07-15
UNITED STATES
SECURITIES AND EXCHANGE COMMISSION
WASHINGTON, D.C. 20549
FORM 8-K
CURRENT REPORT
Pursuant to Section 13 or 15(d) of the
Securities Exchange Act of 1934
Date of Report (Date of earliest event reported): January 29, 2024
CALIX, INC.
(Exact name of Registrant as specified in its charter)
| | | | | | | | | | | | | | |
| | | | |
| Delaware | | 001-34674 | | 68-0438710 |
(State or other jurisdiction
of incorporation) | | (Commission
File No.) | | (I.R.S. Employer
Identification No.) |
| | |
2777 Orchard Parkway, San Jose, California | | 95134 |
| (Address of principal executive offices) | | (Zip Code) |
| | |
(408) 514-3000 |
| (Registrant’s telephone number, including area code) |
| | |
| Not Applicable |
| (Former name or former address if changed since last report) |
Check the appropriate box below if the Form 8-K filing is intended to simultaneously satisfy the filing obligation of the registrant under any of the following provisions:
| | | | | |
| ☐ | Written communications pursuant to Rule 425 under the Securities Act (17 CFR 230.425) |
| | | | | |
| ☐ | Soliciting material pursuant to Rule 14a-12 under the Exchange Act (17 CFR 240.14a-12) |
| | | | | |
| ☐ | Pre-commencement communications pursuant to Rule 14d-2(b) under the Exchange Act (17 CFR 240.14d-2(b)) |
| | | | | |
| ☐ | Pre-commencement communications pursuant to Rule 13e-4(c) under the Exchange Act (17 CFR 240.13e-4(c)) |
Securities registered pursuant to Section 12(b) of the Act:
| | | | | | | | | | | | | | |
Title of Each Class | | Trading Symbol | | Name of Each Exchange on Which Registered |
Common Stock, par value $0.025 per share | | CALX | | New York Stock Exchange |
Indicate by check mark whether the registrant is an emerging growth company as defined in Rule 405 of the Securities Act of 1933 (§ 230.405 of this chapter) or Rule 12b-2 of the Securities Exchange Act of 1934 (§ 240.12b-2 of this chapter).
If an emerging growth company, indicate by check mark if the registrant has elected not to use the extended transition period for complying with any new or revised financial accounting standards provided pursuant to Section 13(a) of the Exchange Act). o
Item 2.02 Results of Operations and Financial Condition.
On January 29, 2024, Calix, Inc. (the “Company”) issued a press release announcing it has publicly disseminated a stockholder letter with its financial results for the fourth quarter ended December 31, 2023. The press release is attached hereto as Exhibit 99.1. The stockholder letter, a copy of which is attached hereto as Exhibit 99.2 and incorporated herein by reference, includes reference to the non-GAAP measures of non-GAAP gross margin, non-GAAP operating expenses, non-GAAP sales and marketing investments, non-GAAP research and development investments, non-GAAP general and administrative investments, non-GAAP effective income tax rate, non-GAAP net income, non-GAAP net income per diluted common share and non-GAAP free cash flow. These non-GAAP measures are provided to enhance the reader’s understanding of the Company’s operating performance as they primarily exclude non-cash stock-based compensation, inventory and component liability charges, intangible asset amortization, U.S. tariff refunds and impact from changes in income taxes, which the Company believes are not indicative of its core operating results. Management believes that the non-GAAP measures used in this stockholder letter provide investors with important perspectives into the Company’s ongoing business performance and management uses these non-GAAP measures to evaluate financial results and to establish operational goals. The presentation of these non-GAAP measures is not meant to be a substitute for results presented in accordance with U.S. GAAP, but rather should be evaluated in conjunction with those GAAP results. A reconciliation of the non-GAAP results to the most directly comparable U.S. GAAP results is contained in tabular form in Exhibit 99.2. The non-GAAP financial measures used by the Company may be calculated differently from, and therefore may not be comparable to, similarly titled measures used by other companies.
Such information shall not be deemed “filed” for purposes of Section 18 of the Securities Exchange Act of 1934, as amended (the “Exchange Act”), and is not incorporated by reference into any filing of the Company, whether made before or after the date hereof, regardless of any general incorporation language in such filing.
Item 9.01 Financial Statements and Exhibits.
(d) Exhibits
| | | | | | | | |
| Exhibit No. | | Description |
| 99.1 | | |
| 99.2 | | |
SIGNATURES
Pursuant to the requirements of the Securities Exchange Act of 1934, the Registrant has duly caused this report to be signed on its behalf by the undersigned hereunto duly authorized.
| | | | | | | | | | | | | | | | | | | | | | | | | | |
| Date: | January 29, 2024 | | | | | CALIX, INC. |
| | | | |
| | | | | | By: | | /s/ Cory Sindelar |
| | | | | | | | Cory Sindelar |
| | | | | | | | Chief Financial Officer |
EXHIBIT INDEX
| | | | | | | | |
| Exhibit No. | | Description |
| 99.1 | | |
| 99.2 | | |
Exhibit 99.1
Calix Releases Fourth Quarter 2023 Financial Results
SAN JOSE, CA – January 29, 2024 – Calix, Inc. (NYSE: CALX) today announced unaudited financial results for its fourth quarter 2023, which have been posted as a letter to stockholders to the investor relations section of its website. Please visit the Calix investor relations website at https://investor-relations.calix.com to view the letter to stockholders, along with accompanying supplemental financial information.
A conference call to discuss these results with President & CEO Michael Weening and CFO Cory Sindelar will be held tomorrow, January 30, 2024, at 5:30 a.m. Pacific Time / 8:30 a.m. Eastern Time.
Interested parties may listen to a live webcast of the conference call by visiting the Events section of the Calix Investor Relations website. The live conference call will be available by dialing (877) 407-4019, or international (201) 689-8337, with conference ID# 13743222. Participants may also click this link for instant telephone access to the event. The link will become active approximately 15 minutes prior to the start of the conference call. The conference call and webcast will include forward-looking information.
A webcast replay of the conference call will be available following its completion and will be archived on the Calix Investor Relations website.
About Calix
Calix, Inc. (NYSE: CALX) – Broadband service providers of all sizes leverage the Calix platform and teams to simplify their business and excite their subscribers to grow the value of their business and for their communities for generations. The democratizing power of the platform and portfolio of managed services enables them to operate efficiently, acquire subscribers, and deliver exceptional experiences. Calix is dedicated to driving continuous improvement in partnership with our growing ecosystem to support the transformation of our customers and their communities.
Category: Financial
Investor Inquiries:
Jim Fanucchi
VP, Investor Relations
InvestorRelations@calix.com
(408) 404-5400
Exhibit 99.2
January 29, 2024
Fellow Calix stockholders:
The Calix team closed out 2023 with continued deliberate and disciplined execution, delivering record revenue and record non-GAAP gross margin. Our success was once again led by the strength of our unique platform, cloud and managed services model that our Broadband Service Provider (BSP) customers leverage to simplify their business, excite their residential, business and government subscribers and grow their value for members, investors and the communities they serve.
We are confident about the future, as we see an enormous uplift to our business coming from the funds that will be allocated to build out the next generation of broadband infrastructure. Government programs such as BEAD are progressing, and we expect that they will begin to significantly impact our appliance revenue in early 2025, which creates even more opportunity for platform, cloud and managed services growth.
While our platform, cloud and manages services will continue to grow in 2024, we expect our customers will plan and replan their network builds based upon applying for and potentially receiving government funds. Therefore, during 2024, we expect our appliance shipments to slow until decisions are made and funds are awarded. At the same time, we have an opportunity to capitalize on the hastening disruption and increase our footprint before the arrival of substantial government stimulus.
In sum, we have achieved four years of record growth based on the strength of our unique platform, cloud and managed services model for BSPs. Beginning in 2025, we foresee the opportunity for years of robust growth. Meanwhile, we plan to take advantage of the unique opportunity we have in 2024 to grow our footprint.
2023 Performance
The most notable achievement of 2023 remained the growth of our platform, cloud and managed services business. It drives the value and competitive advantage for our BSP customers and in turn for Calix. This value creation is clearly reflected in our gross margin expansion. Since our pandemic induced low of 50.1% (GAAP gross margin of 49.6%), non-GAAP gross margin have expanded by 400 basis points. As we will discuss later in this letter, we expect that expansion to continue at a strong pace in 2024. Moreover, the visibility that we have into our customers’ plans from our direct relationships and cloud data has enabled us to manage through these last several years in a disciplined manner.
In the fourth quarter of 2023, the Calix team delivered record revenue of $264.7 million and non-GAAP gross margin of 54.1% (GAAP gross margin of 42.8%). We added 17 new BSPs, bringing our total to 56 for the year and increasing the total number of BSPs leveraging our platform for their success to 1,030.
At Calix, “better, better, never best” is ingrained in our company culture. In 2023, the industry acknowledged our purpose-driven culture and the strength of our innovative platform, cloud and managed services through a total of 46 different awards, spanning our culture, products, customers and partners. Recently, we announced Calix was ranked 25 out of 100 on Glassdoor’s Best Places to Work U.S. Large list with a 4.8 rating. Additional Calix specific awards we received since our last shareholder letter included:
•Added to Fortune’s 38th annual “100 Fastest-Growing Companies” list for 2023, joining a select group of companies delivering steady and continuous growth over multiple years
•Calix Named in Top Ranked Internships list in 2024 by Vault
•Calix sales organization named top rated in San Jose and for Mid-sized companies by Reppy
•Calix Named #17 for Best Company for Diversity, #16 for Best Company for Women, #12 for Best Company Culture and #12 for Best CEO by Comparably
In addition, the team’s disciplined execution delivered our third consecutive quarter of double-digit operating and free cash flow and strengthened our already strong balance sheet. We repurchased $44.0 million of our common stock during the fourth quarter of 2023, bringing our utilization of the original $100 million authorized share repurchase plan to $86.4 million. With our expectation of continued strong free cash flow generation, the Board authorized an additional $100 million to maintain the existing stock repurchase program.
In conclusion, the team delivered an impressive fourth quarter and 2023. We grew our platform, cloud and managed service base and kept improving our team and culture, while achieving record revenue, record gross margin, solid cash flow and improving an already strong balance sheet. With this solid foundation, we enter 2024 with the disruption in the broadband market hastening and accelerating the opportunity for Calix.
2025 and the Opportunity Ahead
Given the investments coming in broadband infrastructure, we expect strong growth in appliance revenue from 2025 onwards. This expansion of our appliance footprint increases the monetizable installed base upon which our platform, cloud and managed services business will grow. To understand the magnitude of this opportunity, what follows is a discussion of the largest North American funding programs.
Broadband Equity, Access and Deployment Program (BEAD)
This bi-partisan $42 billion fund will be a tsunami of money allocated at the state level. The approval process is ongoing, and the Department of Commerce’s National Telecommunications and Information Administration (NTIA) has made no commitments to the states as to how long their approval process will take. In addition, the complexity of the program, which has 19 separate requirements in the initial proposal, including items around the sourcing and manufacturing of products through the Build America, Buy America (BABA) rules and fair labor practices, matching funds and letters of credit, represents a challenge for broadband service providers, particularly small firms that have limited resources to navigate through the application process.
The timeline for awards also points to an early 2025 starting point. For example, there will be a challenge process where service providers can challenge the initial maps produced by NTIA. That process will likely run into the summer before a final, state-by-state map is produced. From there, depending on the state, the application approval process could take several months to complete as states work to include as many “orphaned” locations in the back-and-forth bidding process. This will culminate in each state making all their respective awards at one time. A dashboard of state-by-state BEAD proposal progress can be found on the NTIA’s Internet-for-All website.
These are the reasons why we believe the initial awards are most likely to arrive very early in 2025.
Enhanced Alternative Connect America Cost Model (E-ACAM)
E-ACAM, announced in August 2023, is a $20 billion program and offers telecom service providers up to $350 per subscriber per year through 2038. E-ACAM is an alternative to BEAD, not supplemental to BEAD. As we discussed in our prior earnings call, E-ACAM was not expected, and a large portion of our telecom service provider customers paused their funding plan, and subsequently their 2024 build planning, to evaluate this program. While many of our telecom service providers have selected E-ACAM,
they continue to work through how to fund and proceed with their 2024 capital builds as they have traded away upfront capital via BEAD for the annuity of E-ACAM.
American Rescue Plan Act - Capital Projects Fund (ARPA-CPF)
The ARPA-CPF was established in 2022 to provide $10 billion to states, territories, freely associated states and Tribal governments to fund a variety of broadband infrastructure projects that increase access to high-speed internet for millions of Americans. Through March 2023, approximately $4.8 billion had been awarded for a variety of projects. The majority of these funds, which are distributed at the state level, are expected to be disbursed throughout all of 2024. One of the requirements is that providers will need to complete their projects before commencing their BEAD projects, and providers will only have until 2026 to complete their buildouts.
ReConnect Loan and Grant Program (ReConnect)
Established in 2018, the U.S. Department of Agriculture’s ReConnect program provides a combination of loans, grants and loan-grant packages with the aim of promoting broadband deployment in rural areas of America that currently lack adequate access. This program has already seen four successful funding rounds since its inception. A total of $4.8 billion dollars has been invested through this program. Round 4 of $1.7 billion was awarded throughout 2023, which is expected to be invested starting this year. Round 5 awards are expected to be announced in early 2024.
Tribal Broadband Connectivity Program
The Tribal Broadband Connectivity Program is a $3 billion program directed to Native American communities to be used for broadband deployment on tribal lands. Close to 230 tribal nations across the United States have been awarded nearly $1.9 billion dollars to date with the majority allocated to infrastructure spending. Calix has partnered with tribal communities for nearly two decades, and we remain actively engaged with these organizations through the National Tribal Telecommunications Association by leveraging our “Broadband Services for Tribal Communities” program to add more service providers who are dedicated to transforming their communities in a sustainable model for generations.
It is also important to note that beyond the programs mentioned above, there are many smaller federal and state programs with billions of dollars available to increase connectivity to underserved markets.
This illustrates that while government support for broadband is ongoing, these programs are expected to result in a major increase in broadband investments in 2025 and beyond. Our unique platform, cloud and managed services model, combined with our direct sales, consulting and customer success teams, give us unmatched insight into the timing and size of these awards.
2024 – A Unique Opportunity
Our visibility with BSP customers enables us to see demand trends, both positive and negative.
As we highlighted in our third quarter of 2023 earnings call, a significant number of our customers slowed their decision making as they grappled with the E-ACAM offering. We saw an expansion of slowed and delayed decision making in the fourth quarter as almost all BSP customers are contemplating or actively pursuing BEAD as the funding is near and too large to ignore. This will affect our appliance shipments until the awards are made. We expect this to continue through 2024.
That same visibility tells us that our platform, cloud and managed services offerings will continue to grow throughout as our customers expand their offerings on the existing appliance. As the BSPs beat legacy providers and win new subscribers, our platform, cloud and managed services growth is unlikely to be affected by the network build decisions.
Therefore, we expect that our platform, cloud and managed services revenue will continue to grow while our appliances revenue will be depressed during this period of indecision. As a result, we expect our non-
GAAP gross margin will continue to expand at the high end of our Target Financial Model of 100 to 200 basis point range.
We intend to be very disciplined with our operating expenses through the next four quarters to align them with our Target Financial Model, however we do not plan to significantly reduce our investments as we believe the next four quarters represent the greatest opportunity to grow our footprint ahead of the sustained period of massive U.S. broadband investment.
Our leadership team is confident that our financial performance over the long-term will continue to improve across four measurable objectives:
•Deliberate revenue growth
•Gross margin expansion
•Disciplined operating expense investment
•Ongoing predictability
To conclude, Calix is the only end-to-end platform company enabling BSPs to maximize the once in a generation opportunity presented by the disruption of the legacy broadband industry and the significant growth in funding. Combined with a strong balance sheet and experienced team that has delivered four years of predictable results, we are confident in our ability to enable the success of our BSP customers, thereby ensuring our long-term success.
Fourth Quarter 2023 Financial Results
| | | | | | | | | | | |
| Actual GAAP | Actual Non-GAAP | Guidance Non-GAAP 1 |
| Revenue | $264.7m | $264.7m | $261.0m – $267.0m |
| Gross margin | 42.8% | 54.1% 2 | 53.0% – 55.0% 1 |
| Operating expenses | $122.1m | $110.0m 2 | $111.0m – $114.0m 1 |
| Net income (loss) per diluted common share | $(0.06) | $0.43 2 | $0.33 – $0.39 1 |
| | | | | | | |
1 | Non-GAAP guidance provided on October 23, 2023. | | |
2 | Non-GAAP excludes inventory and component liability charges, stock-based compensation and intangible asset amortization as well as the income tax impact of these items. See GAAP to non-GAAP reconciliations beginning on page 17. | | |
| | | |
| | | |
| | | |
| | | |
| | | |
| | | |
| | | |
| | | |
Continued demand for our platform, cloud and managed service offerings led to our eleventh quarter of sequential revenue growth. For the fourth quarter of 2023, revenue was a record $264.7 million,
representing an increase of 0.3% from the prior quarter and 8% compared with the same quarter a year ago.
Revenue EDGE revenue increased by 26% from the prior quarter due to higher appliance shipments and was up 23% compared with the year ago quarter as both new and existing customers continued to add subscribers.
Intelligent Access EDGE revenue was down 16% from the prior quarter due to seasonality as shipments in the third quarter are tied to completion of network builds before the ground freezes in parts of North America and increased 20% compared with the year ago quarter, driven by the technology upgrade cycle to consolidated networks and 10 Gigabit PON.
U.S. revenue was 94% of total revenue for the fourth quarter of 2023, up from 89% in the third quarter of 2023, and up from 91% of revenue for the year ago quarter. U.S. revenue increased 6% in absolute dollars sequentially, and 12% compared with the year ago quarter. International revenue was 6% of revenue in the fourth quarter of 2023, down by 44% in absolute dollars from the prior quarter. Lower shipments to Europe were the primary reason for the decline. International revenue was down 31% compared with the year ago period, primarily due to lower shipments across all geographies as the sales of our legacy systems trended down and the sale of our platform, cloud and managed services has been limited to a small number of countries outside of the United States, including Canada and the United Kingdom.
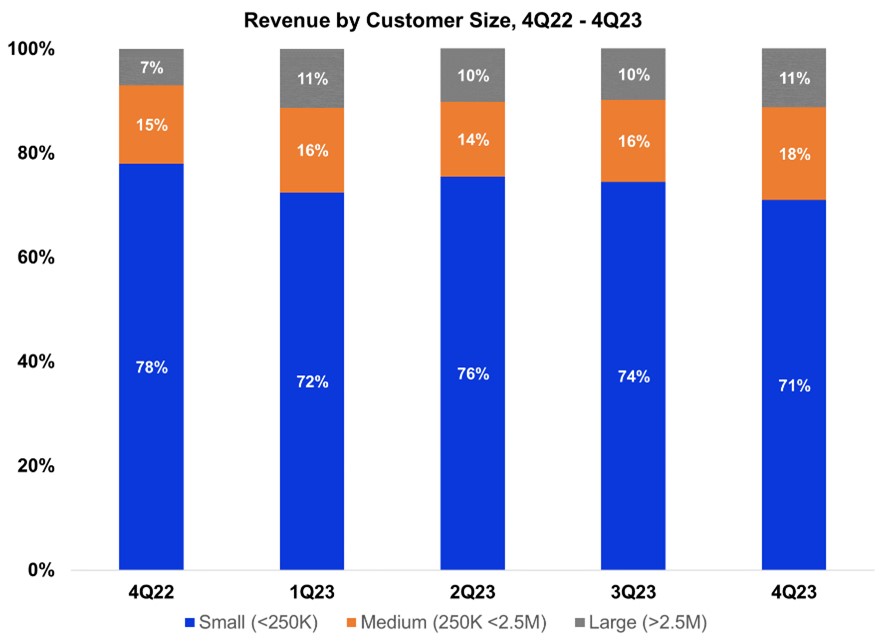
As we have discussed previously, technology disruptions start with small customers and eventually work their way up to large customers. Revenue from small customers was 71% of revenue for the fourth quarter of 2023, down from 74% for the prior quarter, and decreased 5% in absolute dollars due to the lower Intelligent Access Edge shipments within this customer group and lower European shipments. Revenue from medium-sized customers was 18% of revenue in the fourth quarter of 2023, up from 16% in the prior quarter, and increased 14% in absolute dollars due primarily to increased sales to a medium-sized customer we added in 2022. Revenue from large customers was 11% of revenue for the fourth quarter of 2023, up from 10% in the prior quarter and up 15% in absolute dollars from the third quarter of 2023. The increase from the prior quarter was primarily due to a higher level of shipments to the same large customer we noted in the last three quarterly stockholder letters.
Greater customer adoption of our platform, cloud and managed services was again evidenced by the
continued increase in all three metrics compared with the prior quarter. As we have noted previously, our platform, cloud and managed services monetize based on subscriber count, and the growth in subscribers and on-going adoption of our platform, cloud and managed services form the “expand” in our “land and expand” strategy. Over time, we expect the recurring revenue from continued platform, cloud and managed services adoption will drive higher gross margin.
Our platform consists of Revenue EDGE, Intelligent Access EDGE and Calix Cloud. We added 9 new Revenue EDGE and/or Intelligent Access EDGE customer deployments in the fourth quarter of 2023. By deploying the Revenue EDGE, BSPs can quickly implement and sell managed services, thereby increasing their average revenue per user at high margins with the greatest levels of subscriber satisfaction.
We added 7 new Calix Cloud deployments, which include Engagement Cloud (formerly Marketing Cloud), Service Cloud (formerly Support Cloud) and/or Operations Cloud in the fourth quarter of 2023. Calix Cloud allows our BSPs to benefit from the power of data-driven insights to drive best-in-class net promoter scores.
Our managed services showed continued growth as 20 additional customers began deploying a managed service. We currently offer 9 managed services consisting of Wi-FiIQ, CommandIQ, ProtectIQ, ExperienceIQ, Arlo Secure, Bark, Servify, SmartBiz and SmartTown.
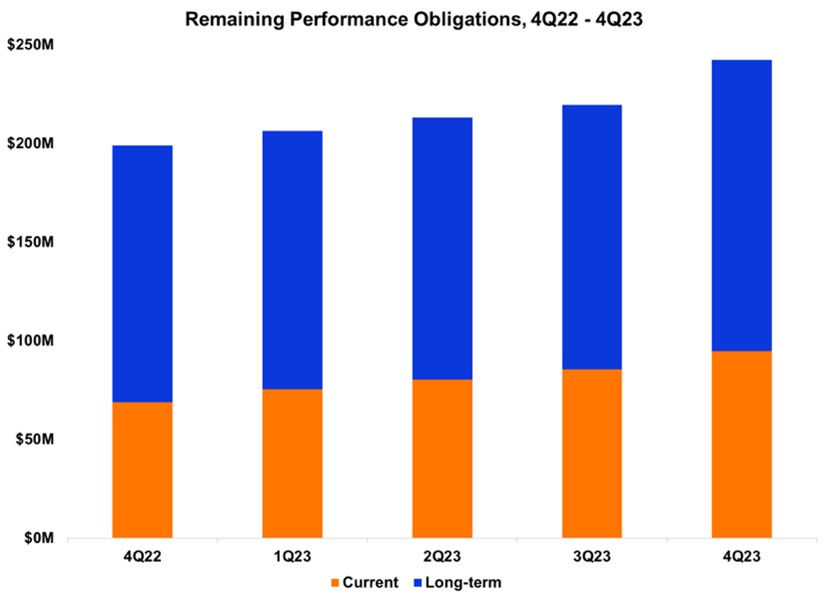
Remaining performance obligations, or RPOs, result from long-term commitments made by our customers and consist mainly of Calix Cloud, managed services, extended warranties and support/ maintenance agreements, while excluding platform licenses, month-to-month usage-based models and true-ups. These commitments generally have an initial term of three years. As of the end of the fourth quarter of 2023, our RPOs were $242.5 million, which is an increase of $22.9 million, or 10%, from the prior quarter and an increase of $43.5 million, or 22%, from the same quarter a year ago. Meanwhile, current RPO was $94.7 million, up 11% from $85.4 million at the end of the prior quarter end and up 38% from $68.8 million at the quarter end a year ago. The increases reflect the continued adoption of our platform offerings by our BSP customers. We expect to see RPO growth every quarter for the foreseeable future, albeit these quarterly increases will vary with the fourth quarter likely being the largest sequential increase due to our annual ConneXions Innovation and Customer Success conference (“ConneXions”) occurring early in the fourth quarter and the budgetary cycle that begins with the new year.
A year ago, we communicated that our legacy business continued to decline and represented less than 10% of our fourth quarter of 2022 bookings. Over the past year, we benefited from our legacy customers moving to our platforms at a faster rate than we initially anticipated. During the fourth quarter of 2023, we reached a point where we could see the end of shipments for this legacy product set, which would leave us with excess legacy finished good inventory and components at suppliers. In the fourth quarter of 2023, we took one-time charges of $28.7 million to write down inventory and accrued liabilities related to excess components at suppliers, primarily related to the wind down of our legacy product set. Our GAAP gross
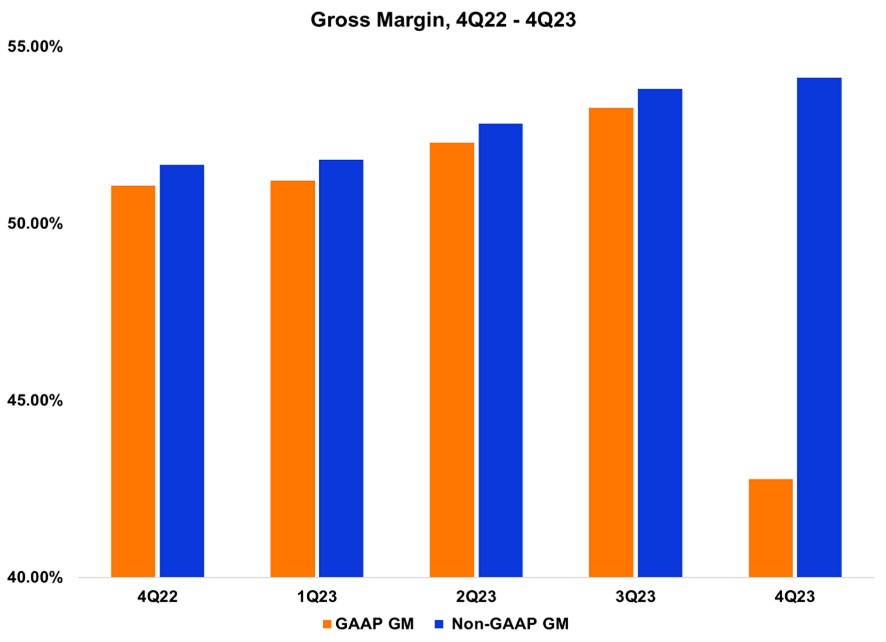
margin for the fourth quarter of 2023 was 42.8%, a decrease of 1,050 basis points sequentially and 830 basis points year-over-year due primarily due to the aforementioned charges. Also included in GAAP gross margin is stock-based compensation and intangible asset amortization. Excluding these items, our non-GAAP gross margin for the fourth quarter of 2023 was a record 54.1%, representing an increase of 30 basis points sequentially and 250 basis points from the year ago period. The continued improvement is primarily due to higher platform, cloud and managed services revenue as we continue to grow. Also, during the fourth quarter of 2023, we benefited from the final sell through of excessively priced components acquired in the secondary market in prior periods. Our expectation is the long-term trend for gross margin on an annual basis will continue to increase with varied rates on a quarterly basis.
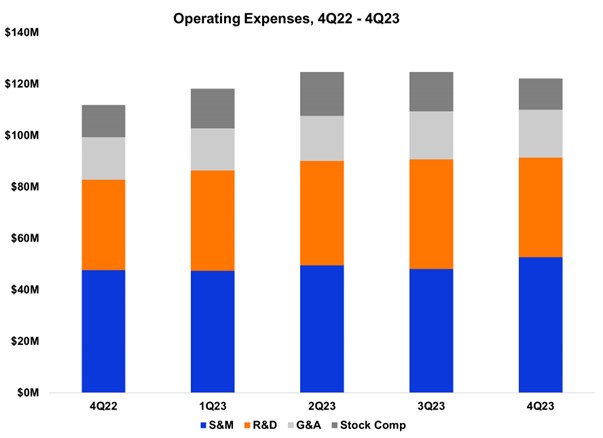
We continue to invest within our Target Financial Model to capitalize on the once-in-a-generation opportunity ahead. Our GAAP and non-GAAP operating expenses for the fourth quarter of 2023 were $122.1 million and $110.0 million, representing 46.1% and 41.6% of revenue, respectively. Sequentially, GAAP operating expenses decreased by $2.5 million and non-GAAP operating expenses increased by $0.7 million. The GAAP decrease was due to lower stock-based compensation while the non-GAAP increase resulted primarily from the ConneXions event and personnel costs. Compared with the year ago quarter, GAAP and non-GAAP operating expenses increased by 9% and 11%, respectively, primarily due to ongoing investments in headcount across our organization. We believe these investments are necessary to support the current and future demand for our platform offerings as we focus on our BSP customers’ success. Non-GAAP sales and marketing investments were 19.9% of revenue, which was at the high end of our Target Financial Model range of 18% to 20%, and includes the investments associated with the ConneXions conference that occurred in the fourth quarter of 2023. Non-GAAP research and development investments were 27.0% of gross profit, which is below our Target Financial Model of 29%. Non-GAAP general and administrative investments were 7.0% of revenue and in line with our Target Financial Model of 7%.
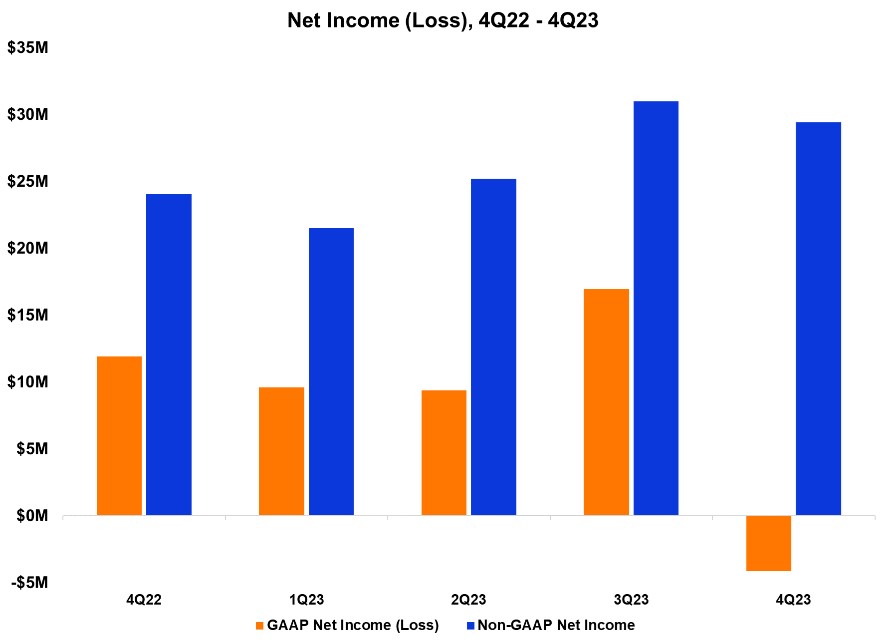
GAAP net loss of $4.1 million for the fourth quarter of 2023 decreased from GAAP net income by approximately $21.1million sequentially and $16.1 million compared with the same quarter a year ago primarily due to the inventory and component liability charges we took in the fourth quarter of 2023 as we work to wind down our legacy product set. GAAP net loss for the fourth quarter of 2023 also included stock-based compensation of $12.7 million and intangible asset amortization of $0.8 million, partially offset by the income tax effect for these items of $8.5 million. Our non-GAAP net income for the fourth quarter of 2023 was $29.4 million, a decrease of $1.6 million when compared with $31.0 million in the prior quarter. The change was mainly due to a more normalized income tax rate in the fourth quarter compared with the prior quarter where there were favorable adjustments as a result of finalizing our 2022 income tax returns. Non-GAAP net income increased approximately $5.4 million when compared with $24.1 million last year mainly due to the higher revenue and gross margin.
Balance Sheet and Cash Flow
Our balance sheet remains strong. Our Days Sales Outstanding (DSO) at the end of the fourth quarter 2023 was 44 days, up 16 days from the prior quarter and up 9 days from the same quarter a year ago, due primarily to the timing of customer payments at year end. It should be noted that we collected $32.6 million in the first week of January, which represents a DSO of 11 days. Our Target Financial Model for DSO remains between 35 and 45 days. Inventory turns were 3.3, up from 3.0 in both the prior quarter and the same quarter a year ago. Inventory turns for the fourth quarter of 2023 were within our Target
Financial Model of 3 to 4 turns. In the fourth quarter of 2023, we also increased our support to our contract manufacturers with additional inventory deposits of $12.2 million related to component materials, bringing our total inventory deposits to $78.1 million. With supplier lead times normalizing, we expect over the next year that our inventory turns will adjust toward the higher end of the Target Financial Model range and the suppliers’ inventory deposits will diminish. Days payable outstanding (DPO) at the end of the fourth quarter was 31 days, up 15 days from the prior quarter and down 1 day from the year ago quarter, due to timing of inventory purchases. Our Target Financial Model for DPO is to be between 25 and 35 days. Our cash conversion cycle was 122 days compared with 133 days in the prior quarter and 125 days in the same quarter last year. Our Target Financial Model remains for our cash conversion cycle to be between 100 and 130 days.
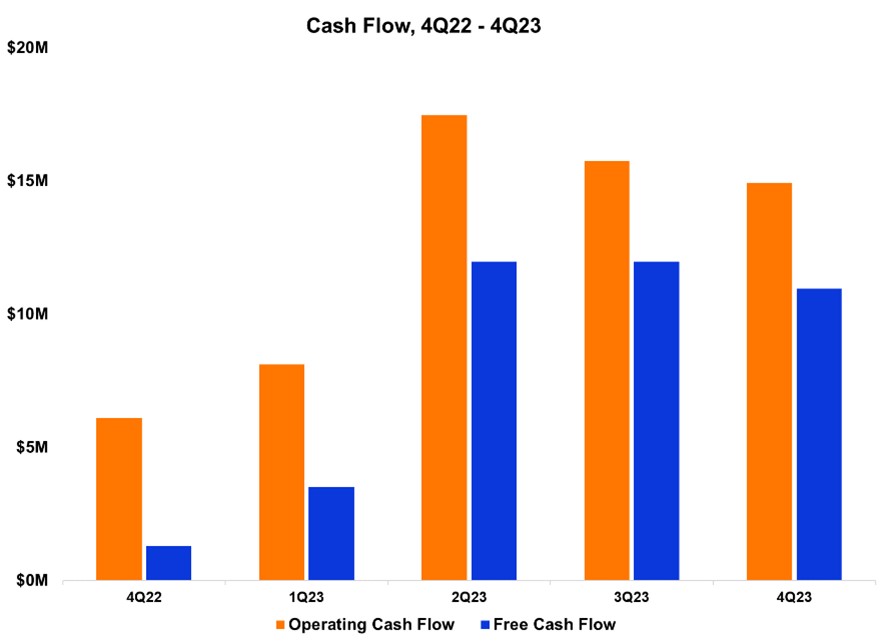
We ended the year with cash and investments of $220.3 million, which was a sequential decrease of $29.7 million as a result of purchasing $44.0 million of our common stock at an average price of $35.00 during the fourth quarter. This investment was partially offset by positive non-GAAP free cash flow of $11.0 million and proceeds from equity-based employee benefit plans of $5.5 million. Over the past year, our cash and investments decreased by $21.4 million primarily due to investments in our common stock of $86.4 million at an average price of $39.09 and partially offset by positive non-GAAP free cash flow of $38.4 million and proceeds from equity-based employee benefit plans of $32.1 million. Over the next year, we expect both GAAP operating and non-GAAP free cash flow to remain strong due to continued gross margin expansion, improved inventory turns and a reduction of supplier inventory deposits as our supply chain lead times continue to normalize.
First Quarter 2024 Guidance
| | | | | | | | |
| Guidance Non-GAAP | Guidance Reconciled to GAAP |
| Revenue | $225.0m – $231.0m | $225.0m – $231.0m |
| Gross margin | 53.5% – 55.5% 1 | 53.0% – 55.0% |
| Operating expenses | $107.0m – $110.0m 1 | $122.0m – $125.0m |
Net income (loss) per diluted common share 2 | $0.17 – $0.23 1 | $(0.04) – $0.02 |
| | | | | | | |
1 | Non-GAAP excludes stock-based compensation and intangible asset amortization as well as the income tax impact of these items. See GAAP to non-GAAP reconciliation on page 19. | | |
2 | Based on 68.3 million weighted-average diluted common shares outstanding. | | |
| | | |
| | | |
| | | |
| | | |
| | | |
| | | |
| | | |
| | | |
Our guidance for the first quarter of 2024, ending March 30, 2024, reflects our expectations as of the date of this letter. As we discussed above, 2024 will be a year of decision making for our customers as they
are in the process of evaluating and finalizing their plans to apply for the tens of billions of government stimulus dollars. While this will affect our appliance shipments, our platform, cloud and managed services will continue with their robust growth.
With this background and considering a few significant customers in 2023 are pausing their purchases in early 2024 as they re-evaluate their capital expenditures, our revenue guidance for the first quarter of 2024 is for revenue to be between $225 million and $231 million. We currently expect this will mark the low point for the year and believe we will grow sequentially thereafter.
Due to the continued growth in our platform, cloud and managed services and the lower appliance revenue outlook, our non-GAAP gross margin guidance for the first quarter of 2024 of 54.5% (at the midpoint) represents an increase of 40 basis points compared with the prior quarter. For 2024, we expect our annual gross margin improvement will be at the higher end of our Target Financial Model range of 100 to 200 basis points.
Our non-GAAP operating expense guidance for the first quarter of 2024 is higher than our Target Financial Model as a percentage of revenue due to the current revenue outlook. We plan to hold our operating expenses relatively constant throughout 2024 as we execute on the opportunity to grow our footprint prior to the arrival of the expected significant amount of government stimulus in 2025.
We expect our effective tax rate for 2024 will be within a range of 29% to 31% for GAAP and 22% to 24% for non-GAAP.
Summary
We remain in the initial phase of an enormous disruption in the broadband industry and are enthusiastic about the long-term growth potential for Calix, and our strategically aligned BSP customers. Our unique end-to-end platform, cloud and managed services model is transforming our BSP customers’ ability to take market share from legacy network operators who are struggling as they lose subscribers and fail to attract new subscribers in a profitable way.
The foundation for our long-term growth continues to be based on three vectors:
•New subscribers: BSP customers leverage our platform, cloud and managed services to differentiate themselves in their markets thereby adding subscribers.
•Existing subscribers: BSP customers adopt additional platform extensions, clouds and managed services to reduce their operational costs and grow revenue per subscriber.
•New BSPs: We continue to sign new strategically aligned service providers who recognize that our unique platform, cloud and managed services model enables their team to transform their business as they simplify their operations thereby reducing operating costs and time to market and excite their subscribers with market differentiating managed services to grow for their members/investors and the communities they serve.
The confidence in our long-term outlook is backed by our proven success model, a strong balance sheet to support 2024 growth, an award-winning team that is focused on our BSP customer’s success and the unprecedent amount of government funding that is poised to accelerate this disruption being led by our BSP customers.
We remain steadfast as 2024 represents a unique opportunity for Calix to grow our BSP customer base and expand our platform, cloud and managed services across our footprint. This will strengthen our position for 2025 and beyond as the broadband stimulus funds make their way to our BSP customers.
We sincerely thank our employees, customers, partners, vendors and stockholders for their continued support.
Sincerely,
| | | | | | | | |
Michael Weening President and CEO | | Cory Sindelar CFO |
Conference Call
In conjunction with this announcement, Calix will host a conference call tomorrow, January 30, 2024, at 5:30 a.m. Pacific Time / 8:30 a.m. Eastern Time to answer questions regarding our fourth quarter 2023 financial results. A live audio webcast and replay of the call will be available in the Investor Relations section of the Calix website at http://investor-relations.calix.com.
Live call access information: Dial-in number: (877) 407-4019 (U.S.) or (201) 689-8337 (outside the U.S.) ID# 13743222.
The conference call and webcast will include forward-looking information.
Investor Inquiries
Jim Fanucchi
VP, Investor Relations
InvestorRelations@calix.com
(408) 404-5400
About Calix
Calix, Inc. (NYSE: CALX) — Broadband service providers of all sizes leverage the Calix platform and teams to simplify their business and excite their subscribers to grow the value of their business and for their communities for generations. The democratizing power of the platform and portfolio of managed services enables them to operate efficiently, acquire subscribers, and deliver exceptional experiences. Calix is dedicated to driving continuous improvement in partnership with our growing ecosystem to support the transformation of our customers and their communities.
Forward-Looking Statements
Statements made in this stockholder letter and the earnings call referencing the stockholder letter that are not statements of historical fact are forward-looking statements. Forward-looking statements are subject to the “safe harbor” provisions of the Private Securities Litigation Reform Act of 1995. Forward-looking statements relate to, but are not limited to, component and logistics costs, potential customer or market opportunities, growth and future opportunities, customer demand or the sustainability of continued demand, anticipated customer purchase trends, anticipated government funding, expected customer and product mix or anticipated adoption or deployment of our appliances, platform, cloud or managed services, industry, market and customer trends, opportunities with existing and prospective customers, the timing of BEAD/BABA shipments, free cash flow and liquidity, continuation of our stock repurchase program and future financial performance (including the outlook for the first quarter of 2024 and future periods and performance against our Target Financial Model). Forward-looking statements are subject to risks and uncertainties that could cause actual results to differ materially from expectations, including but not limited to fluctuations in our financial and operating results, the capital spending decisions of our customers, changes and disruptions in the market and industry, availability of capital in the market, potential for growth in our business driven by government funds, changes in and impacts of regulations
and/or government sponsored programs, competition, our ability to achieve market acceptance of our appliances, platform, cloud or managed services, our ability to grow our customer base, fluctuations in costs associated with our appliances and services including higher costs, dependence on third-parties for production and resource management associated with our global supply chain that may cause delays in production, inventory write-offs or component liabilities, cost overruns, disruptions in global trade and relations, social unrest and political uncertainties and other unanticipated factors, as well as the risks and uncertainties described in our annual reports on Form 10-K and our quarterly reports on Form 10-Q, each as filed with the SEC and available at www.sec.gov, particularly in the sections titled “Risk Factors.” Forward-looking statements speak only as of the date the statements are made and are based on information available to us at the time those statements are made and/or management’s good faith belief as of that time with respect to future events. Calix assumes no obligation to update forward-looking statements to reflect actual performance or results, changes in assumptions or changes in other factors affecting forward-looking information, except to the extent required by applicable securities laws. Accordingly, investors should not place undue reliance on any forward-looking statements.
Use of Non-GAAP Financial Information
The Company uses certain non-GAAP financial measures in this stockholder letter to supplement its consolidated financial statements, which are presented in accordance with U.S. GAAP. These non-GAAP measures include non-GAAP gross margin, non-GAAP operating expenses, non-GAAP sales and marketing investments, non-GAAP research and development investments, non-GAAP general and administrative investments, non-GAAP effective income tax rate, non-GAAP net income, non-GAAP net income per diluted common share and non-GAAP free cash flow. These non-GAAP measures are provided to enhance the reader’s understanding of the Company’s operating performance as they primarily exclude non-cash stock-based compensation, inventory and component liability charges, intangible asset amortization, U.S. tariff refunds and impact from changes in income taxes, which the Company believes are not indicative of its core operating results. Management believes that the non-GAAP measures used in this stockholder letter provide investors with important perspectives into the Company’s ongoing business performance and management uses these non-GAAP measures to evaluate financial results and to establish operational goals. The presentation of these non-GAAP measures is not meant to be a substitute for results presented in accordance with GAAP, but rather should be evaluated in conjunction with those GAAP results. A reconciliation of the non-GAAP results to the most directly comparable GAAP results is provided in this stockholder letter. The non-GAAP financial measures used by the Company may be calculated differently from, and therefore may not be comparable to, similarly titled measures used by other companies.
Net Promoter®, NPS®, NPS Prism® and the NPS-related emoticons are registered trademarks of Bain & Company, Inc., Satmetrix Systems, Inc. and Fred Reichheld. Net Promoter Score℠ and Net Promoter System℠ are service marks of Bain & Company, Inc., Satmetrix Systems, Inc. and Fred Reichheld.
| | | | | | | | | | | | | | | | | | | | | | | | | | | | | | | | |
| Calix, Inc. |
| Condensed Consolidated Statements of Income |
| (Unaudited, in thousands, except per share data) |
| | | | | | | | | | |
| | | | Three Months Ended December 31, | | Year Ended December 31, |
| | | | | | | | | | |
| | | | 2023 | | 2022 | | 2023 | | 2022 |
| | | | | | |
| Revenue | | $ | 264,734 | | | $ | 244,503 | | | $ | 1,039,593 | | | $ | 867,827 | |
| Cost of revenue | | 151,488 | | | 119,619 | | | 521,277 | | | 432,399 | |
| Gross profit | | 113,246 | | | 124,884 | | | 518,316 | | | 435,428 | |
| Operating expenses: | | | | | | | | |
| Sales and marketing | | 55,747 | | | 51,186 | | | 214,564 | | | 174,549 | |
| Research and development | | 42,295 | | | 38,551 | | | 177,772 | | | 131,994 | |
| General and administrative | | 24,045 | | | 22,096 | | | 97,145 | | | 76,275 | |
| | Total operating expenses | | 122,087 | | | 111,833 | | | 489,481 | | | 382,818 | |
| Operating income (loss) | | (8,841) | | | 13,051 | | | 28,835 | | | 52,610 | |
| Interest income and other expense, net: | | | | | | | | |
| Interest income, net | | 3,151 | | | 1,139 | | | 9,704 | | | 2,009 | |
| Other expense, net | | (84) | | | (103) | | | (532) | | | (577) | |
| | Total interest income and other expense, net | | 3,067 | | | 1,036 | | | 9,172 | | | 1,432 | |
| Income (loss) before income taxes | | (5,774) | | | 14,087 | | | 38,007 | | | 54,042 | |
| Income taxes | | (1,632) | | | 2,160 | | | 6,225 | | | 13,032 | |
| Net income (loss) | | $ | (4,142) | | | $ | 11,927 | | | $ | 31,782 | | | $ | 41,010 | |
| Net income (loss) per common share: | | | | | | | | |
| | Basic | | $ | (0.06) | | | $ | 0.18 | | | $ | 0.48 | | | $ | 0.63 | |
| | Diluted | | $ | (0.06) | | | $ | 0.17 | | | $ | 0.46 | | | $ | 0.60 | |
| Weighted average number of shares used to compute net income (loss) per common share: | | | | | | | |
| | Basic | | 65,323 | | | 65,558 | | | 65,980 | | | 65,058 | |
| | Diluted | | 65,323 | | | 69,857 | | | 69,320 | | | 68,911 | |
| | | | | | | | | | |
| | | | | | | | | | | | | | |
| Calix, Inc. |
| Condensed Consolidated Balance Sheets |
| (Unaudited, in thousands) |
| | | | |
| | December 31, |
| | 2023 | | 2022 |
| ASSETS |
| Current assets: | | | | |
| Cash and cash equivalents | | $ | 63,409 | | | $ | 79,073 | |
| Marketable securities | | 156,937 | | | 162,642 | |
| Accounts receivable, net | | 126,027 | | | 93,804 | |
| Inventory | | 132,985 | | | 149,160 | |
| Prepaid expenses and other current assets | | 118,598 | | | 62,691 | |
| Total current assets | | 597,956 | | | 547,370 | |
| Property and equipment, net | | 29,461 | | | 25,834 | |
| Right-of-use operating leases | | 9,262 | | | 9,283 | |
| Deferred tax assets | | 166,898 | | | 167,031 | |
| Goodwill | | 116,175 | | | 116,175 | |
| Other assets | | 21,320 | | | 19,142 | |
| | $ | 941,072 | | | $ | 884,835 | |
LIABILITIES AND STOCKHOLDERS’ EQUITY |
| Current liabilities: | | | | |
| Accounts payable | | $ | 34,746 | | | $ | 41,407 | |
| Accrued liabilities | | 112,977 | | | 90,474 | |
| Deferred revenue | | 36,669 | | | 33,541 | |
| Total current liabilities | | 184,392 | | | 165,422 | |
| Long-term portion of deferred revenue | | 24,864 | | | 25,072 | |
| Operating leases | | 7,421 | | | 8,442 | |
| Other long-term liabilities | | 2,956 | | | 6,332 | |
| Total liabilities | | 219,633 | | | 205,268 | |
| Stockholders’ equity: | | | | |
| Common stock | | 1,627 | | | 1,644 | |
| Additional paid-in capital | | 1,078,393 | | | 1,070,100 | |
| Accumulated other comprehensive loss | | (659) | | | (2,473) | |
| Accumulated deficit | | (357,922) | | | (389,704) | |
| Total stockholders’ equity | | 721,439 | | | 679,567 | |
| | $ | 941,072 | | | $ | 884,835 | |
| | | | | | | | | | | | | | |
| Calix, Inc. |
| Condensed Consolidated Statements of Cash Flows |
| (Unaudited, in thousands) |
| | | | |
| | Year Ended December 31, |
| | | | |
| | 2023 | | 2022 |
| Operating activities: | | | | |
| Net income | | $ | 31,782 | | | $ | 41,010 | |
| Adjustments to reconcile net income to net cash provided by operating activities: | | | | |
| Stock-based compensation | | 62,771 | | | 44,826 | |
| Depreciation and amortization | | 16,631 | | | 14,315 | |
| Deferred income taxes | | 132 | | | 1,932 | |
| Net accretion of available-for-sale securities | | (4,199) | | | (1,146) | |
| Changes in operating assets and liabilities: | | | | |
| Accounts receivable, net | | (32,222) | | | (8,585) | |
| Inventory | | 16,175 | | | (60,280) | |
| Prepaid expenses and other assets | | (60,795) | | | (38,359) | |
| Accounts payable | | (6,369) | | | 12,111 | |
| Accrued liabilities | | 33,821 | | | 20,919 | |
| Deferred revenue | | 2,921 | | | 9,118 | |
| Other long-term liabilities | | (4,397) | | | (8,678) | |
| Net cash provided by operating activities | | 56,251 | | | 27,183 | |
Investing activities: | | | | |
| Purchases of property and equipment | | (17,855) | | | (14,067) | |
| Purchases of marketable securities | | (216,193) | | | (191,403) | |
| Maturities of marketable securities | | 227,803 | | | 181,388 | |
| Net cash used in investing activities | | (6,245) | | | (24,082) | |
| Financing activities: | | | | |
| Proceeds from common stock issuances related to employee benefit plans | | 32,149 | | | 27,456 | |
| Repurchases of common stock | | (86,397) | | | — | |
| Payments related to financing arrangements | | (11,678) | | | (2,393) | |
| Net cash provided by (used in) financing activities | | (65,926) | | | 25,063 | |
| Effect of exchange rate changes on cash and cash equivalents | | 256 | | | (424) | |
| Net increase (decrease) in cash and cash equivalents | | (15,664) | | | 27,740 | |
| Cash and cash equivalents at beginning of year | | 79,073 | | | 51,333 | |
| Cash and cash equivalents at end of year | | $ | 63,409 | | | $ | 79,073 | |
| | | | | | | | | | | | | | | | | | | | | | | | | | | | | | | | | | | | | | |
| Calix, Inc. |
| Reconciliation of GAAP to Non-GAAP Gross Margin |
| (Unaudited) |
| | Three Months Ended |
| | December 31,
2023 | | September 30,
2023 | | July 1,
2023 | | April 1,
2023 | | December 31,
2022 | | July 2,
2022 |
| GAAP gross margin | | 42.8 | % | | 53.3 | % | | 52.3 | % | | 51.2 | % | | 51.1 | % | | 49.6 | % |
| Adjustments to GAAP amount: | | | | | | | | | | | | |
| Stock-based compensation | | 0.2 | | | 0.3 | | | 0.3 | | | 0.3 | | | 0.3 | | | 0.3 | |
| Intangible asset amortization | | 0.3 | | | 0.2 | | | 0.2 | | | 0.3 | | | 0.2 | | | 0.3 | |
| Inventory and component liability charges | | 10.8 | | | — | | | — | | | — | | | — | | | — | |
| U.S. tariff refunds | | — | | | — | | | — | | | — | | | — | | | (0.1) | |
| Non-GAAP gross margin | | 54.1 | % | | 53.8 | % | | 52.8 | % | | 51.8 | % | | 51.6 | % | | 50.1 | % |
| | | | | | | | | | | | | | | | | | | | | | | | | | | | | | | | |
| Calix, Inc. |
| Reconciliation of GAAP to Non-GAAP Operating Expenses |
| (Unaudited, in thousands) |
| | | | | | |
| | Three Months Ended |
| | December 31, | | September 30, | | July 1, | | April 1, | | December 31, |
| | 2023 | | 2023 | | 2023 | | 2023 | | 2022 |
| GAAP operating expenses: | | | | | | | | | | |
| Sales and marketing | | $ | 55,747 | | | $ | 52,356 | | | $ | 54,596 | | | $ | 51,865 | | | $ | 51,186 | |
| Research and development | | 42,295 | | | 46,963 | | | 45,341 | | | 43,173 | | | 38,551 | |
| General and administrative | | 24,045 | | | 25,301 | | | 24,722 | | | 23,077 | | | 22,096 | |
| | 122,087 | | | 124,620 | | | 124,659 | | | 118,115 | | | 111,833 | |
| Stock-based compensation: | | | | | | | | | | |
| Sales and marketing | | (3,075) | | | (4,333) | | | (5,053) | | | (4,432) | | | (3,590) | |
| Research and development | | (3,583) | | | (4,245) | | | (4,860) | | | (4,312) | | | (3,353) | |
| General and administrative | | (5,424) | | | (6,714) | | | (7,151) | | | (6,676) | | | (5,647) | |
| | (12,082) | | | (15,292) | | | (17,064) | | | (15,420) | | | (12,590) | |
| Non-GAAP operating expenses: | | | | | | | | | | |
| Sales and marketing | | 52,672 | | | 48,023 | | | 49,543 | | | 47,433 | | | 47,596 | |
| Research and development | | 38,712 | | | 42,718 | | | 40,481 | | | 38,861 | | | 35,198 | |
| General and administrative | | 18,621 | | | 18,587 | | | 17,571 | | | 16,401 | | | 16,449 | |
| | $ | 110,005 | | | $ | 109,328 | | | $ | 107,595 | | | $ | 102,695 | | | $ | 99,243 | |
| | | | | | | | | | | | | | | | | | | | | | | | | | | | | | | | | | | |
| Calix, Inc. |
| Reconciliation of GAAP Net Income (Loss) to Non-GAAP Net Income |
| (Unaudited, in thousands) |
| | Three Months Ended | |
| | December 31, | | September 30, | | July 1, | | April 1, | | December 31, | |
| | 2023 | | 2023 | | 2023 | | 2023 | | 2022 | |
| GAAP net income (loss) | | $ | (4,142) | | | $ | 16,953 | | | $ | 9,373 | | | $ | 9,598 | | | $ | 11,927 | | |
| Adjustments to GAAP amount: | | | | | | | | | | | |
| Stock-based compensation | | 12,681 | | | 16,026 | | | 17,844 | | | 16,220 | | | 13,325 | | |
| Intangible asset amortization | | 757 | | | 658 | | | 658 | | | 658 | | | 658 | | |
| Inventory and component liability charges | | 28,675 | | | — | | | — | | | — | | | — | | |
Income tax effect of non-GAAP adjustments | | (8,536) | | | (2,641) | | | (2,672) | | | (4,978) | | | (1,857) | | |
| Non-GAAP net income | | $ | 29,435 | | | $ | 30,996 | | | $ | 25,203 | | | $ | 21,498 | | | $ | 24,053 | | |
| | | | | | | | | | | |
| | | | | | | | | | | | | | | | | | | | | | | | | | | | | | | | |
| Calix, Inc. |
| Non-GAAP Free Cash Flow Reconciliation |
| (Unaudited, in thousands) |
| | | | | | |
| | Three Months Ended |
| | December 31, | | September 30, | | July 1, | | April 1, | | December 31, |
| | 2023 | | 2023 | | 2023 | | 2023 | | 2022 |
| Net cash provided by operating activities | | $ | 14,924 | | | $ | 15,751 | | | $ | 17,464 | | | $ | 8,112 | | | $ | 6,105 | |
| Purchases of property and equipment | | (3,972) | | | (3,776) | | | (5,489) | | | (4,618) | | | (4,807) | |
| Non-GAAP free cash flow | | $ | 10,952 | | | $ | 11,975 | | | $ | 11,975 | | | $ | 3,494 | | | $ | 1,298 | |
| | | | | | | | |
| Calix, Inc. |
Reconciliation of GAAP Net Loss to Non-GAAP Net Income Per Diluted Common Share 1 |
| (Unaudited) |
| | Three Months Ended
December 31, 2023 |
| |
| GAAP net loss per diluted common share | | $ | (0.06) | |
| Adjustments to GAAP amount: | | |
| Stock-based compensation | | 0.18 | |
| Intangible asset amortization | | 0.01 | |
| Inventory and component liability charges | | 0.43 | |
Income tax effect of non-GAAP adjustments | | (0.13) | |
| Non-GAAP net income per diluted common share | | $ | 0.43 | |
| | | | | | | |
1 | Based on 68.3 million weighted-average diluted common shares outstanding. | | |
| | | |
| | | |
| | | |
| | | |
| | | |
| | | |
| | | |
| | | |
| | | | | | | | | | | | | | | | | | | | | | | | | | |
| Calix, Inc. |
| Reconciliation of GAAP to Non-GAAP Guidance |
| (Unaudited, dollars in thousands, except per share data) |
| Three Months Ending March 30, 2024 |
| | GAAP | | Stock-Based Compensation | | Intangible
Asset Amortization | | Non-GAAP |
| Gross margin | | 53.0% - 55.0% | | 0.3% | | 0.2% | | 53.5% - 55.5% |
| Operating expenses | | $123,000 - $126,000 | | $(15,000) | | $ — | | $108,000 - $111,000 |
Net income (loss) per diluted common share 1 | | $(0.04) - $0.02 | | $0.20 2 | | $0.01 2 | | $0.17 - $0.23 |
| | | | | | | |
1 | Based on 68.3 million weighted-average diluted common shares outstanding. | | |
2 | Net of income taxes. | | |
| | | |
| | | |
| | | |
| | | |
| | | |
| | | |
| | | |
| | | |
| X |
- DefinitionBoolean flag that is true when the XBRL content amends previously-filed or accepted submission.
| Name: |
dei_AmendmentFlag |
| Namespace Prefix: |
dei_ |
| Data Type: |
xbrli:booleanItemType |
| Balance Type: |
na |
| Period Type: |
duration |
|
| X |
- DefinitionFor the EDGAR submission types of Form 8-K: the date of the report, the date of the earliest event reported; for the EDGAR submission types of Form N-1A: the filing date; for all other submission types: the end of the reporting or transition period. The format of the date is YYYY-MM-DD.
| Name: |
dei_DocumentPeriodEndDate |
| Namespace Prefix: |
dei_ |
| Data Type: |
xbrli:dateItemType |
| Balance Type: |
na |
| Period Type: |
duration |
|
| X |
- DefinitionThe type of document being provided (such as 10-K, 10-Q, 485BPOS, etc). The document type is limited to the same value as the supporting SEC submission type, or the word 'Other'.
| Name: |
dei_DocumentType |
| Namespace Prefix: |
dei_ |
| Data Type: |
dei:submissionTypeItemType |
| Balance Type: |
na |
| Period Type: |
duration |
|
| X |
- DefinitionAddress Line 1 such as Attn, Building Name, Street Name
| Name: |
dei_EntityAddressAddressLine1 |
| Namespace Prefix: |
dei_ |
| Data Type: |
xbrli:normalizedStringItemType |
| Balance Type: |
na |
| Period Type: |
duration |
|
| X |
- Definition
+ References
+ Details
| Name: |
dei_EntityAddressCityOrTown |
| Namespace Prefix: |
dei_ |
| Data Type: |
xbrli:normalizedStringItemType |
| Balance Type: |
na |
| Period Type: |
duration |
|
| X |
- DefinitionCode for the postal or zip code
| Name: |
dei_EntityAddressPostalZipCode |
| Namespace Prefix: |
dei_ |
| Data Type: |
xbrli:normalizedStringItemType |
| Balance Type: |
na |
| Period Type: |
duration |
|
| X |
- DefinitionName of the state or province.
| Name: |
dei_EntityAddressStateOrProvince |
| Namespace Prefix: |
dei_ |
| Data Type: |
dei:stateOrProvinceItemType |
| Balance Type: |
na |
| Period Type: |
duration |
|
| X |
- DefinitionA unique 10-digit SEC-issued value to identify entities that have filed disclosures with the SEC. It is commonly abbreviated as CIK. Reference 1: http://www.xbrl.org/2003/role/presentationRef
-Publisher SEC
-Name Exchange Act
-Number 240
-Section 12
-Subsection b-2
| Name: |
dei_EntityCentralIndexKey |
| Namespace Prefix: |
dei_ |
| Data Type: |
dei:centralIndexKeyItemType |
| Balance Type: |
na |
| Period Type: |
duration |
|
| X |
- DefinitionIndicate if registrant meets the emerging growth company criteria. Reference 1: http://www.xbrl.org/2003/role/presentationRef
-Publisher SEC
-Name Exchange Act
-Number 240
-Section 12
-Subsection b-2
| Name: |
dei_EntityEmergingGrowthCompany |
| Namespace Prefix: |
dei_ |
| Data Type: |
xbrli:booleanItemType |
| Balance Type: |
na |
| Period Type: |
duration |
|
| X |
- DefinitionCommission file number. The field allows up to 17 characters. The prefix may contain 1-3 digits, the sequence number may contain 1-8 digits, the optional suffix may contain 1-4 characters, and the fields are separated with a hyphen.
| Name: |
dei_EntityFileNumber |
| Namespace Prefix: |
dei_ |
| Data Type: |
dei:fileNumberItemType |
| Balance Type: |
na |
| Period Type: |
duration |
|
| X |
- DefinitionTwo-character EDGAR code representing the state or country of incorporation.
| Name: |
dei_EntityIncorporationStateCountryCode |
| Namespace Prefix: |
dei_ |
| Data Type: |
dei:edgarStateCountryItemType |
| Balance Type: |
na |
| Period Type: |
duration |
|
| X |
- DefinitionThe exact name of the entity filing the report as specified in its charter, which is required by forms filed with the SEC. Reference 1: http://www.xbrl.org/2003/role/presentationRef
-Publisher SEC
-Name Exchange Act
-Number 240
-Section 12
-Subsection b-2
| Name: |
dei_EntityRegistrantName |
| Namespace Prefix: |
dei_ |
| Data Type: |
xbrli:normalizedStringItemType |
| Balance Type: |
na |
| Period Type: |
duration |
|
| X |
- DefinitionThe Tax Identification Number (TIN), also known as an Employer Identification Number (EIN), is a unique 9-digit value assigned by the IRS. Reference 1: http://www.xbrl.org/2003/role/presentationRef
-Publisher SEC
-Name Exchange Act
-Number 240
-Section 12
-Subsection b-2
| Name: |
dei_EntityTaxIdentificationNumber |
| Namespace Prefix: |
dei_ |
| Data Type: |
dei:employerIdItemType |
| Balance Type: |
na |
| Period Type: |
duration |
|
| X |
- DefinitionLocal phone number for entity.
| Name: |
dei_LocalPhoneNumber |
| Namespace Prefix: |
dei_ |
| Data Type: |
xbrli:normalizedStringItemType |
| Balance Type: |
na |
| Period Type: |
duration |
|
| X |
- DefinitionBoolean flag that is true when the Form 8-K filing is intended to satisfy the filing obligation of the registrant as pre-commencement communications pursuant to Rule 13e-4(c) under the Exchange Act. Reference 1: http://www.xbrl.org/2003/role/presentationRef
-Publisher SEC
-Name Exchange Act
-Number 240
-Section 13e
-Subsection 4c
| Name: |
dei_PreCommencementIssuerTenderOffer |
| Namespace Prefix: |
dei_ |
| Data Type: |
xbrli:booleanItemType |
| Balance Type: |
na |
| Period Type: |
duration |
|
| X |
- DefinitionBoolean flag that is true when the Form 8-K filing is intended to satisfy the filing obligation of the registrant as pre-commencement communications pursuant to Rule 14d-2(b) under the Exchange Act. Reference 1: http://www.xbrl.org/2003/role/presentationRef
-Publisher SEC
-Name Exchange Act
-Number 240
-Section 14d
-Subsection 2b
| Name: |
dei_PreCommencementTenderOffer |
| Namespace Prefix: |
dei_ |
| Data Type: |
xbrli:booleanItemType |
| Balance Type: |
na |
| Period Type: |
duration |
|
| X |
- DefinitionTitle of a 12(b) registered security. Reference 1: http://www.xbrl.org/2003/role/presentationRef
-Publisher SEC
-Name Exchange Act
-Number 240
-Section 12
-Subsection b
| Name: |
dei_Security12bTitle |
| Namespace Prefix: |
dei_ |
| Data Type: |
dei:securityTitleItemType |
| Balance Type: |
na |
| Period Type: |
duration |
|
| X |
- DefinitionName of the Exchange on which a security is registered. Reference 1: http://www.xbrl.org/2003/role/presentationRef
-Publisher SEC
-Name Exchange Act
-Number 240
-Section 12
-Subsection d1-1
| Name: |
dei_SecurityExchangeName |
| Namespace Prefix: |
dei_ |
| Data Type: |
dei:edgarExchangeCodeItemType |
| Balance Type: |
na |
| Period Type: |
duration |
|
| X |
- DefinitionBoolean flag that is true when the Form 8-K filing is intended to satisfy the filing obligation of the registrant as soliciting material pursuant to Rule 14a-12 under the Exchange Act. Reference 1: http://www.xbrl.org/2003/role/presentationRef
-Publisher SEC
-Name Exchange Act
-Section 14a
-Number 240
-Subsection 12
| Name: |
dei_SolicitingMaterial |
| Namespace Prefix: |
dei_ |
| Data Type: |
xbrli:booleanItemType |
| Balance Type: |
na |
| Period Type: |
duration |
|
| X |
- DefinitionTrading symbol of an instrument as listed on an exchange.
| Name: |
dei_TradingSymbol |
| Namespace Prefix: |
dei_ |
| Data Type: |
dei:tradingSymbolItemType |
| Balance Type: |
na |
| Period Type: |
duration |
|
| X |
- DefinitionBoolean flag that is true when the Form 8-K filing is intended to satisfy the filing obligation of the registrant as written communications pursuant to Rule 425 under the Securities Act. Reference 1: http://www.xbrl.org/2003/role/presentationRef
-Publisher SEC
-Name Securities Act
-Number 230
-Section 425
| Name: |
dei_WrittenCommunications |
| Namespace Prefix: |
dei_ |
| Data Type: |
xbrli:booleanItemType |
| Balance Type: |
na |
| Period Type: |
duration |
|
Calix (NYSE:CALX)
Historical Stock Chart
From Mar 2024 to Apr 2024

Calix (NYSE:CALX)
Historical Stock Chart
From Apr 2023 to Apr 2024
